Basic Stats
| Institutional Owners | 123 total, 115 long only, 0 short only, 8 long/short - change of -8.21% MRQ |
| Share Price | 20.40 |
| Average Portfolio Allocation | 0.3765 % - change of 4.28% MRQ |
| Institutional Shares (Long) | 24,346,962 (ex 13D/G) - change of -5.02MM shares -17.10% MRQ |
| Institutional Value (Long) | $ 435,401 USD ($1000) |
Institutional Ownership and Shareholders
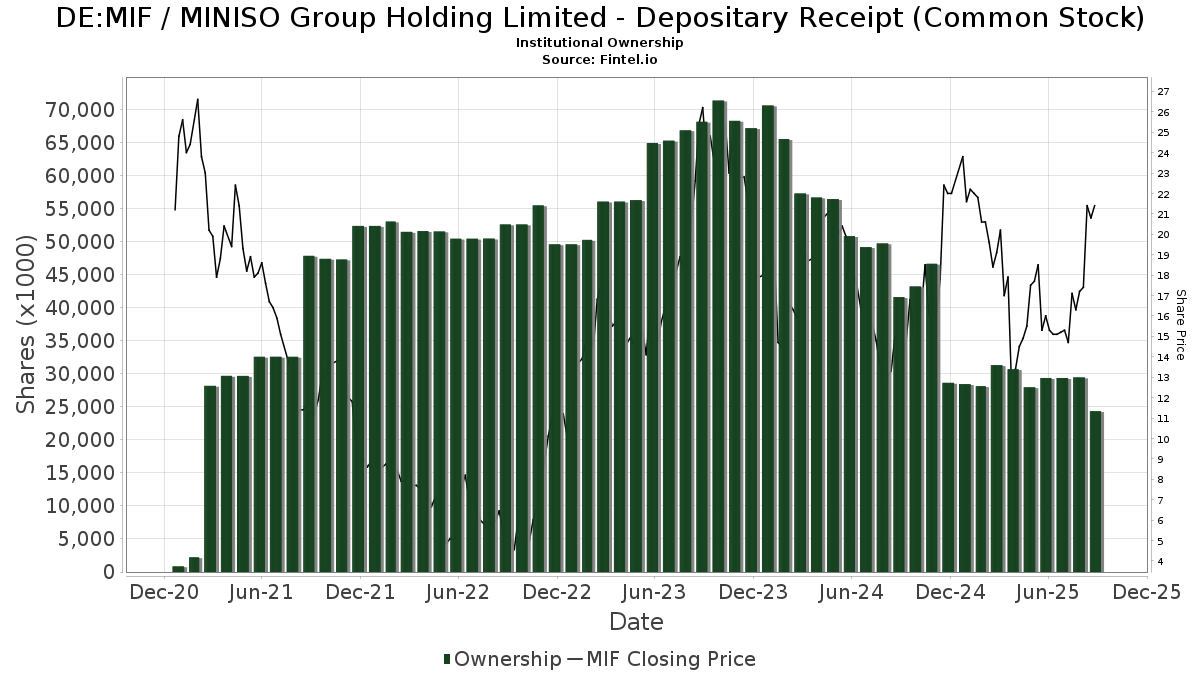
MINISO Group Holding Limited - Depositary Receipt (Common Stock) (DE:MIF) has 123 institutional owners and shareholders that have filed 13D/G or 13F forms with the Securities Exchange Commission (SEC). These institutions hold a total of 24,346,962 shares. Largest shareholders include KEYWISE CAPITAL MANAGEMENT (HK) Ltd, UBS Group AG, Marshall Wace, Llp, Morgan Stanley, Serenity Capital Management Pte. Ltd., Sequoia China Equity Partners (Hong Kong) Ltd, State Street Corp, Crossmark Global Holdings, Inc., Serenity Capital LLC, and Nordea Investment Management Ab .
MINISO Group Holding Limited - Depositary Receipt (Common Stock) (MUN:MIF) institutional ownership structure shows current positions in the company by institutions and funds, as well as latest changes in position size. Major shareholders can include individual investors, mutual funds, hedge funds, or institutions. The Schedule 13D indicates that the investor holds (or held) more than 5% of the company and intends (or intended) to actively pursue a change in business strategy. Schedule 13G indicates a passive investment of over 5%.
The share price as of September 5, 2025 is 20.40 / share. Previously, on September 9, 2024, the share price was 14.10 / share. This represents an increase of 44.68% over that period.
Fund Sentiment Score
The Fund Sentiment Score (fka Ownership Accumulation Score) finds the stocks that are being most bought by funds. It is the result of a sophisticated, multi-factor quantitative model that identifies companies with the highest levels of institutional accumulation. The scoring model uses a combination of the total increase in disclosed owners, the changes in portfolio allocations in those owners and other metrics. The number ranges from 0 to 100, with higher numbers indicating a higher level of accumulation to its peers, and 50 being the average.
Update Frequency: Daily
See Ownership Explorer, which provides a list of highest-ranking companies.
13F and NPORT Filings
Detail on 13F filings are free. Detail on NP filings require a premium membership. Green rows indicate new positions. Red rows indicate closed positions. Click the link icon to see the full transaction history.
Upgrade
to unlock premium data and export to Excel ![]() .
.
| File Date | Source | Investor | Type | Avg Price (Est) |
Shares | Δ Shares (%) |
Reported Value ($1000) |
Δ Value (%) |
Port Alloc (%) |
|
|---|---|---|---|---|---|---|---|---|---|---|
| 2025-08-14 | 13F | Weiss Asset Management LP | 61,456 | 1,120 | ||||||
| 2025-08-12 | 13F | XTX Topco Ltd | 28,647 | 522 | ||||||
| 2025-08-14 | 13F | Erste Asset Management GmbH | 0 | -100.00 | 0 | |||||
| 2025-08-12 | 13F | Aigen Investment Management, Lp | 12,798 | 233 | ||||||
| 2025-08-14 | 13F | Parallax Volatility Advisers, L.P. | Call | 0 | -100.00 | 0 | ||||
| 2025-08-08 | 13F | Larson Financial Group LLC | 70 | 1 | ||||||
| 2025-08-14 | 13F | Group One Trading, L.p. | Call | 130,800 | 41.25 | 2,383 | 39.19 | |||
| 2025-08-14 | 13F | Group One Trading, L.p. | 13,722 | 250 | ||||||
| 2025-08-14 | 13F | Group One Trading, L.p. | Put | 68,800 | 24.19 | 1,254 | 22.36 | |||
| 2025-05-05 | 13F | Creekmur Asset Management LLC | 0 | -100.00 | 0 | |||||
| 2025-05-20 | 13F/A | Lansdowne Partners (uk) Llp | 0 | -100.00 | 0 | -100.00 | ||||
| 2025-08-14 | 13F | Sunbelt Securities, Inc. | 2,030 | 0.00 | 49 | 29.73 | ||||
| 2025-08-05 | 13F | Simplex Trading, Llc | Call | 75,100 | 59.11 | 1 | ||||
| 2025-07-30 | NP | APIE - ActivePassive International Equity ETF | 8,277 | -61.74 | 141 | -68.89 | ||||
| 2025-05-15 | 13F | Schonfeld Strategic Advisors LLC | 0 | -100.00 | 0 | |||||
| 2025-08-07 | 13F | Connor, Clark & Lunn Investment Management Ltd. | 0 | -100.00 | 0 | -100.00 | ||||
| 2025-08-14 | 13F | Jane Street Group, Llc | Put | 71,900 | -26.86 | 1,310 | -27.90 | |||
| 2025-08-05 | 13F | Simplex Trading, Llc | Put | 18,400 | -73.10 | 0 | -100.00 | |||
| 2025-08-05 | 13F | Simplex Trading, Llc | 2,020 | -95.59 | 0 | |||||
| 2025-08-14 | 13F | Jane Street Group, Llc | Call | 112,900 | -0.88 | 2,057 | -2.33 | |||
| 2025-05-15 | 13F | Tudor Investment Corp Et Al | Call | 0 | -100.00 | 0 | ||||
| 2025-08-14 | 13F | Jane Street Group, Llc | 13,828 | -96.63 | 252 | -96.69 | ||||
| 2025-05-05 | 13F | Pictet Asset Management Holding SA | 0 | -100.00 | 0 | |||||
| 2025-08-08 | 13F | M&G Plc | 0 | -100.00 | 0 | |||||
| 2025-08-14 | 13F | UBS Group AG | 2,520,980 | -40.64 | 45,932 | -41.51 | ||||
| 2025-08-07 | 13F | Vise Technologies, Inc. | 0 | -100.00 | 0 | |||||
| 2025-08-12 | 13F | Legal & General Group Plc | 352,471 | -0.47 | 6,417 | -1.99 | ||||
| 2025-08-11 | 13F | Citigroup Inc | 148 | -48.07 | 3 | -60.00 | ||||
| 2025-08-13 | 13F | Marshall Wace, Llp | 1,776,960 | 131.10 | 32,376 | 127.73 | ||||
| 2025-08-13 | 13F | Hsbc Holdings Plc | 0 | -100.00 | 0 | |||||
| 2025-08-13 | 13F | Invesco Ltd. | 22,894 | -19.16 | 417 | -20.27 | ||||
| 2025-08-14 | 13F | Vident Advisory, LLC | 29,127 | 18.02 | 531 | 16.23 | ||||
| 2025-08-28 | NP | GXC - SPDR(R) S&P(R) CHINA ETF | 16,479 | -10.15 | 300 | -11.50 | ||||
| 2025-07-28 | NP | AVEM - Avantis Emerging Markets Equity ETF This fund is a listed as child fund of American Century Companies Inc and if that institution has disclosed ownership in this security, then these positions will not be double counted when calculating total shares and total value | 117,342 | 0.00 | 1,997 | -18.19 | ||||
| 2025-08-07 | 13F | Allworth Financial LP | 7 | 0 | ||||||
| 2025-08-12 | 13F | MAI Capital Management | 341 | 0.00 | 6 | 0.00 | ||||
| 2025-06-23 | NP | UGPIX - UltraChina ProFund Investor Class | 5,405 | -24.36 | 97 | -40.85 | ||||
| 2025-07-22 | 13F | IMC-Chicago, LLC | 23,857 | -16.19 | 435 | -17.49 | ||||
| 2025-07-22 | 13F | IMC-Chicago, LLC | Put | 45,100 | 6.62 | 822 | 4.99 | |||
| 2025-07-22 | 13F | IMC-Chicago, LLC | Call | 24,300 | -12.59 | 443 | -14.01 | |||
| 2025-08-14 | 13F | Van Eck Associates Corp | 279,533 | 16.99 | 5 | 25.00 | ||||
| 2025-08-13 | 13F | Walleye Capital LLC | 0 | -100.00 | 0 | |||||
| 2025-08-15 | 13F | Tower Research Capital LLC (TRC) | 0 | -100.00 | 0 | |||||
| 2025-08-12 | 13F | Steward Partners Investment Advisory, Llc | 8 | 0 | ||||||
| 2025-08-12 | 13F | AI-Squared Management Ltd | 0 | -100.00 | 0 | |||||
| 2025-07-29 | 13F | Virginia Retirement Systems Et Al | 0 | -100.00 | 0 | |||||
| 2025-08-12 | 13F | Proequities, Inc. | Put | 0 | 0 | |||||
| 2025-08-13 | 13F | Walleye Capital LLC | Put | 0 | -100.00 | 0 | ||||
| 2025-08-12 | 13F | Proequities, Inc. | Call | 0 | 0 | |||||
| 2025-08-13 | 13F | Walleye Capital LLC | Call | 0 | -100.00 | 0 | ||||
| 2025-08-12 | 13F | IvyRock Asset Management (HK) Ltd | 0 | -100.00 | 0 | |||||
| 2025-08-12 | 13F | Proequities, Inc. | 0 | 0 | ||||||
| 2025-08-12 | 13F | Coldstream Capital Management Inc | 0 | -100.00 | 0 | |||||
| 2025-08-14 | 13F | Citadel Advisors Llc | Put | 0 | -100.00 | 0 | -100.00 | |||
| 2025-08-28 | NP | NDOW - Anydrus Advantage ETF | 0 | -100.00 | 0 | -100.00 | ||||
| 2025-08-14 | 13F | Ubs Asset Management Americas Inc | 2,836 | 52 | ||||||
| 2025-05-13 | 13F | Norges Bank | 0 | -100.00 | 0 | -100.00 | ||||
| 2025-08-14 | 13F | Susquehanna International Group, Llp | Call | 0 | -100.00 | 0 | ||||
| 2025-08-12 | 13F | Jpmorgan Chase & Co | 10 | 0.00 | 0 | |||||
| 2025-05-13 | 13F | Fox Run Management, L.l.c. | 0 | -100.00 | 0 | -100.00 | ||||
| 2025-05-15 | 13F | Two Sigma Advisers, Lp | 0 | -100.00 | 0 | |||||
| 2025-08-12 | 13F | CIBC Private Wealth Group, LLC | 482 | 0.00 | 9 | 33.33 | ||||
| 2025-04-30 | 13F | Sofos Investments, Inc. | 15 | 0 | ||||||
| 2025-05-15 | 13F | D. E. Shaw & Co., Inc. | 0 | -100.00 | 0 | |||||
| 2025-05-13 | 13F | Qtron Investments LLC | 0 | -100.00 | 0 | |||||
| 2025-08-13 | 13F | EverSource Wealth Advisors, LLC | 2,223 | 37.65 | 41 | 37.93 | ||||
| 2025-08-14 | 13F | Hrt Financial Lp | 0 | -100.00 | 0 | |||||
| 2025-08-14 | 13F | Goldman Sachs Group Inc | 329,456 | 4.45 | 6,003 | 2.91 | ||||
| 2025-06-26 | NP | DFAE - Dimensional Emerging Core Equity Market ETF | 1,100 | 0.00 | 20 | -24.00 | ||||
| 2025-08-12 | 13F | BlackRock, Inc. | 92,307 | -56.76 | 1,682 | -57.41 | ||||
| 2025-07-31 | 13F | Briaud Financial Planning, Inc | 426 | 0 | ||||||
| 2025-06-30 | NP | AIM INTERNATIONAL MUTUAL FUNDS (INVESCO INTERNATIONAL MUTUAL FUNDS) - Invesco Oppenheimer Global Multi-Asset Growth Fund Class R6 | 472 | 74.17 | 9 | 33.33 | ||||
| 2025-08-14 | 13F | Bank Of America Corp /de/ | 220,871 | -54.98 | 4,024 | -55.64 | ||||
| 2025-08-05 | 13F | NewSquare Capital LLC | 34 | 0.00 | 1 | |||||
| 2025-08-12 | 13F | Rhumbline Advisers | 2,013 | 2.18 | 37 | 0.00 | ||||
| 2025-08-13 | 13F | Sequoia China Equity Partners (Hong Kong) Ltd | 974,951 | -23.52 | 17,764 | -24.64 | ||||
| 2025-08-14 | 13F | Susquehanna International Group, Llp | 194,467 | -0.13 | 3,543 | -1.58 | ||||
| 2025-08-28 | NP | SSTIX - State Street Total Return V.I.S. Fund Class 1 Shares | 576 | -58.86 | 10 | -60.00 | ||||
| 2025-08-14 | 13F | Citadel Advisors Llc | 231,025 | 220.17 | 4,209 | 215.52 | ||||
| 2025-08-14 | 13F | Citadel Advisors Llc | Call | 132,000 | 91.30 | 2,405 | 88.63 | |||
| 2025-08-14 | 13F | Susquehanna International Group, Llp | Put | 191,300 | 20.92 | 3,485 | 19.15 | |||
| 2025-08-13 | 13F | Northwestern Mutual Wealth Management Co | 177 | 3 | ||||||
| 2025-08-14 | 13F | Old Mission Capital Llc | 0 | -100.00 | 0 | |||||
| 2025-05-14 | 13F | Taikang Asset Management (Hong Kong) Co Ltd | 0 | -100.00 | 0 | |||||
| 2025-07-24 | 13F | Ronald Blue Trust, Inc. | 170 | -78.37 | 3 | -78.57 | ||||
| 2025-05-15 | 13F | Two Sigma Investments, Lp | 0 | -100.00 | 0 | |||||
| 2025-08-14 | 13F | XY Capital Ltd | 0 | -100.00 | 0 | |||||
| 2025-06-30 | 13F/A | Deutsche Bank Ag\ | 0 | -100.00 | 0 | -100.00 | ||||
| 2025-07-21 | 13F | Qrg Capital Management, Inc. | 0 | -100.00 | 0 | |||||
| 2025-07-28 | NP | NSI - National Security Emerging Markets Index ETF | 825 | 38.66 | 14 | 16.67 | ||||
| 2025-08-12 | 13F | Tairen Capital Ltd | 378,270 | 26.86 | 6,892 | 25.01 | ||||
| 2025-08-29 | NP | JVANX - International Equity Index Trust NAV | 3,276 | 0.00 | 60 | -1.67 | ||||
| 2025-08-14 | 13F | Millennium Management Llc | 363,340 | 207.00 | 6,620 | 202.56 | ||||
| 2025-05-13 | 13F | Schroder Investment Management Group | 0 | -100.00 | 0 | -100.00 | ||||
| 2025-07-09 | 13F | Byrne Asset Management LLC | 0 | -100.00 | 0 | |||||
| 2025-08-11 | 13F | Keystone Investors Pte Ltd | 145,300 | 2,647 | ||||||
| 2025-08-21 | NP | VanEck VIP Trust - VanEck VIP Emerging Markets Fund Initial Class | 56,000 | 27.27 | 1,020 | 25.46 | ||||
| 2025-08-14 | 13F | Davidson Kempner Capital Management Lp | 110,576 | 2,015 | ||||||
| 2025-08-14 | 13F | Bnp Paribas Arbitrage, Sa | 35,516 | -72.18 | 647 | -72.58 | ||||
| 2025-08-08 | 13F | Financial Gravity Companies, Inc. | 7 | -53.33 | 0 | |||||
| 2025-06-24 | NP | TLTE - FlexShares Morningstar Emerging Markets Factor Tilt Index Fund | 1,992 | 0.00 | 36 | -22.22 | ||||
| 2025-08-01 | 13F | Brinker Capital Investments, LLC | 0 | -100.00 | 0 | -100.00 | ||||
| 2025-07-11 | 13F | Farther Finance Advisors, LLC | 96 | -54.72 | 2 | -75.00 | ||||
| 2025-05-06 | 13F | Venturi Wealth Management, LLC | 0 | -100.00 | 0 | |||||
| 2025-08-14 | 13F | Boston Private Wealth Llc | 0 | -100.00 | 0 | |||||
| 2025-05-05 | 13F | Lindbrook Capital, Llc | 34 | -66.34 | 1 | -100.00 | ||||
| 2025-08-14 | 13F/A | Skopos Labs, Inc. | 3,619 | 119.20 | 66 | 116.67 | ||||
| 2025-07-24 | 13F | Us Bancorp \de\ | 4,559 | -33.56 | 83 | -34.13 | ||||
| 2025-04-17 | 13F | Janney Montgomery Scott LLC | 0 | -100.00 | 0 | |||||
| 2025-08-06 | NP | LINCOLN VARIABLE INSURANCE PRODUCTS TRUST - LVIP SSGA Emerging Markets Equity Index Fund Standard Class | 2,865 | 0.00 | 52 | 0.00 | ||||
| 2025-05-15 | 13F | Caption Management, LLC | 0 | -100.00 | 0 | |||||
| 2025-07-29 | 13F | Nordea Investment Management Ab | 397,322 | 5.66 | 7,215 | 3.84 | ||||
| 2025-08-13 | 13F | Walleye Trading LLC | Put | 18,700 | -49.18 | 341 | -50.00 | |||
| 2025-08-13 | 13F | Walleye Trading LLC | Call | 20,500 | -50.96 | 374 | -51.68 | |||
| 2025-05-06 | 13F | Y-Intercept (Hong Kong) Ltd | 0 | -100.00 | 0 | -100.00 | ||||
| 2025-07-25 | 13F | Cwm, Llc | 263 | 115.57 | 0 | |||||
| 2025-05-16 | 13F | Bell Investment Advisors, Inc | 0 | -100.00 | 0 | |||||
| 2025-08-18 | 13F | Wolverine Trading, Llc | Call | 65,400 | 205.61 | 1,165 | 193.45 | |||
| 2025-08-13 | 13F | Walleye Trading LLC | 0 | -100.00 | 0 | -100.00 | ||||
| 2025-08-18 | 13F | Wolverine Trading, Llc | Put | 12,300 | -26.79 | 219 | -29.81 | |||
| 2025-08-14 | 13F | Peak6 Llc | 6,128 | 112 | ||||||
| 2025-07-11 | 13F | UMA Financial Services, Inc. | 0 | -100.00 | 0 | |||||
| 2025-08-28 | NP | GMF - SPDR(R) S&P(R) EMERGING ASIA PACIFIC ETF | 4,295 | -6.53 | 78 | -7.14 | ||||
| 2025-07-31 | 13F | Caitong International Asset Management Co., Ltd | 0 | -100.00 | 0 | |||||
| 2025-08-14 | 13F | Peak6 Llc | Put | 8,700 | 0.00 | 159 | -1.25 | |||
| 2025-08-14 | 13F | Peak6 Llc | Call | 15,200 | -90.16 | 277 | -90.33 | |||
| 2025-08-14 | 13F | Wells Fargo & Company/mn | 597 | -19.97 | 11 | -23.08 | ||||
| 2025-08-12 | 13F | Atlas Capital Advisors Llc | 6,705 | 0.00 | 122 | -0.81 | ||||
| 2025-08-12 | 13F | American Century Companies Inc | 133,224 | 0.45 | 2,427 | -1.02 | ||||
| 2025-08-13 | 13F | Quadrant Capital Group Llc | 41,972 | 12,244.71 | 765 | 12,633.33 | ||||
| 2025-08-14 | 13F | Quantinno Capital Management LP | 34,806 | 72.81 | 634 | 70.43 | ||||
| 2025-05-09 | 13F | J. Safra Sarasin Holding AG | 0 | -100.00 | 0 | |||||
| 2025-05-30 | NP | CGRO - CoreValues Alpha Greater China Growth ETF | 10,438 | -50.82 | 193 | -52.48 | ||||
| 2025-08-14 | 13F | Ameriprise Financial Inc | 14,770 | 1.99 | 269 | 0.75 | ||||
| 2025-07-21 | 13F | Mirae Asset Global Investments Co., Ltd. | 4,043 | 7.30 | 74 | 4.29 | ||||
| 2025-08-14 | 13F | Macquarie Group Ltd | 13,816 | 0.00 | 252 | -1.57 | ||||
| 2025-09-04 | 13F/A | Advisor Group Holdings, Inc. | 351 | 3,800.00 | 6 | |||||
| 2025-08-28 | NP | SPEM - SPDR(R) Portfolio Emerging Markets ETF | 117,786 | 1.94 | 2,146 | 0.47 | ||||
| 2025-05-15 | 13F | Advisors Asset Management, Inc. | 0 | -100.00 | 0 | |||||
| 2025-07-16 | 13F | Signaturefd, Llc | 107 | -36.31 | 2 | -66.67 | ||||
| 2025-05-14 | 13F | Candriam Luxembourg S.C.A. | 0 | -100.00 | 0 | |||||
| 2025-07-24 | 13F | Jfs Wealth Advisors, Llc | 46 | 24.32 | 1 | |||||
| 2025-08-13 | 13F | Victory Capital Management Inc | 11,791 | 0.00 | 215 | -1.83 | ||||
| 2025-08-12 | 13F | LPL Financial LLC | 11,152 | -6.06 | 203 | -7.31 | ||||
| 2025-08-14 | 13F | Fmr Llc | 1,085 | -71.68 | 20 | -72.86 | ||||
| 2025-08-07 | 13F | Aviva Plc | 55,825 | -1.54 | 1,017 | -2.96 | ||||
| 2025-08-08 | 13F | Creative Planning | 16,662 | 45.08 | 304 | 42.92 | ||||
| 2025-04-29 | 13F | Penserra Capital Management LLC | 0 | -100.00 | 0 | |||||
| 2025-08-08 | 13F | SBI Securities Co., Ltd. | 1,094 | 286.57 | 20 | 280.00 | ||||
| 2025-08-14 | 13F | Wexford Capital Lp | 0 | -100.00 | 0 | |||||
| 2025-08-14 | 13F | Toroso Investments, LLC | 0 | -100.00 | 0 | |||||
| 2025-08-13 | 13F | Northern Trust Corp | 22,037 | -6.33 | 402 | -7.60 | ||||
| 2025-08-14 | 13F/A | Barclays Plc | 38,837 | 1 | ||||||
| 2025-08-21 | NP | GBFAX - Emerging Markets Fund Class A | 200,000 | 11.11 | 3,644 | 9.50 | ||||
| 2025-08-14 | 13F | KEYWISE CAPITAL MANAGEMENT (HK) Ltd | 9,335,035 | 1.33 | 170,084 | -0.15 | ||||
| 2025-04-15 | 13F | SG Americas Securities, LLC | 0 | -100.00 | 0 | |||||
| 2025-08-08 | 13F | Pnc Financial Services Group, Inc. | 1,933 | 141.02 | 35 | 150.00 | ||||
| 2025-08-13 | 13F | Russell Investments Group, Ltd. | 10,400 | -36.59 | 189 | -37.62 | ||||
| 2025-08-15 | 13F | Sylebra Capital Llc | 0 | -100.00 | 0 | |||||
| 2025-07-28 | NP | TEMUX - Emerging Markets Equity Fund | 54,000 | 58.82 | 919 | 29.99 | ||||
| 2025-05-14 | 13F | Renaissance Technologies Llc | 0 | -100.00 | 0 | |||||
| 2025-07-28 | NP | AVSE - Avantis Responsible Emerging Markets Equity ETF | 3,339 | 13.30 | 57 | -8.20 | ||||
| 2025-08-14 | 13F | State Street Corp | 928,833 | -19.58 | 16,923 | -20.76 | ||||
| 2025-08-14 | 13F | LMR Partners LLP | 0 | -100.00 | 0 | |||||
| 2025-08-04 | 13F | Hantz Financial Services, Inc. | 2,139 | 3,465.00 | 0 | |||||
| 2025-08-14 | 13F | Raymond James Financial Inc | 299 | 5 | ||||||
| 2025-05-14 | 13F | MY.Alpha Management HK Advisors Ltd | 0 | -100.00 | 0 | |||||
| 2025-08-29 | 13F | Infini Capital Management Ltd | 15,650 | 0.00 | 285 | -1.38 | ||||
| 2025-08-01 | 13F | Envestnet Asset Management Inc | 17,913 | 326 | ||||||
| 2025-05-15 | 13F | Serenity Capital LLC | 463,450 | 8,569 | ||||||
| 2025-05-15 | 13F | Manufacturers Life Insurance Company, The | 0 | -100.00 | 0 | |||||
| 2025-08-14 | 13F | Mariner, LLC | 14,411 | -4.25 | 263 | -5.76 | ||||
| 2025-07-08 | 13F | Parallel Advisors, LLC | 389 | -58.31 | 7 | -58.82 | ||||
| 2025-07-30 | 13F | DekaBank Deutsche Girozentrale | 19,573 | 0.00 | 0 | |||||
| 2025-08-08 | 13F | Alberta Investment Management Corp | 20,100 | 0.00 | 366 | -1.35 | ||||
| 2025-08-13 | 13F | Mackenzie Financial Corp | 129,904 | -32.56 | 2,367 | -33.56 | ||||
| 2025-08-11 | 13F | Principal Securities, Inc. | 0 | -100.00 | 0 | |||||
| 2025-08-11 | 13F | Banque Cantonale Vaudoise | 4,024 | 0.00 | 0 | |||||
| 2025-08-15 | 13F | Morgan Stanley | 1,251,644 | -52.29 | 22,805 | -52.99 | ||||
| 2025-07-24 | 13F | GFG Capital, LLC | 3,165 | 58 | ||||||
| 2025-08-14 | 13F | Linden Advisors Lp | 50,590 | -40.27 | 922 | -41.15 | ||||
| 2025-08-28 | NP | SSGVX - State Street Global Equity ex-U.S. Index Portfolio State Street Global All Cap Equity ex-U.S. Index Portfolio This fund is a listed as child fund of State Street Corp and if that institution has disclosed ownership in this security, then these positions will not be double counted when calculating total shares and total value | 21,700 | 0.00 | 395 | -1.50 | ||||
| 2025-08-14 | 13F | Stifel Financial Corp | 88,114 | 1,605 | ||||||
| 2025-08-14 | 13F | Verition Fund Management LLC | 13,539 | 247 | ||||||
| 2025-08-13 | 13F | Serenity Capital Management Pte. Ltd. | 1,157,662 | 149.79 | 21,093 | 146.14 | ||||
| 2025-06-27 | NP | PGJ - Invesco Golden Dragon China ETF This fund is a listed as child fund of Invesco Ltd. and if that institution has disclosed ownership in this security, then these positions will not be double counted when calculating total shares and total value | 27,918 | -24.74 | 503 | -40.96 | ||||
| 2025-08-28 | NP | SPGM - SPDR(R) Portfolio MSCI Global Stock Market ETF | 372 | 2.48 | 7 | 0.00 | ||||
| 2025-08-28 | NP | SSKEX - State Street Emerging Markets Equity Index Fund Class K This fund is a listed as child fund of State Street Corp and if that institution has disclosed ownership in this security, then these positions will not be double counted when calculating total shares and total value | 6,396 | 0.00 | 117 | -1.69 | ||||
| 2025-08-14 | 13F | Barometer Capital Management Inc. | 16,900 | 43.22 | 308 | 44.13 | ||||
| 2025-08-13 | 13F | Healthcare Of Ontario Pension Plan Trust Fund | 0 | -100.00 | 0 | |||||
| 2025-04-21 | 13F | Nelson, Van Denburg & Campbell Wealth Management Group, LLC | 0 | -100.00 | 0 | |||||
| 2025-08-08 | 13F | Crossmark Global Holdings, Inc. | 679,199 | 12,375 | ||||||
| 2025-05-12 | 13F | Allianz Se | 0 | -100.00 | 0 | -100.00 | ||||
| 2025-07-16 | 13F | Strategic Investment Solutions, Inc. /IL | 100 | 0.00 | 2 | 0.00 | ||||
| 2025-07-22 | 13F | Gsa Capital Partners Llp | 123,531 | 608.52 | 2 | |||||
| 2025-07-28 | NP | AVEEX - Avantis Emerging Markets Equity Fund Institutional Class This fund is a listed as child fund of American Century Companies Inc and if that institution has disclosed ownership in this security, then these positions will not be double counted when calculating total shares and total value | 11,647 | 0.00 | 198 | -18.18 | ||||
| 2025-08-12 | 13F | O'shaughnessy Asset Management, Llc | 0 | -100.00 | 0 | |||||
| 2025-07-16 | 13F | ABS Direct Equity Fund LLC | 0 | -100.00 | 0 | |||||
| 2025-08-14 | 13F | Royal Bank Of Canada | 675 | -97.49 | 12 | -97.59 | ||||
| 2025-08-14 | 13F | Balyasny Asset Management Llc | 208,715 | 3,803 | ||||||
| 2025-04-24 | NP | USEMX - Emerging Markets Fund Shares | 30,465 | -2.96 | 634 | 0.80 | ||||
| 2025-05-14 | 13F | Orion Portfolio Solutions, LLC | 8,460 | 0.00 | 202 | 0.00 | ||||
| 2025-04-24 | NP | USIFX - International Fund Shares | 97,790 | -11.34 | 2,035 | -7.79 | ||||
| 2025-08-14 | 13F | Polymer Capital Management (HK) LTD | 260,053 | 4,738 | ||||||
| 2025-05-13 | 13F | Ethic Inc. | 0 | -100.00 | 0 |