Basic Stats
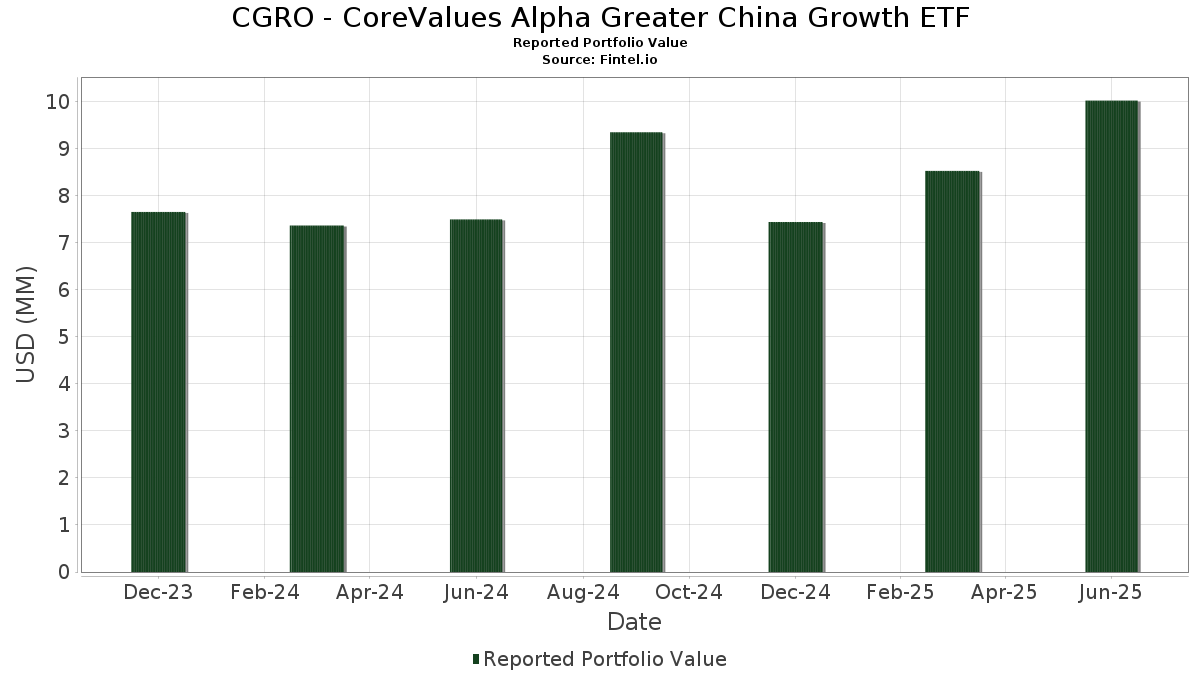
| Portfolio Value | $ 10,023,317 |
| Current Positions | 32 |
Latest Holdings, Performance, AUM (from 13F, 13D)
CGRO - CoreValues Alpha Greater China Growth ETF has disclosed 32 total holdings in their latest SEC filings. Most recent portfolio value is calculated to be $ 10,023,317 USD. Actual Assets Under Management (AUM) is this value plus cash (which is not disclosed). CGRO - CoreValues Alpha Greater China Growth ETF’s top holdings are Xiaomi Corporation (HK:1810) , Alibaba Group Holding Limited - Depositary Receipt (Common Stock) (US:BABA) , BYD Company Limited - Depositary Receipt (Common Stock) (US:BYDDY) , Tencent Holdings Limited (DE:NNND) , and Luckin Coffee Inc. - Depositary Receipt (Common Stock) (US:LKNCY) . CGRO - CoreValues Alpha Greater China Growth ETF’s new positions include WuXi AppTec Co., Ltd. (CN:603259) , Atour Lifestyle Holdings Limited - Depositary Receipt (Common Stock) (US:ATAT) , WisdomTree Trust - WisdomTree Emerging Markets Efficient Core Fund (US:NTSE) , .
Top Increases This Quarter
We use the change in the portfolio allocation because this is the most meaningful metric. Changes can be due to trades or changes in share prices.
| Security | Shares (MM) |
Value (MM$) |
Portfolio % | ΔPortfolio % |
|---|---|---|---|---|
| 0.45 | 0.37 | 3.7563 | 3.7563 | |
| 0.02 | 0.20 | 2.0783 | 2.0783 | |
| 0.02 | 0.18 | 1.8556 | 1.8556 | |
| 0.02 | 0.18 | 1.8556 | 1.8556 | |
| 0.01 | 0.17 | 1.6793 | 1.6793 | |
| 0.00 | 0.15 | 1.5204 | 1.5204 | |
| 0.02 | 0.31 | 3.1411 | 0.9854 | |
| 0.23 | 0.23 | 2.3686 | 0.6654 | |
| 0.13 | 0.97 | 9.8917 | 0.6646 | |
| 0.01 | 0.31 | 3.1579 | 0.6610 |
Top Decreases This Quarter
We use the change in the portfolio allocation because this is the most meaningful metric. Changes can be due to trades or changes in share prices.
| Security | Shares (MM) |
Value (MM$) |
Portfolio % | ΔPortfolio % |
|---|---|---|---|---|
| 0.00 | 0.35 | 3.5888 | -3.7507 | |
| 0.04 | 0.68 | 6.8830 | -1.5723 | |
| 0.03 | 0.45 | 4.5495 | -1.2318 | |
| 0.01 | 0.73 | 7.4244 | -1.2117 | |
| 0.01 | 0.65 | 6.5792 | -1.0170 | |
| 0.01 | 0.46 | 4.6589 | -0.8230 | |
| 0.01 | 0.41 | 4.2108 | -0.3638 | |
| 0.03 | 0.37 | 3.7062 | -0.3084 | |
| 0.01 | 0.22 | 2.2347 | -0.3007 | |
| 0.01 | 0.15 | 1.5436 | -0.2484 |
13F and Fund Filings
This form was filed on 2025-08-27 for the reporting period 2025-06-30. Click the link icon to see the full transaction history.
Upgrade to unlock premium data and export to Excel ![]() .
.