Basic Stats
| Institutional Owners | 151 total, 150 long only, 0 short only, 1 long/short - change of -0.66% MRQ |
| Average Portfolio Allocation | 0.1946 % - change of -10.86% MRQ |
| Institutional Shares (Long) | 11,944,231 (ex 13D/G) - change of -0.06MM shares -0.48% MRQ |
| Institutional Value (Long) | $ 327,556 USD ($1000) |
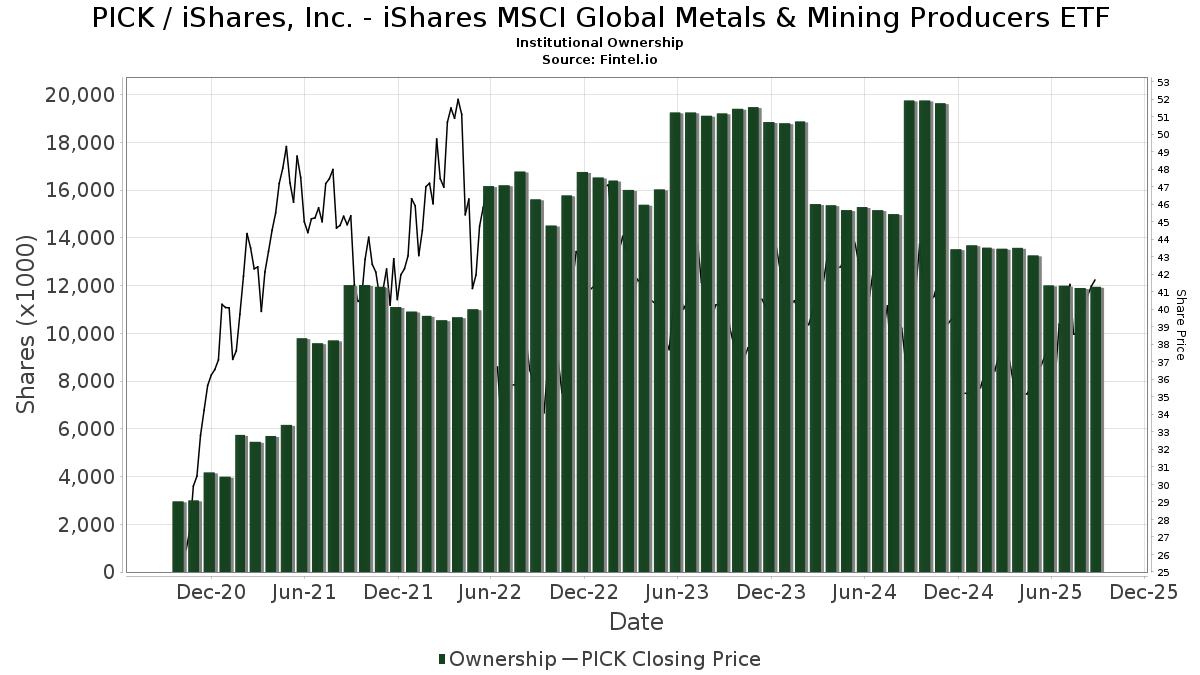
Institutional Ownership and Shareholders
iShares, Inc. - iShares MSCI Global Metals & Mining Producers ETF (US:PICK) has 151 institutional owners and shareholders that have filed 13D/G or 13F forms with the Securities Exchange Commission (SEC). These institutions hold a total of 11,944,231 shares. Largest shareholders include Fisher Asset Management, LLC, Municipal Employees' Retirement System of Michigan, Greenline Partners, LLC, Bank Of America Corp /de/, Raymond James Financial Inc, Morgan Stanley, RAA - SMI 3Fourteen Real Asset Allocation ETF SMI 3Fourteen REAL Asset Allocation ETF, Jane Street Group, Llc, Goldman Sachs Group Inc, and AMTAX - AB All Market Real Return Portfolio Class A .
iShares, Inc. - iShares MSCI Global Metals & Mining Producers ETF (BATS:PICK) institutional ownership structure shows current positions in the company by institutions and funds, as well as latest changes in position size. Major shareholders can include individual investors, mutual funds, hedge funds, or institutions. The Schedule 13D indicates that the investor holds (or held) more than 5% of the company and intends (or intended) to actively pursue a change in business strategy. Schedule 13G indicates a passive investment of over 5%.
The share price as of September 5, 2025 is 41.81 / share. Previously, on September 6, 2024, the share price was 36.37 / share. This represents an increase of 14.96% over that period.
Fund Sentiment Score
The Fund Sentiment Score (fka Ownership Accumulation Score) finds the stocks that are being most bought by funds. It is the result of a sophisticated, multi-factor quantitative model that identifies companies with the highest levels of institutional accumulation. The scoring model uses a combination of the total increase in disclosed owners, the changes in portfolio allocations in those owners and other metrics. The number ranges from 0 to 100, with higher numbers indicating a higher level of accumulation to its peers, and 50 being the average.
Update Frequency: Daily
See Ownership Explorer, which provides a list of highest-ranking companies.
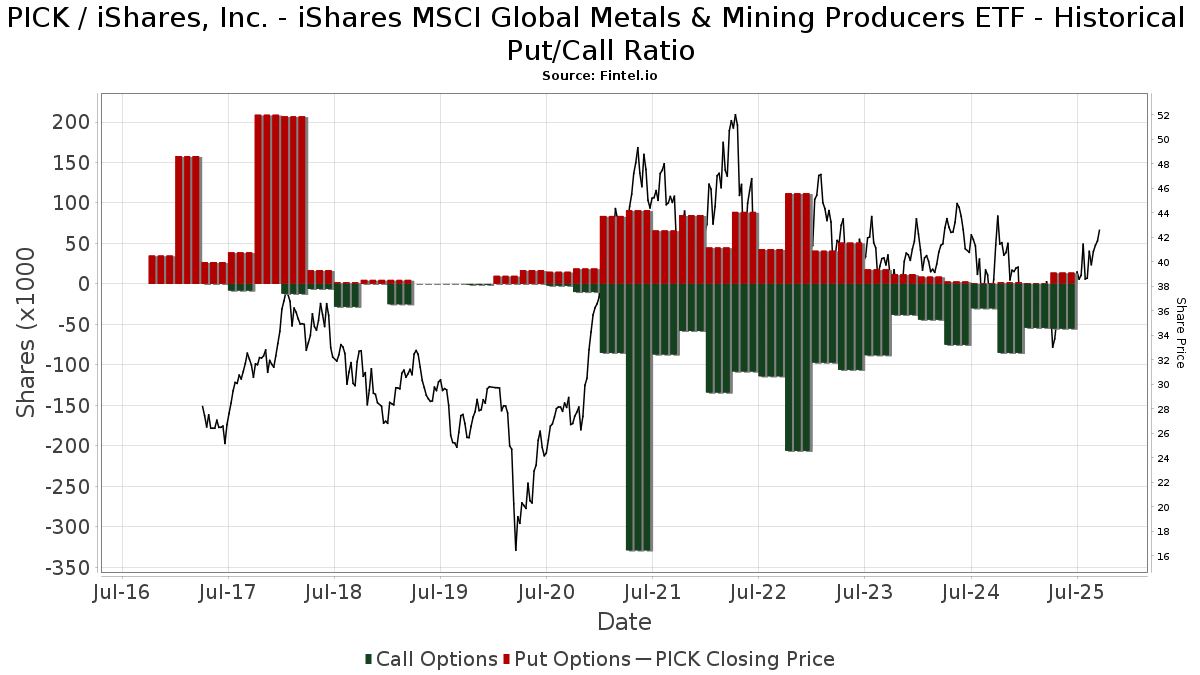
Institutional Put/Call Ratio
In addition to reporting standard equity and debt issues, institutions with more than 100MM assets under management must also disclose their put and call option holdings. Since put options generally indicate negative sentiment, and call options indicate positive sentiment, we can get a sense of the overall institutional sentiment by plotting the ratio of puts to calls. The chart to the right plots the historical put/call ratio for this instrument.
Using Put/Call Ratio as an indicator of investor sentiment overcomes one of the key deficiencies of using total institutional ownership, which is that a significant amount of assets under management are invested passively to track indices. Passively-managed funds do not typically buy options, so the put/call ratio indicator more closely tracks the sentiment of actively-managed funds.
13F and NPORT Filings
Detail on 13F filings are free. Detail on NP filings require a premium membership. Green rows indicate new positions. Red rows indicate closed positions. Click the link icon to see the full transaction history.
Upgrade
to unlock premium data and export to Excel ![]() .
.
| File Date | Source | Investor | Type | Avg Price (Est) |
Shares | Δ Shares (%) |
Reported Value ($1000) |
Δ Value (%) |
Port Alloc (%) |
|
|---|---|---|---|---|---|---|---|---|---|---|
| 2025-08-14 | 13F | Principia Wealth Advisory, LLC | 3,280 | 123 | ||||||
| 2025-08-08 | 13F | Emerald Investment Partners, Llc | 129 | 5 | ||||||
| 2025-08-06 | 13F | Rialto Wealth Management, LLC | 669 | 0.00 | 25 | 4.17 | ||||
| 2025-08-12 | 13F | MAI Capital Management | 313 | 0.00 | 12 | 0.00 | ||||
| 2025-08-13 | 13F | Tls Advisors Llc | 100,994 | -49.38 | 4 | -57.14 | ||||
| 2025-07-21 | 13F | Synergy Financial Management, LLC | 5,549 | 209 | ||||||
| 2025-08-14 | 13F | CoreCap Advisors, LLC | 55,455 | -34.53 | 2,085 | -31.39 | ||||
| 2025-07-14 | 13F | U.S. Capital Wealth Advisors, LLC | 27,936 | -12.59 | 1,050 | -8.38 | ||||
| 2025-08-14 | 13F | Financial Advisory Service, Inc. | 1,649 | 1.41 | 62 | 5.17 | ||||
| 2025-08-13 | 13F | Northwestern Mutual Wealth Management Co | 2,560 | -73.85 | 96 | -72.65 | ||||
| 2025-07-15 | 13F | Fifth Third Bancorp | 250 | 0.00 | 9 | 12.50 | ||||
| 2025-07-14 | 13F | Opal Wealth Advisors, LLC | 841 | 32 | ||||||
| 2025-07-28 | 13F | Axxcess Wealth Management, Llc | 5,328 | 200 | ||||||
| 2025-08-11 | 13F | Strategic Wealth Partners, Ltd. | 360 | 14 | ||||||
| 2025-08-14 | 13F | Fmr Llc | 623 | -46.57 | 23 | -43.90 | ||||
| 2025-05-14 | 13F | Lionshead Wealth Management, LLC | 0 | -100.00 | 0 | |||||
| 2025-04-28 | 13F | Pinnacle Financial Partners Inc | 2,571 | 0.00 | 90 | -19.82 | ||||
| 2025-07-18 | 13F | Union Bancaire Privee, UBP SA | 5,347 | 0.00 | 202 | 4.12 | ||||
| 2025-07-24 | 13F | Ronald Blue Trust, Inc. | 195 | 0.00 | 7 | 16.67 | ||||
| 2025-07-08 | 13F | Parallel Advisors, LLC | 351 | 0.00 | 13 | 8.33 | ||||
| 2025-08-14 | 13F | State Street Corp | 5,600 | -37.78 | 211 | -34.78 | ||||
| 2025-08-13 | 13F | Fort Sheridan Advisors Llc | 9,408 | -2.43 | 354 | 2.32 | ||||
| 2025-08-14 | 13F | Synovus Financial Corp | 65,658 | 0.00 | 2,469 | 4.80 | ||||
| 2025-07-31 | 13F | Wealthfront Advisers Llc | 43,404 | 5.68 | 1,632 | 10.73 | ||||
| 2025-08-08 | 13F | Pnc Financial Services Group, Inc. | 3,006 | 0.00 | 113 | 5.61 | ||||
| 2025-08-14 | 13F | Toroso Investments, LLC | 116,268 | -41.41 | 4,372 | -38.61 | ||||
| 2025-08-14 | 13F | Stamos Capital Partners, L.p. | 41,223 | 50.42 | 1,550 | 57.58 | ||||
| 2025-07-08 | 13F | Webster Bank, N. A. | 318 | 0.00 | 12 | 0.00 | ||||
| 2025-08-12 | 13F | LPL Financial LLC | 92,203 | -0.08 | 3,467 | 4.71 | ||||
| 2025-08-13 | 13F | Quadrature Capital Ltd | 0 | -100.00 | 0 | |||||
| 2025-08-14 | 13F | GWM Advisors LLC | 433 | 0.93 | 16 | 6.67 | ||||
| 2025-08-08 | 13F | Hartland & Co., LLC | 0 | -100.00 | 0 | |||||
| 2025-08-11 | 13F | HighTower Advisors, LLC | 31,940 | 29.43 | 1,201 | 35.59 | ||||
| 2025-08-11 | 13F | Aptus Capital Advisors, LLC | 357 | 37.31 | 13 | 44.44 | ||||
| 2025-08-12 | 13F | TCTC Holdings, LLC | 2,825 | 0.00 | 106 | 4.95 | ||||
| 2025-07-23 | 13F | Meitav Dash Investments Ltd | 7,692 | 0.00 | 289 | 5.09 | ||||
| 2025-08-12 | 13F | Choate Investment Advisors | 2,378 | 89 | ||||||
| 2025-08-11 | 13F | Rothschild Investment Llc | 0 | -100.00 | 0 | |||||
| 2025-07-03 | 13F | JBGlobal.com LLC | 0 | -100.00 | 0 | |||||
| 2025-07-25 | 13F | Retirement Planning Group, Llc / Ny | 15,690 | -8.09 | 590 | -3.76 | ||||
| 2025-08-14 | 13F | Hrt Financial Lp | 6,763 | 0 | ||||||
| 2025-05-05 | 13F | Lindbrook Capital, Llc | 0 | -100.00 | 0 | |||||
| 2025-05-16 | 13F/A | Kestra Investment Management, LLC | 0 | -100.00 | 0 | |||||
| 2025-07-22 | 13F | Valley National Advisers Inc | 155 | -52.74 | 0 | |||||
| 2025-04-22 | 13F | Verde Servicos Internacionais S.A. | 0 | -100.00 | 0 | |||||
| 2025-08-12 | 13F | Founders Financial Alliance, LLC | 50 | -16.67 | 2 | -50.00 | ||||
| 2025-07-25 | 13F | Northwest Capital Management Inc | 459 | 0.00 | 17 | 6.25 | ||||
| 2025-08-12 | 13F | O'shaughnessy Asset Management, Llc | 1 | -96.97 | 0 | -100.00 | ||||
| 2025-08-14 | 13F | D. E. Shaw & Co., Inc. | 9,766 | -29.53 | 367 | -26.16 | ||||
| 2025-07-14 | 13F | Abound Wealth Management | 1,152 | 1.95 | 43 | 7.50 | ||||
| 2025-08-14 | 13F | Raymond James Financial Inc | 283,792 | 2.54 | 10,671 | 7.45 | ||||
| 2025-08-12 | 13F | Steward Partners Investment Advisory, Llc | 5,943 | 0.85 | 223 | 5.69 | ||||
| 2025-07-25 | 13F | Stonehage Fleming Financial Services Holdings Ltd | 0 | -100.00 | 0 | |||||
| 2025-08-11 | 13F | Nomura Asset Management Co Ltd | 15,523 | 0.00 | 584 | 4.86 | ||||
| 2025-08-13 | 13F | Baird Financial Group, Inc. | 12,738 | -47.62 | 479 | -45.18 | ||||
| 2025-03-24 | 13F/A | Wellington Management Group Llp | 0 | -100.00 | 0 | |||||
| 2025-08-12 | 13F | Pathstone Holdings, LLC | 12,295 | 0.00 | 462 | 4.76 | ||||
| 2025-07-14 | 13F | Clear Harbor Asset Management, LLC | 51,348 | 0.65 | 1,931 | 5.46 | ||||
| 2025-07-17 | 13F | Elwood & Goetz Wealth Advisory Group, LLC | 17,496 | 13.89 | 658 | 19.24 | ||||
| 2025-08-14 | 13F | Ameriprise Financial Inc | 87,253 | 3.86 | 3,281 | 8.83 | ||||
| 2025-07-21 | 13F | Ameritas Advisory Services, LLC | 371 | 14 | ||||||
| 2025-08-04 | 13F | Mesirow Financial Investment Management, Inc. | 40,538 | -51.46 | 1,524 | -49.13 | ||||
| 2025-08-07 | 13F | Resolute Advisors LLC | 7,836 | 12.15 | 295 | 17.60 | ||||
| 2025-07-24 | 13F | Us Bancorp \de\ | 11,109 | 7,835.00 | 418 | 8,240.00 | ||||
| 2025-08-14 | 13F | Bnp Paribas Arbitrage, Sa | 17,979 | -28.34 | 676 | -24.89 | ||||
| 2025-07-31 | 13F | Cambridge Investment Research Advisors, Inc. | 14,112 | -69.09 | 1 | -100.00 | ||||
| 2025-05-12 | 13F | Hirtle Callaghan & Co LLC | 0 | -100.00 | 0 | |||||
| 2025-08-08 | 13F | IMA Wealth, Inc. | 13 | 0.00 | 0 | |||||
| 2025-08-08 | 13F | Cetera Investment Advisers | 14,990 | -34.41 | 564 | -31.26 | ||||
| 2025-08-14 | 13F | Susquehanna International Group, Llp | 86,428 | 3,250 | ||||||
| 2025-08-08 | 13F | Gts Securities Llc | 146,052 | 5,492 | ||||||
| 2025-07-29 | 13F | Angeles Wealth Management, Llc | 0 | -100.00 | 0 | |||||
| 2025-08-14 | 13F | Susquehanna International Group, Llp | Call | 6,400 | -49.21 | 241 | -46.90 | |||
| 2025-05-15 | 13F | Two Sigma Securities, Llc | 0 | -100.00 | 0 | |||||
| 2025-08-07 | 13F | Nwam Llc | 0 | -100.00 | 0 | |||||
| 2025-08-14 | 13F | Federation des caisses Desjardins du Quebec | 503 | -34.08 | 19 | -33.33 | ||||
| 2025-07-15 | 13F | Colonial River Wealth Management, LLC | 5,328 | 210 | ||||||
| 2025-08-12 | 13F | Jpmorgan Chase & Co | 6,535 | -3.36 | 246 | 1.24 | ||||
| 2025-08-15 | 13F | CI Private Wealth, LLC | 44,315 | -49.69 | 1,666 | -47.28 | ||||
| 2025-09-04 | 13F/A | Advisor Group Holdings, Inc. | 22,345 | -4.21 | 841 | 0.36 | ||||
| 2025-07-28 | 13F | Harbour Investments, Inc. | 223 | -23.10 | 8 | -20.00 | ||||
| 2025-08-12 | 13F | CIBC Private Wealth Group, LLC | 1,700 | -59.85 | 64 | -50.78 | ||||
| 2025-08-13 | 13F | Northern Trust Corp | 17,285 | 0.00 | 650 | 4.68 | ||||
| 2025-07-18 | 13F | PFG Investments, LLC | 7,034 | 1.34 | 264 | 6.02 | ||||
| 2025-07-31 | 13F | City State Bank | 800 | 0.00 | 30 | 7.14 | ||||
| 2025-08-14 | 13F | Stifel Financial Corp | 25,620 | -16.56 | 963 | -12.53 | ||||
| 2025-08-14 | 13F | Comerica Bank | 1,655 | -28.20 | 62 | -24.39 | ||||
| 2025-08-11 | 13F | Heritage Wealth Advisors | 11,700 | 0.00 | 440 | 4.77 | ||||
| 2025-08-04 | 13F | Savvy Advisors, Inc. | 32,105 | -2.45 | 1,207 | 2.29 | ||||
| 2025-05-08 | 13F | Strategic Advocates LLC | 0 | -100.00 | 0 | |||||
| 2025-08-14 | 13F | Old Mission Capital Llc | 31,093 | -22.64 | 1,169 | -18.93 | ||||
| 2025-07-28 | 13F | BRYN MAWR TRUST Co | 0 | -100.00 | 0 | |||||
| 2025-08-13 | 13F | Continuum Advisory, LLC | 0 | -100.00 | 0 | |||||
| 2025-07-17 | 13F | BFI Infinity Ltd. | 10,342 | 0.00 | 389 | 4.58 | ||||
| 2025-08-14 | 13F | Bank Of America Corp /de/ | 544,102 | 83.58 | 20,458 | 92.38 | ||||
| 2025-05-12 | 13F | Townsquare Capital Llc | 0 | -100.00 | 0 | |||||
| 2025-08-12 | 13F | Insigneo Advisory Services, Llc | 6,840 | 0.59 | 257 | 5.76 | ||||
| 2025-08-13 | 13F | ASB Consultores, LLC | 0 | -100.00 | 0 | |||||
| 2025-08-13 | 13F | Fisher Asset Management, LLC | 3,332,961 | -4.75 | 125,319 | -0.19 | ||||
| 2025-07-25 | 13F | Cwm, Llc | 1,310 | 7.73 | 0 | |||||
| 2025-08-14 | 13F | Citadel Advisors Llc | Call | 41,100 | 183.45 | 1,545 | 197.12 | |||
| 2025-08-14 | 13F | Citadel Advisors Llc | 102,815 | 534.00 | 3,866 | 565.23 | ||||
| 2025-08-14 | 13F | Citadel Advisors Llc | Put | 14,700 | 673.68 | 553 | 711.76 | |||
| 2025-08-01 | 13F | Envestnet Asset Management Inc | 36,684 | 5.28 | 1,379 | 10.32 | ||||
| 2025-08-13 | 13F | Scotia Capital Inc. | 26,921 | -38.87 | 1,012 | -35.95 | ||||
| 2025-07-16 | 13F | ORG Wealth Partners, LLC | 49 | 0.00 | 2 | 0.00 | ||||
| 2025-05-14 | 13F | Barometer Capital Management Inc. | 0 | -100.00 | 0 | |||||
| 2025-07-08 | 13F | Arlington Trust Co LLC | 1,500 | 0.00 | 56 | 5.66 | ||||
| 2025-08-06 | 13F | Black Swift Group, LLC | 8,800 | 0.00 | 331 | 4.76 | ||||
| 2025-05-07 | 13F | Phoenix Holdings Ltd. | 0 | -100.00 | 0 | -100.00 | ||||
| 2025-07-29 | 13F | Stratos Wealth Advisors, LLC | 58,627 | -61.85 | 2,204 | -60.02 | ||||
| 2025-07-25 | 13F | Almanack Investment Partners, LLC. | 144,807 | 8.54 | 5,445 | 13.72 | ||||
| 2025-05-12 | 13F | Simplex Trading, Llc | 0 | -100.00 | 0 | |||||
| 2025-08-29 | NP | GDMA - Gadsden Dynamic Multi-Asset ETF | 98,312 | -21.10 | 3,697 | -17.32 | ||||
| 2025-04-28 | 13F | Clarity Capital Partners LLC | 0 | -100.00 | 0 | |||||
| 2025-08-14 | 13F | Wealth Preservation Advisors, LLC | 53 | 0.00 | 2 | 0.00 | ||||
| 2025-07-31 | 13F | Allied Investment Advisors, LLC | 67,916 | 109.44 | 2,554 | 119.52 | ||||
| 2025-08-08 | 13F | Avantax Advisory Services, Inc. | 19,270 | 47.23 | 725 | 54.37 | ||||
| 2025-05-07 | 13F | Second Half Financial Partners, LLC | 0 | -100.00 | 0 | |||||
| 2025-08-14 | 13F | UBS Group AG | 84,144 | 6.22 | 3,164 | 11.29 | ||||
| 2025-07-17 | 13F | Barry Investment Advisors, LLC | 96,317 | -2.36 | 3,622 | 2.32 | ||||
| 2025-08-01 | 13F | Motco | 200 | 8 | ||||||
| 2025-08-11 | 13F | Empowered Funds, LLC | 98,579 | -20.88 | 3,707 | -17.09 | ||||
| 2025-08-11 | 13F | Principal Securities, Inc. | 803 | -8.12 | 30 | 0.00 | ||||
| 2025-07-25 | 13F | Endowment Wealth Management, Inc. | 11,408 | -0.91 | 429 | 3.63 | ||||
| 2025-07-28 | 13F | Kiker Wealth Management, LLC | 851 | 32 | ||||||
| 2025-08-11 | 13F | Citigroup Inc | 1 | 0.00 | 0 | |||||
| 2025-08-14 | 13F | Daiwa Securities Group Inc. | 20,100 | 0.00 | 1 | |||||
| 2025-08-04 | 13F | Municipal Employees' Retirement System of Michigan | 3,032,992 | 0.00 | 114 | 5.56 | ||||
| 2025-08-13 | 13F | Schroder Investment Management Group | 0 | -100.00 | 0 | |||||
| 2025-07-11 | 13F | Farther Finance Advisors, LLC | 98 | 0.00 | 4 | 0.00 | ||||
| 2025-08-12 | 13F | Trans-Canada Capital Inc. | 90,250 | 0.00 | 3,393 | 4.79 | ||||
| 2025-07-24 | 13F | IFP Advisors, Inc | 600 | 0.00 | 23 | 4.76 | ||||
| 2025-07-07 | 13F | Thurston, Springer, Miller, Herd & Titak, Inc. | 210 | 0.00 | 8 | 0.00 | ||||
| 2025-08-06 | 13F | AE Wealth Management LLC | 1,957 | 6.30 | 74 | 10.61 | ||||
| 2025-08-08 | 13F | Family Firm, Inc. | 37,064 | 7.62 | 1,394 | 12.79 | ||||
| 2025-08-12 | 13F | Howe & Rusling Inc | 106 | 0.00 | 4 | 0.00 | ||||
| 2025-07-18 | 13F | Parsons Capital Management Inc/ri | 7,840 | 0.00 | 295 | 4.63 | ||||
| 2025-07-14 | 13F | Sowell Financial Services LLC | 10,811 | 0.68 | 406 | 5.45 | ||||
| 2025-07-17 | 13F | Smith Anglin Financial, LLC | 0 | -100.00 | 0 | |||||
| 2025-08-14 | 13F | CIBC World Markets Inc. | 33,827 | 248.80 | 1,272 | 266.28 | ||||
| 2025-08-06 | 13F | Commonwealth Equity Services, Llc | 21,851 | -21.84 | 1 | -100.00 | ||||
| 2025-08-14 | 13F | Goldman Sachs Group Inc | 218,703 | -19.78 | 8,223 | -15.94 | ||||
| 2025-08-15 | 13F | Tower Research Capital LLC (TRC) | 149 | 413.79 | 6 | 400.00 | ||||
| 2025-03-27 | NP | AMTAX - AB All Market Real Return Portfolio Class A | 168,830 | 0.00 | 5,988 | -11.63 | ||||
| 2025-05-07 | 13F | Evermay Wealth Management Llc | 0 | -100.00 | 0 | -100.00 | ||||
| 2025-07-10 | 13F | Wealth Enhancement Advisory Services, Llc | 7,428 | -22.59 | 291 | -15.70 | ||||
| 2025-08-14 | 13F | Jane Street Group, Llc | Call | 0 | -100.00 | 0 | ||||
| 2025-07-31 | 13F | Oppenheimer & Co Inc | 17,393 | 654 | ||||||
| 2025-08-11 | 13F | Bedell Frazier Investment Counseling, LLC | 76,157 | 2,864 | ||||||
| 2025-08-18 | 13F/A | National Bank Of Canada /fi/ | 950 | -3.26 | 36 | 0.00 | ||||
| 2025-08-06 | 13F | Prospera Financial Services Inc | 0 | -100.00 | 0 | |||||
| 2025-04-30 | 13F | Banque Pictet & Cie Sa | 0 | -100.00 | 0 | |||||
| 2025-07-08 | 13F | Nbc Securities, Inc. | 0 | -100.00 | 0 | |||||
| 2025-07-23 | 13F | Vontobel Holding Ltd. | 30,750 | 0.00 | 1,156 | 4.81 | ||||
| 2025-08-11 | 13F | CBIZ Investment Advisory Services, LLC | 246 | 1.65 | 9 | 12.50 | ||||
| 2025-08-13 | 13F | Greenwich Wealth Management LLC | 17,219 | -0.43 | 1 | |||||
| 2025-04-10 | 13F | SMI Advisory Services, LLC | 0 | -100.00 | 0 | |||||
| 2025-07-17 | 13F | Vermillion Wealth Management, Inc. | 15,770 | 13.10 | 593 | 18.40 | ||||
| 2025-07-09 | 13F | Breakwater Capital Group | 0 | -100.00 | 0 | |||||
| 2025-08-14 | 13F | Glenmede Investment Management, LP | 2,524 | 95 | ||||||
| 2025-08-14 | 13F | Mml Investors Services, Llc | 8,355 | 2.72 | 0 | |||||
| 2025-04-29 | 13F | Capital Investment Advisory Services, LLC | 0 | -100.00 | 0 | |||||
| 2025-08-13 | 13F | Argyle Capital Partners, LLC | 9,838 | 13.30 | 370 | 18.65 | ||||
| 2025-08-13 | 13F | Ted Buchan & Co | 6,680 | -13.58 | 251 | -9.39 | ||||
| 2025-08-14 | 13F/A | Rockefeller Capital Management L.P. | 30,257 | -29.97 | 1,138 | -26.65 | ||||
| 2025-07-16 | 13F | Essex Financial Services, Inc. | 10,455 | -75.38 | 393 | -74.20 | ||||
| 2025-08-14 | 13F | Royal Bank Of Canada | 125,471 | 1,088.51 | 4,718 | 1,144.85 | ||||
| 2025-08-13 | 13F | Transce3nd, LLC | 23 | 360.00 | 1 | |||||
| 2025-05-14 | 13F | Renaissance Technologies Llc | 0 | -100.00 | 0 | |||||
| 2025-07-18 | 13F | Truist Financial Corp | 19,460 | 4.53 | 732 | 9.60 | ||||
| 2025-08-12 | 13F | Running Point Capital Advisors, LLC | 0 | -100.00 | 0 | |||||
| 2025-08-12 | 13F | Proequities, Inc. | 0 | 0 | ||||||
| 2025-08-05 | 13F | Bank Of Montreal /can/ | 11,645 | 2.79 | 438 | 7.64 | ||||
| 2025-05-15 | 13F | Alliancebernstein L.p. | 0 | -100.00 | 0 | -100.00 | ||||
| 2025-07-24 | 13F | Comprehensive Money Management Services LLC | 21,902 | -4.04 | 824 | 0.61 | ||||
| 2025-06-30 | NP | SMILX - SMI 50/40/10 Fund | 2,890 | -55.74 | 102 | -61.45 | ||||
| 2025-07-24 | 13F | Stonebridge Financial Group, LLC | 0 | -100.00 | 0 | |||||
| 2025-08-29 | NP | RAA - SMI 3Fourteen Real Asset Allocation ETF SMI 3Fourteen REAL Asset Allocation ETF | 263,601 | 22.94 | 9,911 | 28.85 | ||||
| 2025-05-15 | 13F | Glenmede Trust Co Na | 1,129 | 0.00 | 41 | 2.56 | ||||
| 2025-08-08 | 13F | Creative Planning | 15,263 | 10.49 | 574 | 15.76 | ||||
| 2025-08-13 | 13F | Jones Financial Companies Lllp | 4,089 | -9.33 | 155 | -6.10 | ||||
| 2025-08-18 | 13F | Wolverine Trading, Llc | Call | 8,200 | 310 | |||||
| 2025-08-14 | 13F | Jane Street Group, Llc | 262,488 | 73.40 | 9,870 | 81.72 | ||||
| 2025-07-21 | 13F | J. Safra Sarasin Holding AG | 6,000 | 0.00 | 226 | 4.65 | ||||
| 2025-04-28 | 13F | Fedenia Advisers LLC | 0 | -100.00 | 0 | |||||
| 2025-08-14 | 13F | Wells Fargo & Company/mn | 22,951 | -44.23 | 863 | -41.60 | ||||
| 2025-06-30 | NP | SMIDX - SMI Dynamic Allocation Fund | 7,690 | -25.27 | 270 | -25.82 | ||||
| 2025-08-07 | 13F | Allworth Financial LP | 97 | -70.78 | 4 | -72.73 | ||||
| 2025-07-30 | 13F | Whittier Trust Co Of Nevada Inc | 110 | 0.00 | 4 | 33.33 | ||||
| 2025-05-12 | 13F | Kohmann Bosshard Financial Services, LLC | 0 | -100.00 | 0 | |||||
| 2025-08-14 | 13F | Erste Asset Management GmbH | 2,000 | 0.00 | 75 | 5.63 | ||||
| 2025-07-16 | 13F | Strategic Investment Solutions, Inc. /IL | 0 | -100.00 | 0 | |||||
| 2025-05-09 | 13F/A | Oversea-Chinese Banking CORP Ltd | 0 | -100.00 | 0 | -100.00 | ||||
| 2025-08-14 | 13F | Greenline Partners, LLC | 555,538 | 147.29 | 20,888 | 159.16 | ||||
| 2025-08-11 | 13F | TD Waterhouse Canada Inc. | 629 | -8.31 | 24 | -4.17 | ||||
| 2025-08-15 | 13F | Morgan Stanley | 283,027 | -1.81 | 10,642 | 2.89 |