Basic Stats
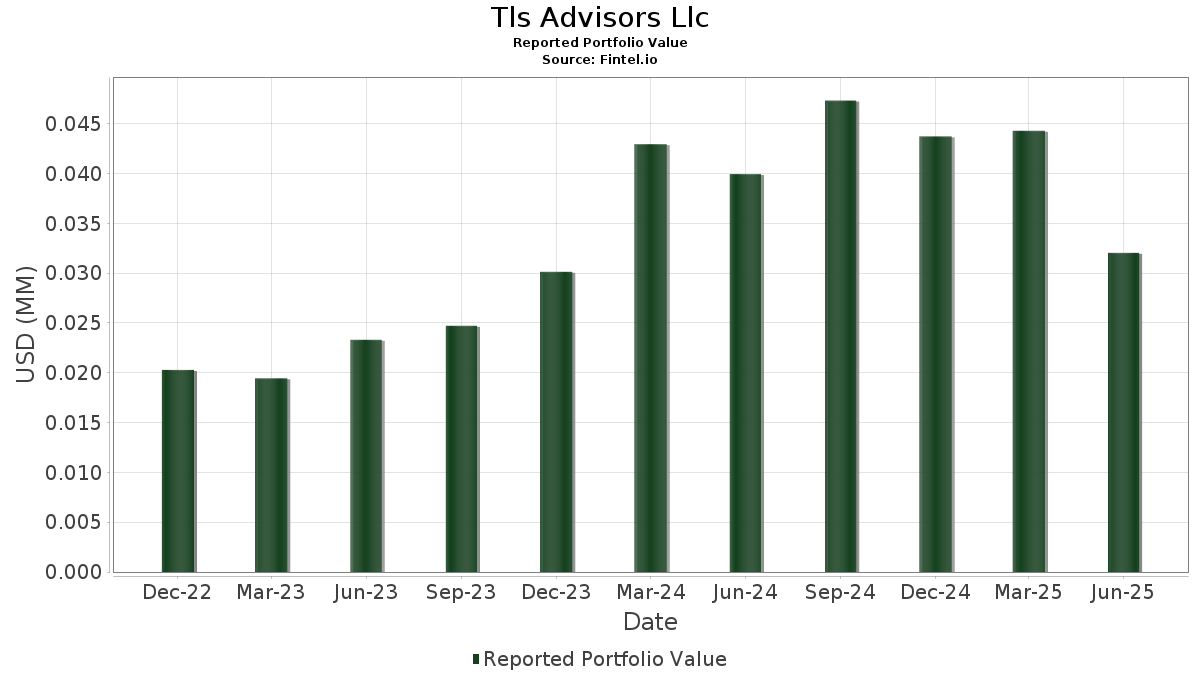
| Portfolio Value | $ 32,041 |
| Current Positions | 13 |
Latest Holdings, Performance, AUM (from 13F, 13D)
Tls Advisors Llc has disclosed 13 total holdings in their latest SEC filings. Most recent portfolio value is calculated to be $ 32,041 USD. Actual Assets Under Management (AUM) is this value plus cash (which is not disclosed). Tls Advisors Llc’s top holdings are EQT Corporation (US:EQT) , Meta Platforms, Inc. (US:META) , Rio Tinto Group - Depositary Receipt (Common Stock) (US:RIO) , iShares, Inc. - iShares MSCI Global Metals & Mining Producers ETF (US:PICK) , and XOMA Royalty Corporation (US:XOMA) . Tls Advisors Llc’s new positions include Singularity Future Technology Ltd. (US:SGLY) , .
Top Increases This Quarter
We use the change in the portfolio allocation because this is the most meaningful metric. Changes can be due to trades or changes in share prices.
| Security | Shares (MM) |
Value (MM$) |
Portfolio % | ΔPortfolio % |
|---|---|---|---|---|
| 0.01 | 0.01 | 24.3937 | 10.6166 | |
| 0.14 | 0.01 | 24.7183 | 8.3384 | |
| 0.12 | 0.00 | 9.3630 | 4.0061 | |
| 0.05 | 0.00 | 6.0828 | 1.7621 | |
| 0.03 | 0.00 | 3.2209 | 0.7241 | |
| 0.01 | 0.00 | 1.1017 | 0.3726 | |
| 0.00 | 0.00 | 1.2640 | 0.3497 | |
| 0.68 | 0.00 | 0.7022 | 0.2214 | |
| 0.01 | 0.00 | 0.0437 | 0.0437 | |
| 0.25 | 0.00 | 1.3576 | 0.0032 |
Top Decreases This Quarter
We use the change in the portfolio allocation because this is the most meaningful metric. Changes can be due to trades or changes in share prices.
| Security | Shares (MM) |
Value (MM$) |
Portfolio % | ΔPortfolio % |
|---|---|---|---|---|
| 0.10 | 0.00 | 2.9181 | -10.4640 | |
| 0.10 | 0.00 | 11.8504 | -4.3083 | |
| 0.07 | 0.00 | 12.9834 | -3.0332 |
13F and Fund Filings
This form was filed on 2025-08-13 for the reporting period 2025-06-30. Click the link icon to see the full transaction history.
Upgrade to unlock premium data and export to Excel ![]() .
.
| Security | Type | Avg Share Price | Shares (MM) |
ΔShares (%) |
ΔShares (%) |
Value ($MM) |
Portfolio (%) |
ΔPortfolio (%) |
|
|---|---|---|---|---|---|---|---|---|---|
| EQT / EQT Corporation | 0.14 | 0.00 | 0.01 | 0.00 | 24.7183 | 8.3384 | |||
| META / Meta Platforms, Inc. | 0.01 | 0.00 | 0.01 | 16.67 | 24.3937 | 10.6166 | |||
| RIO / Rio Tinto Group - Depositary Receipt (Common Stock) | 0.07 | -39.61 | 0.00 | -42.86 | 12.9834 | -3.0332 | |||
| PICK / iShares, Inc. - iShares MSCI Global Metals & Mining Producers ETF | 0.10 | -49.38 | 0.00 | -57.14 | 11.8504 | -4.3083 | |||
| XOMA / XOMA Royalty Corporation | 0.12 | 0.00 | 0.00 | 50.00 | 9.3630 | 4.0061 | |||
| RRC / Range Resources Corporation | 0.05 | 0.00 | 0.00 | 0.00 | 6.0828 | 1.7621 | |||
| XENE / Xenon Pharmaceuticals Inc. | 0.03 | 0.00 | 0.00 | 0.00 | 3.2209 | 0.7241 | |||
| VALE / Vale S.A. - Depositary Receipt (Common Stock) | 0.10 | -83.78 | 0.00 | -100.00 | 2.9181 | -10.4640 | |||
| OABI / OmniAb, Inc. | 0.25 | 0.00 | 0.00 | 1.3576 | 0.0032 | ||||
| HOV / Hovnanian Enterprises, Inc. | 0.00 | 0.00 | 0.00 | 1.2640 | 0.3497 | ||||
| EWS / iShares, Inc. - iShares MSCI Singapore ETF | 0.01 | 0.00 | 0.00 | 1.1017 | 0.3726 | ||||
| OVID / Ovid Therapeutics Inc. | 0.68 | 0.00 | 0.00 | 0.7022 | 0.2214 | ||||
| SGLY / Singularity Future Technology Ltd. | 0.01 | 0.00 | 0.0437 | 0.0437 | |||||
| WY / Weyerhaeuser Company | 0.00 | -100.00 | 0.00 | 0.0000 | |||||
| BHP / BHP Group Limited - Depositary Receipt (Common Stock) | 0.00 | -100.00 | 0.00 | 0.0000 | |||||
| VAL / Valaris Limited | 0.00 | -100.00 | 0.00 | 0.0000 |