Basic Stats
| Institutional Owners | 455 total, 455 long only, 0 short only, 0 long/short - change of -0.22% MRQ |
| Average Portfolio Allocation | 0.6242 % - change of -7.86% MRQ |
| Institutional Shares (Long) | 64,965,557 (ex 13D/G) - change of -1.03MM shares -1.56% MRQ |
| Institutional Value (Long) | $ 3,119,310 USD ($1000) |
Institutional Ownership and Shareholders
iShares U.S. ETF Trust - iShares Ultra Short Duration Bond Active ETF (US:ICSH) has 455 institutional owners and shareholders that have filed 13D/G or 13F forms with the Securities Exchange Commission (SEC). These institutions hold a total of 64,965,557 shares. Largest shareholders include Fmr Llc, Bank Of America Corp /de/, UBS Group AG, FAUDX - Strategic Advisers Short Duration Fund, Wealth Enhancement Advisory Services, Llc, LPL Financial LLC, Foster Dykema Cabot & Partners, Llc, Donaldson Capital Management, Llc, Royal Bank Of Canada, and Colony Group, LLC .
iShares U.S. ETF Trust - iShares Ultra Short Duration Bond Active ETF (BATS:ICSH) institutional ownership structure shows current positions in the company by institutions and funds, as well as latest changes in position size. Major shareholders can include individual investors, mutual funds, hedge funds, or institutions. The Schedule 13D indicates that the investor holds (or held) more than 5% of the company and intends (or intended) to actively pursue a change in business strategy. Schedule 13G indicates a passive investment of over 5%.
The share price as of September 8, 2025 is 50.64 / share. Previously, on September 9, 2024, the share price was 50.60 / share. This represents an increase of 0.08% over that period.

Fund Sentiment Score
The Fund Sentiment Score (fka Ownership Accumulation Score) finds the stocks that are being most bought by funds. It is the result of a sophisticated, multi-factor quantitative model that identifies companies with the highest levels of institutional accumulation. The scoring model uses a combination of the total increase in disclosed owners, the changes in portfolio allocations in those owners and other metrics. The number ranges from 0 to 100, with higher numbers indicating a higher level of accumulation to its peers, and 50 being the average.
Update Frequency: Daily
See Ownership Explorer, which provides a list of highest-ranking companies.
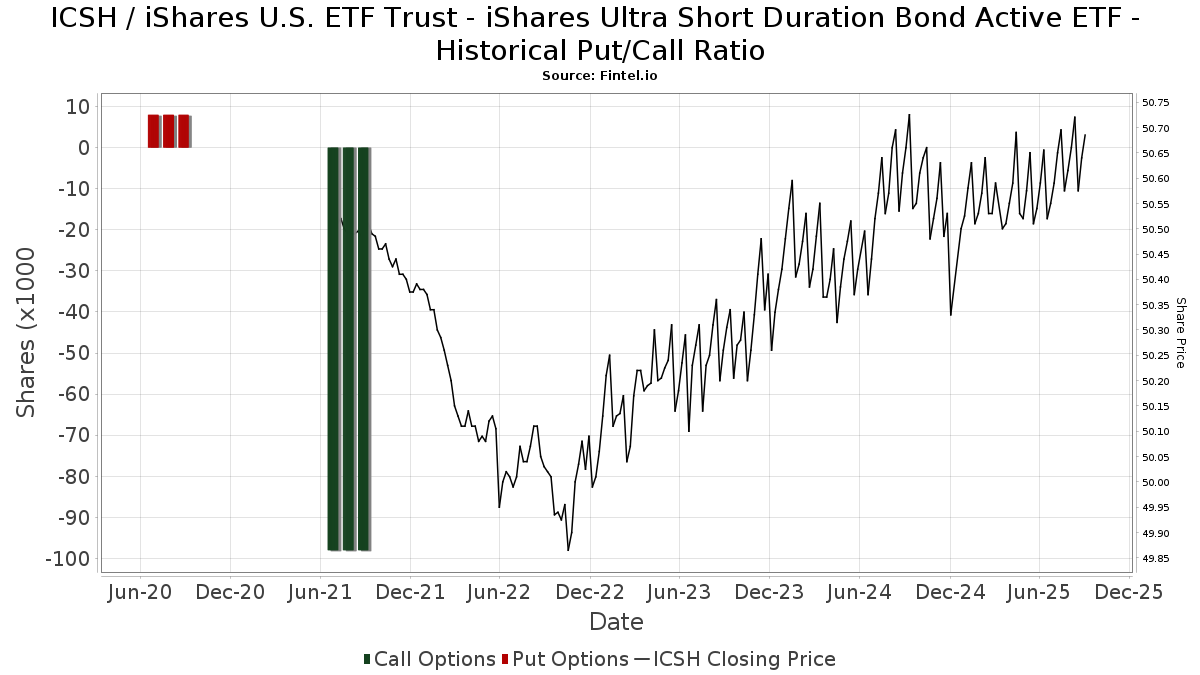
Institutional Put/Call Ratio
In addition to reporting standard equity and debt issues, institutions with more than 100MM assets under management must also disclose their put and call option holdings. Since put options generally indicate negative sentiment, and call options indicate positive sentiment, we can get a sense of the overall institutional sentiment by plotting the ratio of puts to calls. The chart to the right plots the historical put/call ratio for this instrument.
Using Put/Call Ratio as an indicator of investor sentiment overcomes one of the key deficiencies of using total institutional ownership, which is that a significant amount of assets under management are invested passively to track indices. Passively-managed funds do not typically buy options, so the put/call ratio indicator more closely tracks the sentiment of actively-managed funds.
13D/G Filings
We present 13D/G filings separately from the 13F filings because of the different treatement by the SEC. 13D/G filings can be filed by groups of investors (with one leading), whereas 13F filings cannot. This results in situations where an investor may file a 13D/G reporting one value for the total shares (representing all the shares owned by the investor group), but then file a 13F reporting a different value for the total shares (representing strictly their own ownership). This means that share ownership of 13D/G filings and 13F filings are oftentimes not directly comparable, so we present them separately.
Note: As of May 16, 2021, we no longer show owners that have not filed a 13D/G within the last year. Previously, we were showing the full history of 13D/G filings. In general, entities that are required to file 13D/G filings must file at least annually before submitting a closing filing. However, funds sometimes exit positions without submitting a closing filing (ie, they wind down), so displaying the full history sometimes resulted in confusion about the current ownership. To prevent confusion, we now only show ’current’ owners - that is - owners that have filed within the last year.
Upgrade to unlock premium data.
13F and NPORT Filings
Detail on 13F filings are free. Detail on NP filings require a premium membership. Green rows indicate new positions. Red rows indicate closed positions. Click the link icon to see the full transaction history.
Upgrade
to unlock premium data and export to Excel ![]() .
.
| File Date | Source | Investor | Type | Avg Price (Est) |
Shares | Δ Shares (%) |
Reported Value ($1000) |
Δ Value (%) |
Port Alloc (%) |
|
|---|---|---|---|---|---|---|---|---|---|---|
| 2025-08-08 | 13F | Kane Investment Management, Inc. | 38,833 | 665.18 | 1,969 | 666.15 | ||||
| 2025-05-12 | 13F | Independent Advisor Alliance | 0 | -100.00 | 0 | |||||
| 2025-07-25 | 13F | Alpha Financial Partners, LLC | 4,913 | -63.59 | 249 | -63.60 | ||||
| 2025-08-13 | 13F | Transce3nd, LLC | 321,100 | -3.45 | 16,283 | -3.43 | ||||
| 2025-08-07 | 13F | Donaldson Capital Management, Llc | 2,186,562 | -10.74 | 110,881 | -10.72 | ||||
| 2025-08-08 | 13F | Kingsview Wealth Management, LLC | 81,758 | 3.34 | 4,146 | 3.34 | ||||
| 2025-08-12 | 13F | Jaffetilchin Investment Partners, LLC | 17,734 | -1.19 | 899 | -1.10 | ||||
| 2025-04-28 | 13F | Pinnacle Financial Partners Inc | 165,722 | 1.41 | 8,402 | 1.95 | ||||
| 2025-07-08 | 13F | First International Bank & Trust | 111,382 | -10.91 | 5,648 | -10.89 | ||||
| 2025-08-14 | 13F | GWM Advisors LLC | 32,626 | 6.42 | 1,654 | 6.44 | ||||
| 2025-08-13 | 13F | EverSource Wealth Advisors, LLC | 2 | 0.00 | 0 | |||||
| 2025-08-11 | 13F | NewEdge Wealth, LLC | 18,862 | 27.17 | 954 | 26.90 | ||||
| 2025-08-13 | 13F | RFP Financial Group LLC | 84,807 | 5.18 | 4,301 | 5.21 | ||||
| 2025-08-14 | 13F | Synovus Financial Corp | 31,353 | -69.67 | 1,590 | -69.66 | ||||
| 2025-08-05 | 13F | BCGM Wealth Management, LLC | 28,684 | -3.92 | 1,455 | -3.90 | ||||
| 2025-08-04 | 13F | REDW Wealth LLC | 10,529 | 8.31 | 534 | 8.33 | ||||
| 2025-07-22 | 13F | Siligmueller & Norvid Wealth Advisors LLC | 3,966 | 0.00 | 201 | -0.50 | ||||
| 2025-07-29 | 13F | Flavin Financial Services, Inc. | 0 | -100.00 | 0 | |||||
| 2025-08-12 | 13F | BlackRock, Inc. | 1,051,596 | -20.65 | 53,326 | -20.63 | ||||
| 2025-08-14 | 13F | Vista Investment Management | 47,603 | 4.65 | 2,414 | 4.64 | ||||
| 2025-08-11 | 13F | Diversified Portfolios, Inc. | 1,103,609 | -2.36 | 55,964 | -2.34 | ||||
| 2025-08-15 | 13F | Kestra Advisory Services, LLC | 75,854 | 294.09 | 3,847 | 294.46 | ||||
| 2025-08-12 | 13F | Foster Dykema Cabot & Partners, Llc | 2,220,761 | -1.37 | 112,615 | -1.35 | ||||
| 2025-08-26 | 13F/A | Thrivent Financial For Lutherans | 0 | -100.00 | 0 | |||||
| 2025-08-06 | 13F | Summit Wealth Group, LLC | 127,579 | 13.78 | 6 | 20.00 | ||||
| 2025-07-22 | 13F | BridgePort Financial Solutions, LLC | 6,772 | 343 | ||||||
| 2025-05-01 | 13F | Prudent Man Advisors, LLC | 0 | -100.00 | 0 | -100.00 | ||||
| 2025-07-31 | 13F | Oppenheimer & Co Inc | 9,142 | 63.78 | 464 | 63.60 | ||||
| 2025-07-15 | 13F | Accurate Wealth Management, LLC | 6,353 | -1.82 | 321 | -1.53 | ||||
| 2025-07-14 | 13F | Sowell Financial Services LLC | 116,752 | 20.06 | 5,920 | 20.08 | ||||
| 2025-08-15 | 13F | Morgan Stanley | 57,409 | -2.77 | 2,911 | -2.74 | ||||
| 2025-07-09 | 13F | Sandy Cove Advisors, LLC | 15,983 | 16.33 | 810 | 16.38 | ||||
| 2025-07-14 | 13F | Seed Wealth Management, Inc. | 8,000 | -11.11 | 406 | -11.18 | ||||
| 2025-08-14 | 13F | Mml Investors Services, Llc | 503,179 | -13.05 | 26 | -13.79 | ||||
| 2025-05-13 | 13F | Watts Gwilliam & Co., LLC | 69,666 | 9.65 | 3,532 | 10.10 | ||||
| 2025-07-15 | 13F | Avaii Wealth Management, Llc | 11,715 | -10.48 | 594 | -10.41 | ||||
| 2025-08-01 | 13F | Rossby Financial, LCC | 628 | -22.47 | 32 | -24.39 | ||||
| 2025-08-14 | 13F | Wick Capital Partners, LLC | 6,427 | -65.33 | 897 | -4.58 | ||||
| 2025-08-20 | 13F/A | Coppell Advisory Solutions LLC | 13,571 | 688 | ||||||
| 2025-07-14 | 13F | Matrix Trust Co | 11,485 | 17.49 | 1 | |||||
| 2025-07-25 | 13F | Pandora Wealth, Inc. | 43 | 0.00 | 2 | 0.00 | ||||
| 2025-05-09 | 13F | Warberg Asset Management LLC | 0 | -100.00 | 0 | |||||
| 2025-08-01 | 13F | Zhang Financial LLC | 73,512 | 61.19 | 3,728 | 61.20 | ||||
| 2025-08-08 | 13F | Capstone Financial Advisors, Inc. | 10,967 | -4.66 | 556 | -4.63 | ||||
| 2025-08-13 | 13F | Crabel Capital Management, LLC | 4,087 | 207 | ||||||
| 2025-08-14 | 13F | Jane Street Group, Llc | 80,528 | -60.92 | 4,084 | -60.91 | ||||
| 2025-08-12 | 13F | Steward Partners Investment Advisory, Llc | 79,027 | 1.15 | 4,007 | 1.19 | ||||
| 2025-07-09 | 13F | Market Street Wealth Management Advisors Llc | 11,349 | 1.12 | 576 | 1.05 | ||||
| 2025-07-08 | 13F | Parallel Advisors, LLC | 225,920 | 28.53 | 11,456 | 28.56 | ||||
| 2025-07-30 | 13F | D.a. Davidson & Co. | 34,461 | -2.31 | 1,748 | -2.29 | ||||
| 2025-07-16 | 13F | Octavia Wealth Advisors, LLC | 9,633 | -28.44 | 488 | -28.45 | ||||
| 2025-07-25 | 13F | Wells Financial Advisors INC | 835 | -66.53 | 42 | -66.67 | ||||
| 2025-08-07 | 13F | WESCAP Management Group, Inc. | 15,670 | -2.47 | 795 | -2.46 | ||||
| 2025-07-11 | 13F | Eagle Bay Advisors LLC | 4,183 | -9.91 | 212 | -9.79 | ||||
| 2025-07-31 | 13F | Wealthfront Advisers Llc | 16,983 | 1.99 | 861 | 2.01 | ||||
| 2025-07-31 | 13F | Red Wave Investments LLC | 13,734 | -0.71 | 696 | -0.71 | ||||
| 2025-08-07 | 13F | Allworth Financial LP | 146,473 | -1.62 | 7,428 | -1.45 | ||||
| 2025-07-14 | 13F | UMA Financial Services, Inc. | 12,219 | -2.66 | 620 | -2.67 | ||||
| 2025-07-21 | 13F | Future Financial Wealth Managment LLC | 120 | 0.00 | 6 | 0.00 | ||||
| 2025-05-23 | NP | OHIO NATIONAL FUND INC - ON iShares Managed Risk Moderate Growth Portfolio | 12,730 | -16.23 | 645 | -15.80 | ||||
| 2025-07-31 | 13F | Leavell Investment Management, Inc. | 8,513 | -7.16 | 432 | -7.11 | ||||
| 2025-08-14 | 13F | EP Wealth Advisors, Inc. | 2,427 | 123 | ||||||
| 2025-07-29 | 13F | Mb, Levis & Associates, Llc | 2 | 0.00 | 0 | |||||
| 2025-05-15 | 13F/A | Orion Portfolio Solutions, LLC | 10,746 | 81.46 | 545 | 82.55 | ||||
| 2025-08-06 | 13F | Long Run Wealth Advisors, LLC | 26,331 | -3.89 | 1,335 | -3.82 | ||||
| 2025-07-30 | 13F | Greenup Street Wealth Management Llc | 28,807 | -16.41 | 1,461 | -16.43 | ||||
| 2025-08-19 | 13F | Advisory Services Network, LLC | 325,337 | -40.58 | 16,491 | -40.59 | ||||
| 2025-08-06 | 13F | Commonwealth Equity Services, Llc | 188,668 | -4.96 | 10 | -10.00 | ||||
| 2025-08-12 | 13F | Change Path, LLC | 168,396 | -8.26 | 8,539 | -8.24 | ||||
| 2025-08-14 | 13F | Integrated Wealth Concepts LLC | 14,802 | -0.61 | 751 | -0.66 | ||||
| 2025-07-14 | 13F | Gries Financial Llc | 23,027 | 0.00 | 1,168 | 0.00 | ||||
| 2025-07-22 | 13F | Knights of Columbus Asset Advisors LLC | 3,166 | 0.00 | 161 | 0.00 | ||||
| 2025-07-25 | 13F | Concurrent Investment Advisors, LLC | 43,535 | 46.21 | 2,208 | 46.26 | ||||
| 2025-08-13 | 13F | Everstar Asset Management, LLC | 7,575 | 0.00 | 384 | 0.00 | ||||
| 2025-05-15 | 13F | Eight 31 Financial Llc | 0 | -100.00 | 0 | -100.00 | ||||
| 2025-07-28 | 13F | Delap Wealth Advisory, Llc | 0 | -100.00 | 0 | |||||
| 2025-07-29 | 13F | Semitam Bonam Llc | 84,034 | 4,261 | ||||||
| 2025-08-08 | 13F | Emerald Investment Partners, Llc | 27,004 | -2.28 | 1,369 | -2.21 | ||||
| 2025-08-14 | 13F | Sand Hill Global Advisors, LLC | 995,869 | 157.23 | 50,501 | 157.29 | ||||
| 2025-08-11 | 13F | Hexagon Capital Partners LLC | 11,774 | -18.63 | 597 | -18.55 | ||||
| 2025-07-09 | 13F | Dynamic Advisor Solutions LLC | 99,128 | 1,235.96 | 5,027 | 1,236.70 | ||||
| 2025-08-11 | 13F | Perennial Investment Advisors, LLC | 5,468 | -8.87 | 277 | -8.88 | ||||
| 2025-07-11 | 13F | Pinnacle Bancorp, Inc. | 0 | -100.00 | 0 | |||||
| 2025-07-21 | 13F | Ameriflex Group, Inc. | 0 | -100.00 | 0 | |||||
| 2025-07-30 | 13F | White Lighthouse Investment Management Inc. | 7,000 | 0.00 | 355 | 0.00 | ||||
| 2025-08-06 | 13F | Valtinson Bruner Financial Planning LLC | 767,895 | 9.61 | 38,940 | 9.63 | ||||
| 2025-05-23 | NP | OHIO NATIONAL FUND INC - ON iShares Managed Risk Growth Portfolio | 107,668 | -46.59 | 5,458 | -46.32 | ||||
| 2025-08-07 | 13F | CENTRAL TRUST Co | 0 | -100.00 | 0 | |||||
| 2025-08-14 | 13F | Betterment LLC | 5,733 | -66.40 | 0 | |||||
| 2025-05-05 | 13F | Heritage Investors Management Corp | 0 | -100.00 | 0 | |||||
| 2025-08-07 | 13F | Guidance Capital, Inc | 177,556 | 1.35 | 8,976 | 1.47 | ||||
| 2025-08-07 | 13F | Vise Technologies, Inc. | 40,114 | 592.93 | 2,034 | 598.97 | ||||
| 2025-04-22 | 13F | Castleview Partners, Llc | 0 | -100.00 | 0 | |||||
| 2025-09-04 | 13F/A | Advisor Group Holdings, Inc. | 642,447 | 2.58 | 32,580 | 2.60 | ||||
| 2025-08-14 | 13F | Royal Bank Of Canada | 2,081,085 | -17.27 | 105,533 | -17.25 | ||||
| 2025-07-24 | 13F | Robertson Stephens Wealth Management, LLC | 50,343 | -38.02 | 2,553 | -38.01 | ||||
| 2025-08-13 | 13F | Beacon Pointe Advisors, LLC | 12,104 | 0.00 | 614 | 0.00 | ||||
| 2025-07-14 | 13F | Legacy Capital Group California, Inc. | 6,629 | 0.71 | 336 | 0.90 | ||||
| 2025-07-30 | 13F | Clune & Associates, Ltd. | 21,432 | 44.13 | 1,087 | 44.22 | ||||
| 2025-07-16 | 13F | Exeter Financial, LLC | 181,336 | 2.82 | 9,196 | 2.84 | ||||
| 2025-08-05 | 13F | Snider Financial Group | 159,612 | 0.89 | 8,094 | 0.90 | ||||
| 2025-07-30 | 13F | Bogart Wealth, LLC | 538,689 | 35,223.87 | 27,317 | 35,375.32 | ||||
| 2025-08-13 | 13F | Virtue Capital Management, LLC | 75,554 | -8.59 | 3,831 | -8.55 | ||||
| 2025-08-12 | 13F | XTX Topco Ltd | 7,058 | 358 | ||||||
| 2025-07-22 | 13F | Merit Financial Group, LLC | 159,354 | 23.53 | 8,081 | 23.55 | ||||
| 2025-07-17 | 13F | Janney Montgomery Scott LLC | 214,653 | 15.90 | 11 | 11.11 | ||||
| 2025-07-08 | 13F | Madison Park Capital Advisors, LLC | 15,969 | 56.70 | 810 | 56.78 | ||||
| 2025-08-08 | 13F | Thrive Capital Management, LLC | 34,087 | 1,729 | ||||||
| 2025-08-18 | 13F | Front Row Advisors LLC | 550 | 0.00 | 28 | 0.00 | ||||
| 2025-05-15 | 13F | Nia Impact Advisors, Llc | 0 | -100.00 | 0 | |||||
| 2025-08-04 | 13F | Impact Partnership Wealth, LLC | 11,953 | 606 | ||||||
| 2025-08-13 | 13F | Vertex Planning Partners, LLC | 46,633 | 4.63 | 2,365 | 4.65 | ||||
| 2025-07-29 | 13F | Ifrah Financial Services, Inc. | 38,862 | 0.54 | 1,971 | 0.56 | ||||
| 2025-07-22 | 13F | Acute Investment Advisory, Llc | 45,986 | -41.65 | 2,332 | -41.65 | ||||
| 2025-08-07 | 13F | PFG Advisors | 8,400 | 426 | ||||||
| 2025-07-30 | 13F | Financial Perspectives, Inc | 3,995 | 0.86 | 203 | 1.00 | ||||
| 2025-08-27 | NP | OHIO NATIONAL FUND INC - ON iShares Managed Risk Balanced Portfolio | 160,000 | -77.97 | 8,114 | -77.96 | ||||
| 2025-08-13 | 13F | Nicolet Advisory Services, Llc | 6,017 | -18.50 | 304 | -18.28 | ||||
| 2025-08-13 | 13F | Capital Analysts, Inc. | 856 | 0.00 | 0 | |||||
| 2025-07-10 | 13F | Sovran Advisors, LLC | 10,709 | 541 | ||||||
| 2025-08-07 | 13F | Nwam Llc | 4,293 | 0.44 | 218 | 0.46 | ||||
| 2025-08-12 | 13F | Heritage Trust Co | 19,837 | 0.00 | 1,006 | 0.00 | ||||
| 2025-08-14 | 13F | Fmr Llc | 5,640,733 | 49.73 | 286,042 | 49.76 | ||||
| 2025-07-18 | 13F | Alley Investment Management Company, LLC | 7,393 | -2.63 | 375 | -2.60 | ||||
| 2025-07-29 | NP | TSPX - Twin Oak Active Opportunities ETF | 767,359 | -61.81 | 38,882 | -61.82 | ||||
| 2025-08-04 | 13F | Spire Wealth Management | 8,723 | 13.76 | 442 | 13.92 | ||||
| 2025-08-12 | 13F | Clearwater Capital Advisors, LLC | 7,797 | -13.28 | 395 | -13.19 | ||||
| 2025-07-29 | 13F | Violich Capital Management, Inc. | 0 | -100.00 | 0 | |||||
| 2025-07-29 | 13F | Koshinski Asset Management, Inc. | 6,238 | 1.10 | 316 | 1.28 | ||||
| 2025-08-13 | 13F | Colonial Trust Advisors | 26 | 0.00 | 1 | 0.00 | ||||
| 2025-05-12 | 13F | Providence First Trust Co | 0 | -100.00 | 0 | |||||
| 2025-08-13 | 13F | Townsquare Capital Llc | 0 | -100.00 | 0 | |||||
| 2025-05-15 | 13F | Archetype Wealth Partners | 0 | -100.00 | 0 | |||||
| 2025-07-21 | 13F | Old Second National Bank Of Aurora | 5,800 | 0.00 | 294 | 0.00 | ||||
| 2025-07-24 | 13F | Blair William & Co/il | 7,344 | -12.00 | 372 | -12.06 | ||||
| 2025-08-12 | 13F | Horizon Financial Services, Llc | 129 | 0.00 | 7 | 0.00 | ||||
| 2025-09-04 | 13F | SevenBridge Financial Group, LLC | 11,932 | 0.00 | 604 | 0.17 | ||||
| 2025-07-07 | 13F | General Partner, Inc. | 157,260 | 57.17 | 7,975 | 57.19 | ||||
| 2025-08-14 | 13F | Smartleaf Asset Management LLC | 3 | -99.96 | 0 | -100.00 | ||||
| 2025-08-12 | 13F | Proequities, Inc. | 0 | 0 | ||||||
| 2025-08-13 | 13F | Avestar Capital, LLC | 407,352 | 8.22 | 20,657 | 8.24 | ||||
| 2025-08-11 | 13F | Regal Investment Advisors LLC | 16,013 | -1.27 | 812 | -1.22 | ||||
| 2025-08-07 | 13F | Proficio Capital Partners LLC | 21,284 | -37.73 | 1,079 | -37.70 | ||||
| 2025-07-08 | 13F | Nbc Securities, Inc. | 100 | -81.82 | 0 | |||||
| 2025-08-04 | 13F | Bay Colony Advisory Group, Inc d/b/a Bay Colony Advisors | 5,517 | -5.22 | 280 | -5.10 | ||||
| 2025-08-14 | 13F | Raymond James Financial Inc | 1,003,443 | 18.09 | 50,885 | 18.12 | ||||
| 2025-07-17 | 13F | Hengehold Capital Management Llc | 194,939 | -8.75 | 9,885 | -8.73 | ||||
| 2025-04-23 | 13F | Mascagni Wealth Management, Inc. | 0 | -100.00 | 0 | |||||
| 2025-08-12 | 13F | Bokf, Na | 295,935 | 15.32 | 15,007 | 15.34 | ||||
| 2025-07-31 | 13F | CVA Family Office, LLC | 12,227 | 1.76 | 620 | 1.81 | ||||
| 2025-08-11 | 13F | Synergy Investment Management, LLC | 0 | -100.00 | 0 | |||||
| 2025-08-08 | 13F | Cetera Investment Advisers | 457,674 | -4.67 | 23,209 | -4.65 | ||||
| 2025-08-14 | 13F | Talon Private Wealth, LLC | 34,758 | 74.05 | 1,763 | 74.11 | ||||
| 2025-08-12 | 13F | Putnam Fl Investment Management Co | 6,401 | 0.00 | 325 | 0.00 | ||||
| 2025-08-04 | 13F | Flagship Harbor Advisors, Llc | 138,336 | 17.25 | 7,015 | 17.29 | ||||
| 2025-07-31 | 13F | Forte Asset Management Llc | 101,665 | 20.09 | 5,155 | 20.11 | ||||
| 2025-05-06 | 13F | Rsm Us Wealth Management Llc | 0 | -100.00 | 0 | |||||
| 2025-08-08 | 13F | KM Capital Management Ltd. | 14,992 | -14.45 | 760 | -14.41 | ||||
| 2025-08-19 | 13F | National Asset Management, Inc. | 0 | -100.00 | 0 | |||||
| 2025-08-13 | 13F | Jackson Creek Investment Advisors LLC | 17,179 | -26.98 | 1 | -100.00 | ||||
| 2025-08-14 | 13F | Bank of Marin | 14,476 | -2.04 | 734 | -2.00 | ||||
| 2025-08-18 | 13F | Geneos Wealth Management Inc. | 2,429 | 114.77 | 123 | 115.79 | ||||
| 2025-08-14 | 13F | Citadel Advisors Llc | 171,935 | 5.07 | 8,719 | 5.09 | ||||
| 2025-08-11 | 13F | Actinver Wealth Management, Inc. | 8,667 | 0.00 | 440 | 0.00 | ||||
| 2025-04-17 | 13F | Sound Income Strategies, LLC | 0 | -100.00 | 0 | |||||
| 2025-07-14 | 13F | AdvisorNet Financial, Inc | 2,043 | 40.90 | 104 | 41.10 | ||||
| 2025-07-31 | 13F | Resonant Capital Advisors, LLC | 184,542 | -16.03 | 9,358 | -16.01 | ||||
| 2025-08-15 | 13F | CI Private Wealth, LLC | 253,569 | -1.47 | 12,859 | -1.45 | ||||
| 2025-05-06 | 13F | Blankinship & Foster, LLC | 0 | -100.00 | 0 | -100.00 | ||||
| 2025-07-25 | 13F | Courage Miller Partners, LLC | 7,348 | -15.00 | 373 | -15.07 | ||||
| 2025-07-31 | 13F | Guardian Wealth Advisors, LLC | 37,521 | -4.70 | 1,903 | -4.71 | ||||
| 2025-08-11 | 13F | Hopwood Financial Services, Inc. | 6,640 | 0.00 | 337 | 0.00 | ||||
| 2025-08-11 | 13F | HighTower Advisors, LLC | 89,540 | 10.42 | 4,541 | 10.44 | ||||
| 2025-04-17 | 13F | Cliftonlarsonallen Wealth Advisors, Llc | 0 | -100.00 | 0 | |||||
| 2025-05-14 | 13F | Allie Family Office LLC | 0 | -100.00 | 0 | |||||
| 2025-08-08 | 13F | Creative Planning | 50,772 | -6.39 | 2,575 | -6.37 | ||||
| 2025-04-30 | 13F | Sofos Investments, Inc. | 79,397 | 17.28 | 4,025 | 19.65 | ||||
| 2025-07-09 | 13F | Lifelong Wealth Advisors, Inc. | 5,353 | 0.00 | 271 | 0.00 | ||||
| 2025-07-25 | 13F | Atria Wealth Solutions, Inc. | 0 | -100.00 | 0 | |||||
| 2025-07-15 | 13F | Armis Advisers, LLC | 164,824 | 54.32 | 8,340 | 54.03 | ||||
| 2025-08-05 | 13F | Peregrine Asset Advisers, Inc. | 0 | -100.00 | 0 | |||||
| 2025-08-08 | 13F | WASHINGTON TRUST Co | 0 | -100.00 | 0 | |||||
| 2025-08-13 | 13F | Baird Financial Group, Inc. | 55,346 | 0.92 | 2,807 | 0.94 | ||||
| 2025-07-28 | 13F | Wealthspan Partners, Llc | 5,594 | 284 | ||||||
| 2025-07-16 | 13F | Encompass Wealth Advisors, Llc | 5,180 | 0.00 | 263 | 0.00 | ||||
| 2025-08-13 | 13F | Northwestern Mutual Wealth Management Co | 39,818 | 13.26 | 2,019 | 13.30 | ||||
| 2025-08-14 | 13F | Warren Averett Asset Management, LLC | 78,209 | 2.05 | 3,966 | 2.06 | ||||
| 2025-07-16 | 13F | Cahaba Wealth Management, Inc. | 21,350 | -8.47 | 1,083 | -8.46 | ||||
| 2025-07-22 | 13F | Clarius Group, LLC | 4,327 | 0.00 | 219 | 0.00 | ||||
| 2025-07-28 | 13F | Rosenberg Matthew Hamilton | 251 | 0.00 | 13 | 0.00 | ||||
| 2025-07-15 | 13F | Spectrum Planning & Advisory Services Inc. | 0 | -100.00 | 0 | |||||
| 2025-08-08 | 13F | Avantax Advisory Services, Inc. | 42,370 | 5.35 | 2,149 | 5.35 | ||||
| 2025-07-30 | 13F | Phillips Financial Management, Llc | 81,918 | -35.52 | 4,154 | -35.50 | ||||
| 2025-07-22 | 13F | Coastal Investment Advisors, Inc. | 60,251 | 18.24 | 3,055 | 18.27 | ||||
| 2025-04-17 | 13F | Optas, LLC | 0 | -100.00 | 0 | |||||
| 2025-08-13 | 13F | Cheviot Value Management, LLC | 0 | 0 | ||||||
| 2025-08-14 | 13F | Aprio Wealth Management, LLC | 13,596 | -3.20 | 689 | -3.23 | ||||
| 2025-07-11 | 13F | Congress Park Capital LLC | 227,048 | -29.15 | 11,514 | -29.14 | ||||
| 2025-08-07 | 13F | Guardian Partners Inc. | 6,745 | 2.27 | 341 | 2.10 | ||||
| 2025-08-11 | 13F | TAGStone Capital, Inc. | 14,073 | -59.00 | 712 | 71,000.00 | ||||
| 2025-07-17 | 13F | Capital Insight Partners, Llc | 5,665 | -16.38 | 287 | -16.33 | ||||
| 2025-08-05 | 13F | Cherry Tree Wealth Management, LLC | 123 | 6 | ||||||
| 2025-07-09 | 13F | Searcy Financial Services Inc /adv | 9,297 | 0.61 | 471 | 0.64 | ||||
| 2025-07-17 | 13F | Tempus Wealth Planning, LLC | 80,611 | 1.57 | 4,088 | 1.59 | ||||
| 2025-07-16 | 13F | Old North State Wealth Management, LLC | 15,513 | -19.44 | 787 | -19.36 | ||||
| 2025-08-13 | 13F | Cresset Asset Management, LLC | 12,499 | -42.24 | 634 | -42.30 | ||||
| 2025-07-29 | 13F | Private Trust Co Na | 1,222 | -4.23 | 62 | -4.69 | ||||
| 2025-08-12 | 13F | Financial Advocates Investment Management | 5,038 | -79.52 | 255 | -79.53 | ||||
| 2025-08-14 | 13F | Old Mission Capital Llc | 10,747 | 545 | ||||||
| 2025-07-15 | 13F | Norden Group Llc | 5,060 | 0.00 | 257 | 0.00 | ||||
| 2025-07-17 | 13F | Sage Rhino Capital Llc | 5,353 | 0.09 | 271 | 0.00 | ||||
| 2025-07-14 | 13F | McGlone Suttner Wealth Management, Inc. | 4,527 | 0.02 | 230 | 0.00 | ||||
| 2025-08-05 | 13F | Dunhill Financial, LLC | 5,569 | -12.97 | 282 | -12.69 | ||||
| 2025-07-30 | 13F | BlueChip Wealth Advisors LLC | 7,400 | 375 | ||||||
| 2025-08-14 | 13F | Fairview Capital Investment Management, Llc | 116,788 | 0.00 | 5,922 | 0.02 | ||||
| 2025-08-08 | 13F | Pnc Financial Services Group, Inc. | 4,864 | 91.19 | 247 | 92.19 | ||||
| 2025-07-24 | 13F | MSH Capital Advisors LLC | 58,158 | 3.52 | 2,949 | 3.55 | ||||
| 2025-07-30 | 13F | Strategic Blueprint, LLC | 7,405 | -7.25 | 376 | -7.18 | ||||
| 2025-08-08 | 13F | Financial Gravity Companies, Inc. | 86,232 | 12.55 | 4,373 | 13.18 | ||||
| 2025-08-11 | 13F | Citigroup Inc | 40,986 | 14.44 | 2,078 | 14.49 | ||||
| 2025-08-12 | 13F | LPL Financial LLC | 2,429,384 | 19.87 | 123,194 | 19.89 | ||||
| 2025-05-15 | 13F | Buckingham Strategic Partners | 0 | -100.00 | 0 | |||||
| 2025-08-06 | 13F | Cannon Financial Strategists, Inc. | 35,917 | 20.32 | 1,821 | 20.36 | ||||
| 2025-08-14 | 13F | Family Management Corp | 83,753 | -26.88 | 4,247 | -26.86 | ||||
| 2025-07-28 | 13F | Nvest Financial, LLC | 8,900 | 0.00 | 451 | 0.00 | ||||
| 2025-08-04 | 13F | Arkadios Wealth Advisors | 13,929 | 706 | ||||||
| 2025-04-01 | 13F | Massmutual Trust Co Fsb/adv | 0 | -100.00 | 0 | |||||
| 2025-07-29 | 13F | Chicago Partners Investment Group LLC | 114,896 | 5.09 | 5,819 | 5.34 | ||||
| 2025-08-11 | 13F | Plum Street Advisors, LLC | 75,338 | 6.53 | 3,820 | 6.56 | ||||
| 2025-07-14 | 13F | Southland Equity Partners LLC | 11,793 | 0.03 | 598 | 0.17 | ||||
| 2025-07-18 | 13F | Consolidated Portfolio Review Corp | 6,740 | -0.19 | 342 | -0.29 | ||||
| 2025-08-07 | 13F | Hennion & Walsh Asset Management, Inc. | 32,794 | -1.95 | 1,663 | -1.95 | ||||
| 2025-07-30 | 13F | Whittier Trust Co Of Nevada Inc | 3,026 | 0.00 | 153 | 0.00 | ||||
| 2025-08-14 | 13F | Bnp Paribas Arbitrage, Sa | 206,068 | 10,450 | ||||||
| 2025-07-15 | 13F | Garrett Investment Advisors LLC | 31,545 | 55.56 | 1,600 | 55.54 | ||||
| 2025-07-25 | 13F | Cerro Pacific Wealth Advisors LLC | 104,609 | 29.90 | 5,305 | 30.61 | ||||
| 2025-08-12 | 13F | Landing Point Financial Group, LLC | 269,060 | 1,776.55 | 13,644 | 1,779.34 | ||||
| 2025-07-15 | 13F | GSB Wealth Management, LLC | 12,765 | 0.00 | 647 | 0.00 | ||||
| 2025-08-14 | 13F | Mercer Global Advisors Inc /adv | 0 | -100.00 | 0 | |||||
| 2025-07-24 | 13F | Agate Pass Investment Management, LLC | 119,699 | -8.85 | 6,070 | -8.83 | ||||
| 2025-07-30 | 13F | First Citizens Bank & Trust Co | 0 | -100.00 | 0 | |||||
| 2025-08-14 | 13F | Mpwm Advisory Solutions, Llc | 2,197 | 111 | ||||||
| 2025-07-15 | 13F | Sheets Smith Wealth Management | 42,406 | 1.54 | 2,150 | 1.56 | ||||
| 2025-07-28 | 13F | Galilei Investment Office LLP | 4,000 | 0.00 | 203 | 0.00 | ||||
| 2025-05-14 | 13F | Snowden Capital Advisors LLC | 0 | -100.00 | 0 | -100.00 | ||||
| 2025-07-25 | 13F | Cwm, Llc | 343,561 | 12.96 | 17 | 13.33 | ||||
| 2025-08-13 | 13F | Scotia Capital Inc. | 8,422 | 2.74 | 427 | 2.89 | ||||
| 2025-07-28 | 13F | Copia Wealth Management | 8,935 | 0.00 | 453 | 0.00 | ||||
| 2025-04-22 | 13F | Dopkins Wealth Management, Llc | 0 | -100.00 | 0 | |||||
| 2025-08-14 | 13F | Financial Engines Advisors L.L.C. | 258,528 | 251.90 | 13,110 | 251.95 | ||||
| 2025-08-14 | 13F | Comerica Bank | 6,709 | 57.27 | 340 | 57.41 | ||||
| 2025-08-08 | 13F | Foundations Investment Advisors, LLC | 0 | -100.00 | 0 | |||||
| 2025-08-14 | 13F | Bank Of America Corp /de/ | 3,994,163 | 16.36 | 202,544 | 16.39 | ||||
| 2025-07-28 | 13F | Mutual Advisors, LLC | 605,224 | 39.04 | 30,667 | 39.15 | ||||
| 2025-07-24 | 13F | Bernard Wealth Management Corp. | 90 | 0.00 | 5 | 0.00 | ||||
| 2025-07-24 | 13F | M1 Capital Management LLC | 4,729 | 0.00 | 240 | 0.00 | ||||
| 2025-05-14 | 13F | Flow Traders U.s. Llc | 0 | -100.00 | 0 | |||||
| 2025-08-01 | 13F | Schmidt P J Investment Management Inc | 12,494 | 31.34 | 634 | 31.33 | ||||
| 2025-07-08 | 13F | Boltwood Capital Management | 20,300 | 0.00 | 1,029 | 0.00 | ||||
| 2025-08-08 | 13F | Empower Advisory Group, LLC | 4,344 | 5.59 | 220 | 5.77 | ||||
| 2025-07-14 | 13F | Ridgewood Investments LLC | 523 | 0.00 | 27 | 0.00 | ||||
| 2025-07-25 | 13F | LRI Investments, LLC | 151 | 8 | ||||||
| 2025-08-14 | 13F | Susquehanna International Group, Llp | 20,812 | 130.53 | 1,055 | 130.85 | ||||
| 2025-08-11 | 13F | Vista Cima Wealth Management LLC | 35,554 | -1.27 | 1,803 | -1.26 | ||||
| 2025-07-17 | 13F | HB Wealth Management, LLC | 0 | -100.00 | 0 | |||||
| 2025-07-24 | 13F | Capital Advisors, Ltd. LLC | 16,914 | -9.98 | 1 | |||||
| 2025-05-07 | 13F | TCTC Holdings, LLC | 0 | -100.00 | 0 | |||||
| 2025-08-13 | 13F | Parkworth Wealth Management, Inc. | 68,411 | 18.63 | 3,469 | 18.68 | ||||
| 2025-07-22 | 13F | Miracle Mile Advisors, LLC | 41,586 | 0.15 | 2,109 | 0.14 | ||||
| 2025-08-04 | 13F | Assetmark, Inc | 41,434 | 729.84 | 2,101 | 730.43 | ||||
| 2025-07-25 | 13F | Sequoia Financial Advisors, LLC | 7,060 | 31.72 | 358 | 32.10 | ||||
| 2025-07-22 | 13F | Mascoma Wealth Management LLC | 10,952 | 0.03 | 555 | 0.00 | ||||
| 2025-08-14 | 13F | Wells Fargo & Company/mn | 1,932 | -41.60 | 98 | -41.92 | ||||
| 2025-07-17 | 13F | Applied Capital LLC | 11,153 | 20.02 | 566 | 19.96 | ||||
| 2025-08-11 | 13F | Shufro Rose & Co Llc | 110,790 | -0.56 | 5,617 | -0.55 | ||||
| 2025-08-12 | 13F | O'shaughnessy Asset Management, Llc | 0 | -100.00 | 0 | |||||
| 2025-08-08 | 13F | Mv Capital Management, Inc. | 38 | 0.00 | 2 | 0.00 | ||||
| 2025-07-16 | 13F | MBE Wealth Management, LLC | 9,841 | 499 | ||||||
| 2025-07-30 | 13F | Brookstone Capital Management | 51,366 | 33.14 | 2,605 | 33.13 | ||||
| 2025-07-24 | 13F | True Link Financial Advisors, LLC | 40,969 | 0.00 | 2,078 | 0.00 | ||||
| 2025-08-11 | 13F | Private Advisor Group, LLC | 261,730 | -7.31 | 13,272 | -7.29 | ||||
| 2025-07-23 | 13F | Elevate Wealth Advisory, Inc | 15,418 | 18.45 | 782 | 18.51 | ||||
| 2025-07-18 | 13F/A | MJT & Associates Financial Advisory Group, Inc. | 613 | 136.68 | 31 | 138.46 | ||||
| 2025-07-25 | 13F | Envestnet Portfolio Solutions, Inc. | 0 | -100.00 | 0 | |||||
| 2025-08-14 | 13F | Bank Of Hawaii | 22,121 | -49.06 | 1,122 | -49.07 | ||||
| 2025-07-30 | 13F | Probity Advisors, Inc. | 4,850 | -50.26 | 246 | -50.40 | ||||
| 2025-07-25 | 13F | BCR Wealth Strategies, LLC | 73,142 | 2.51 | 4 | 0.00 | ||||
| 2025-07-30 | 13F | LGT Financial Advisors LLC | 1 | -99.67 | 0 | -100.00 | ||||
| 2025-08-13 | 13F | Ofc Financial Planning, Llc | 81,274 | -6.65 | 4,121 | -6.64 | ||||
| 2025-04-15 | 13F | Noble Wealth Management PBC | 23,028 | -44.84 | 1,168 | -44.56 | ||||
| 2025-07-11 | 13F | Capital Advantage, Inc. | 88,496 | -19.29 | 4,488 | -18.85 | ||||
| 2025-07-22 | 13F | Glassy Mountain Advisors, Inc. | 211,327 | -5.39 | 10,716 | -5.37 | ||||
| 2025-04-28 | 13F | Boulder Wealth Advisors, LLC | 210,213 | 58.07 | 10,658 | 58.92 | ||||
| 2025-08-04 | 13F | Atria Investments Llc | 215,748 | -3.13 | 10,941 | -3.11 | ||||
| 2025-08-13 | 13F | Cary Street Partners Financial Llc | 476,468 | 14.35 | 24,162 | 14.38 | ||||
| 2025-07-23 | 13F | Ohio National Investments, Inc. | 120,000 | -85.83 | 6,085 | -85.82 | ||||
| 2025-07-23 | 13F | Country Club Bank /gfn | 20,367 | 6.48 | 1,033 | 6.61 | ||||
| 2025-08-13 | 13F | Shepherd Financial Partners LLC | 15,929 | -2.04 | 808 | -2.06 | ||||
| 2025-07-09 | 13F | Chesley Taft & Associates LLC | 35,046 | -7.45 | 1,777 | -7.40 | ||||
| 2025-07-23 | 13F | Bellevue Asset Management, Llc | 36 | 2.86 | 2 | 0.00 | ||||
| 2025-08-14 | 13F | Certified Advisory Corp | 10,544 | -0.56 | 535 | -0.56 | ||||
| 2025-07-09 | 13F | Burt Wealth Advisors | 18,358 | 931 | ||||||
| 2025-07-15 | 13F | EWG Elevate Inc. | 8,693 | -0.78 | 441 | -0.90 | ||||
| 2025-08-14 | 13F | Mariner, LLC | 1,134,217 | -0.30 | 57,516 | -0.28 | ||||
| 2025-08-14 | 13F | Boston Private Wealth Llc | 59,466 | -27.92 | 3,016 | -27.91 | ||||
| 2025-07-14 | 13F | Maryland Capital Advisors Inc. | 11,250 | -7.89 | 570 | -7.92 | ||||
| 2025-08-04 | 13F | BLB&B Advisors, LLC | 3,999 | 0.00 | 203 | 0.00 | ||||
| 2025-08-08 | 13F | Avalon Trust Co | 4,097 | 39.97 | 208 | 39.86 | ||||
| 2025-07-15 | 13F | Roger Wittlin Investment Advisory, LLC | 10,727 | -18.99 | 544 | -19.08 | ||||
| 2025-08-14 | 13F | Hrt Financial Lp | 40,011 | 2 | ||||||
| 2025-07-24 | 13F | Galvin, Gaustad & Stein, LLC | 131,784 | 65.75 | 6,683 | 65.77 | ||||
| 2025-08-04 | 13F | Bristlecone Advisors, LLC | 18,330 | 0.00 | 930 | 0.00 | ||||
| 2025-08-12 | 13F | Zacks Investment Management | 43,879 | -11.92 | 2,225 | -11.88 | ||||
| 2025-08-07 | 13F | Aspen Wealth Strategies, LLC | 4,795 | -6.44 | 243 | -6.18 | ||||
| 2025-07-15 | 13F | StoneCrest Wealth Management, Inc. | 46,782 | 18.41 | 2,372 | 18.42 | ||||
| 2025-08-13 | 13F/A | StoneX Group Inc. | 0 | -100.00 | 0 | -100.00 | ||||
| 2025-07-10 | 13F | Exchange Traded Concepts, Llc | 770,716 | -49.71 | 39,083 | -49.70 | ||||
| 2025-07-29 | 13F | Kraft, Davis & Associates, LLC | 4,525 | 229 | ||||||
| 2025-04-23 | 13F | Independent Solutions Wealth Management, LLC | 0 | -100.00 | 0 | |||||
| 2025-08-14 | 13F | Goldman Sachs Group Inc | 417,592 | 21,176 | ||||||
| 2025-07-29 | 13F | Tradewinds Capital Management, LLC | 22,748 | 1.16 | 1,154 | 1.14 | ||||
| 2025-07-15 | 13F | Beacon Investment Advisory Services, Inc. | 48,080 | 0.00 | 2,438 | 0.04 | ||||
| 2025-08-11 | 13F | HHM Wealth Advisors, LLC | 1,014 | 0.00 | 51 | 0.00 | ||||
| 2025-08-13 | 13F | Haverford Trust Co | 133,778 | -5.60 | 6,784 | -5.58 | ||||
| 2025-07-23 | 13F | Valmark Advisers, Inc. | 38,441 | 2.16 | 1,949 | 2.20 | ||||
| 2025-04-21 | 13F | United Advisor Group, LLC | 0 | -100.00 | 0 | |||||
| 2025-08-12 | 13F | Jacobi Capital Management LLC | 41,635 | 24.31 | 2,111 | 24.32 | ||||
| 2025-08-13 | 13F | M Holdings Securities, Inc. | 0 | -100.00 | 0 | |||||
| 2025-05-13 | 13F | Keystone Financial Group | 0 | -100.00 | 0 | |||||
| 2025-07-21 | 13F | Investment Planning Advisors, Inc. | 7,976 | -26.15 | 404 | -26.14 | ||||
| 2025-08-12 | 13F | Franklin Resources Inc | 10,000 | 0.00 | 507 | 0.00 | ||||
| 2025-08-15 | 13F | Captrust Financial Advisors | 112,990 | -0.25 | 5,730 | -0.23 | ||||
| 2025-07-23 | 13F | Prime Capital Investment Advisors, LLC | 70,488 | -21.49 | 3,574 | -21.47 | ||||
| 2025-07-22 | 13F | Global Strategic Investment Solutions, LLC | 350,836 | 10.30 | 17,791 | 10.32 | ||||
| 2025-08-05 | 13F | Bank Of Montreal /can/ | 24,281 | -35.02 | 1,231 | -35.01 | ||||
| 2025-04-10 | 13F | Lmcg Investments, Llc | 0 | -100.00 | 0 | |||||
| 2025-07-23 | 13F | Fortis Advisors, LLC | 8,628 | 1.15 | 438 | 1.16 | ||||
| 2025-07-17 | 13F | Park Place Capital Corp | 15,983 | 807 | ||||||
| 2025-04-23 | 13F | Goldstein Advisors, LLC | 0 | -100.00 | 0 | |||||
| 2025-08-14 | 13F | Coyle Financial Counsel LLC | 12,361 | 8.12 | 627 | 8.12 | ||||
| 2025-08-11 | 13F | Wealthspire Advisors, LLC | 5,265 | -35.49 | 267 | -35.59 | ||||
| 2025-08-13 | 13F | Cerity Partners LLC | 234,646 | -7.78 | 11,899 | -7.77 | ||||
| 2025-08-11 | 13F | TD Waterhouse Canada Inc. | 5,401 | 8.02 | 273 | 7.94 | ||||
| 2025-08-11 | 13F | Bell Investment Advisors, Inc | 328 | 1.23 | 17 | 0.00 | ||||
| 2025-08-14 | 13F | CoreCap Advisors, LLC | 149 | -21.16 | 8 | -22.22 | ||||
| 2025-07-31 | 13F | Glass Jacobson Investment Advisors llc | 19,243 | 0.00 | 976 | 0.52 | ||||
| 2025-08-14 | 13F | Sunbelt Securities, Inc. | 759 | 0.00 | 38 | 0.00 | ||||
| 2025-08-14 | 13F | Two Sigma Securities, Llc | 31,738 | 1,609 | ||||||
| 2025-05-15 | 13F | Syon Capital Llc | 0 | -100.00 | 0 | -100.00 | ||||
| 2025-07-31 | 13F | Cambridge Investment Research Advisors, Inc. | 397,918 | 28.96 | 20 | 33.33 | ||||
| 2025-08-12 | 13F | Osborne Partners Capital Management, Llc | 561,281 | -16.16 | 28,463 | -16.15 | ||||
| 2025-08-14 | 13F | Ameriprise Financial Inc | 6,971 | -8.22 | 354 | -8.31 | ||||
| 2025-08-06 | 13F | Golden State Wealth Management, LLC | 1,008 | 0.00 | 51 | 0.00 | ||||
| 2025-08-06 | 13F | Legacy Wealth Managment, LLC/ID | 98,888 | -39.69 | 5,015 | -39.68 | ||||
| 2025-07-24 | 13F | Ronald Blue Trust, Inc. | 3,128 | 0.55 | 159 | 0.64 | ||||
| 2025-08-15 | 13F | Howland Capital Management Llc | 70,298 | 2.27 | 3,565 | 2.30 | ||||
| 2025-07-17 | 13F | Nelson, Van Denburg & Campbell Wealth Management Group, LLC | 5,335 | 0.00 | 271 | 0.00 | ||||
| 2025-08-11 | 13F | Aptus Capital Advisors, LLC | 22,103 | 0.63 | 1,121 | 0.63 | ||||
| 2025-07-10 | 13F | YHB Investment Advisors, Inc. | 5,727 | -6.91 | 290 | -6.75 | ||||
| 2025-07-18 | 13F | Wetzel Investment Advisors, Inc. | 4,440 | 225 | ||||||
| 2025-08-14 | 13F | Advisor OS, LLC | 144,692 | 12.29 | 7,337 | 12.31 | ||||
| 2025-04-23 | 13F | Alpine Bank Wealth Management | 0 | -100.00 | 0 | |||||
| 2025-08-13 | 13F | Advocacy Wealth Management Services, LLC | 110,032 | 7.82 | 5,580 | 7.83 | ||||
| 2025-08-12 | 13F | MAI Capital Management | 6,893 | -16.37 | 350 | -16.31 | ||||
| 2025-07-30 | 13F | Princeton Global Asset Management LLC | 74,145 | 1.69 | 3,760 | 1.70 | ||||
| 2025-05-05 | 13F | Morningstar Investment Services LLC | 14,059 | -10.92 | 1 | |||||
| 2025-07-31 | 13F | Turning Point Benefit Group, Inc. | 4,694 | -26.02 | 238 | -25.62 | ||||
| 2025-07-21 | 13F | Ameritas Advisory Services, LLC | 87,683 | 10.25 | 4,446 | 10.27 | ||||
| 2025-07-17 | 13F | CWA Asset Management Group, LLC | 19,652 | -0.55 | 997 | -0.50 | ||||
| 2025-08-11 | 13F | Nations Financial Group Inc, /ia/ /adv | 9,435 | 0.29 | 478 | 0.21 | ||||
| 2025-08-07 | 13F | Argent Advisors, Inc. | 8,367 | 23.44 | 424 | 23.62 | ||||
| 2025-08-04 | 13F | Simon Quick Advisors, Llc | 291,605 | 0.00 | 14,787 | 0.02 | ||||
| 2025-08-06 | 13F | Founders Financial Securities Llc | 122,088 | 44.32 | 6,191 | 44.45 | ||||
| 2025-07-10 | 13F | Charter Oak Capital Management, LLC | 7,340 | 7.14 | 372 | 7.20 | ||||
| 2025-08-14 | 13F | Stifel Financial Corp | 304,095 | 0.08 | 15,421 | 0.10 | ||||
| 2025-08-08 | 13F | Atlantic Trust, LLC | 198 | 0.00 | 10 | 0.00 | ||||
| 2025-07-30 | NP | FAUDX - Strategic Advisers Short Duration Fund This fund is a listed as child fund of Fmr Llc and if that institution has disclosed ownership in this security, then these positions will not be double counted when calculating total shares and total value | 2,694,174 | 10,748.73 | 136,514 | 10,751.59 | ||||
| 2025-08-06 | 13F | Able Wealth Management LLC | 38,714 | 76.33 | 1,963 | 76.37 | ||||
| 2025-08-13 | 13F | Prossimo Advisors, LLC | 11,329 | 0.00 | 1 | |||||
| 2025-07-15 | 13F | Verum Partners LLC | 9,925 | -11.57 | 503 | -11.60 | ||||
| 2025-07-29 | 13F | Hoese & Co LLP | 0 | -100.00 | 0 | |||||
| 2025-08-11 | 13F | Edgemoor Investment Advisors, Inc. | 234,465 | 1.79 | 11,890 | 1.81 | ||||
| 2025-08-12 | 13F | SRS Capital Advisors, Inc. | 7,881 | -97.97 | 400 | -97.97 | ||||
| 2025-08-05 | 13F | Aviance Capital Partners, LLC | 5,079 | -84.96 | 258 | -84.99 | ||||
| 2025-08-14 | 13F | UBS Group AG | 3,552,462 | 5.46 | 180,145 | 5.48 | ||||
| 2025-08-11 | 13F | Seizert Capital Partners, Llc | 36,356 | 0.00 | 1,844 | 0.00 | ||||
| 2025-07-08 | 13F | Atwood & Palmer Inc | 1,525 | -73.60 | 77 | -73.63 | ||||
| 2025-08-08 | 13F | Bailard, Inc. | 54,660 | 2,772 | ||||||
| 2025-08-06 | 13F | SP Asset Management LLC | 99,297 | -16.51 | 5,035 | -16.49 | ||||
| 2025-05-02 | 13F | Transcendent Capital Group LLC | 0 | -100.00 | 0 | |||||
| 2025-07-28 | 13F | RFG Advisory, LLC | 12,299 | -38.77 | 624 | -38.80 | ||||
| 2025-08-11 | 13F | Retirement Capital Strategies | 48,350 | 2,452 | ||||||
| 2025-07-14 | 13F | Foster Group, Inc. | 922,202 | 10.41 | 46,765 | 10.43 | ||||
| 2025-04-21 | 13F | Accelerate Investment Advisors LLC | 0 | -100.00 | 0 | |||||
| 2025-08-27 | 13F/A | Brinker Capital Investments, LLC | 10,811 | 0.60 | 548 | 0.74 | ||||
| 2025-07-17 | 13F | Michels Family Financial, LLC | 47,717 | -1.38 | 2,420 | -1.39 | ||||
| 2025-08-14 | 13F | Peapack Gladstone Financial Corp | 39,783 | -14.72 | 2 | 0.00 | ||||
| 2025-08-06 | 13F | Quadrant Private Wealth Management, LLC | 6,482 | -28.30 | 329 | -28.38 | ||||
| 2025-08-08 | 13F | Condor Capital Management | 7,286 | 1.05 | 369 | 1.10 | ||||
| 2025-07-14 | 13F | Park Avenue Securities Llc | 22,955 | 98.74 | 1 | |||||
| 2025-04-22 | 13F | Cornerstone Management, Inc. | 0 | -100.00 | 0 | |||||
| 2025-08-12 | 13F | Pathstone Holdings, LLC | 55,951 | 408.09 | 2,837 | 408.42 | ||||
| 2025-07-09 | 13F | Bulwark Capital Corp | 2,605 | 132 | ||||||
| 2025-08-01 | 13F | Envestnet Asset Management Inc | 743,773 | -34.26 | 37,717 | -34.25 | ||||
| 2025-08-05 | 13F | Tsfg, Llc | 13,972 | -3.19 | 1 | |||||
| 2025-08-12 | 13F | J.w. Cole Advisors, Inc. | 300,046 | 47.17 | 15,215 | 47.20 | ||||
| 2025-07-17 | 13F | Fifth Third Securities, Inc. | 6,791 | 0.00 | 344 | 0.00 | ||||
| 2025-08-08 | 13F | Carl P. Sherr & Co., LLC | 0 | -100.00 | 0 | |||||
| 2025-07-28 | 13F | Harbour Investments, Inc. | 13,774 | 26.82 | 698 | 26.91 | ||||
| 2025-08-01 | 13F | Integral Investment Advisors, Inc. | 59,657 | 10.29 | 3,025 | 10.32 | ||||
| 2025-08-07 | 13F | Kestra Private Wealth Services, Llc | 31,764 | -2.64 | 1,611 | -2.66 | ||||
| 2025-08-06 | 13F | Rps Advisory Solutions Llc | 43,135 | 2,187 | ||||||
| 2025-07-16 | 13F | Perigon Wealth Management, LLC | 20,827 | 0.09 | 1,056 | 0.19 | ||||
| 2025-07-29 | 13F | Stephens Inc /ar/ | 3,961 | -8.44 | 201 | -8.68 | ||||
| 2025-07-16 | 13F | Spinnaker Investment Group, LLC | 4,976 | -2.39 | 252 | -2.33 | ||||
| 2025-08-14 | 13F | Colony Group, LLC | 1,615,686 | 97.62 | 81,931 | 97.66 | ||||
| 2025-08-06 | 13F | AE Wealth Management LLC | 9,176 | 1,664.62 | 465 | 1,688.46 | ||||
| 2025-08-12 | 13F | NWF Advisory Services Inc. | 7,631 | -5.24 | 387 | -4.93 | ||||
| 2025-08-08 | 13F | Fusion Capital, LLC | 29,026 | -2.23 | 1,472 | -2.26 | ||||
| 2025-07-14 | 13F | Clayton Financial Group LLC | 0 | -100.00 | 0 | |||||
| 2025-08-06 | 13F | Savant Capital, LLC | 183,769 | -15.50 | 9,319 | -15.49 | ||||
| 2025-07-24 | 13F | IFP Advisors, Inc | 73,721 | 114.71 | 3,738 | 114.83 | ||||
| 2025-08-11 | 13F | Farrow Financial Inc. | 137,094 | -0.30 | 6,952 | -0.27 | ||||
| 2025-08-12 | 13F | Cynosure Management, Llc | 447,247 | 1.76 | 22,680 | 1.78 | ||||
| 2025-08-11 | 13F | Traub Capital Management LLC | 5,059 | 257 | ||||||
| 2025-08-12 | 13F | CIBC Private Wealth Group, LLC | 1,323 | -69.64 | 67 | -69.55 | ||||
| 2025-08-04 | 13F | Roble, Belko & Company, Inc | 372,968 | 7.69 | 19 | 5.88 | ||||
| 2025-08-07 | 13F | Global Wealth Management Investment Advisory, Inc. | 31,378 | 1,591 | ||||||
| 2025-08-04 | 13F | WNY Asset Management, LLC | 8,929 | 12.57 | 453 | 12.44 | ||||
| 2025-07-29 | 13F | Harbor Asset Planning, Inc. | 813 | 41 | ||||||
| 2025-08-13 | 13F | SageView Advisory Group, LLC | 4,814 | 0.00 | 244 | -0.41 | ||||
| 2025-07-23 | 13F | Slow Capital, Inc. | 66,501 | -74.57 | 3,372 | -74.57 | ||||
| 2025-04-22 | 13F | Evanson Asset Management, LLC | 0 | -100.00 | 0 | |||||
| 2025-08-11 | 13F | Cornerstone Planning Group LLC | 619 | 1.14 | 31 | 3.33 | ||||
| 2025-08-14 | 13F | Amussen Hunsaker Associates Llc | 817,442 | 19.30 | 41,452 | 19.32 | ||||
| 2025-07-28 | 13F | CGC Financial Services, LLC | 11,211 | 0.13 | 569 | 0.18 | ||||
| 2025-08-12 | 13F | Global Retirement Partners, LLC | 204,602 | 52.03 | 10,375 | 52.89 | ||||
| 2025-08-13 | 13F | Baker Avenue Asset Management, LP | 0 | -100.00 | 0 | |||||
| 2025-08-04 | 13F | Center for Financial Planning, Inc. | 188 | 0.00 | 10 | 0.00 | ||||
| 2025-08-12 | 13F | Wealthbridge Capital Management, Llc | 86,707 | 4.29 | 4,397 | 4.29 | ||||
| 2025-07-31 | 13F/A | Avion Wealth | 177 | -33.46 | 0 | |||||
| 2025-07-25 | 13F | Wealth Architects, LLC | 89,495 | 75.73 | 4,538 | 75.76 | ||||
| 2025-08-08 | 13F | Everett Harris & Co /ca/ | 20,000 | 1,014 | ||||||
| 2025-08-12 | 13F | Investor's Fiduciary Advisor Network, LLC | 4,677 | 0 | ||||||
| 2025-05-15 | 13F | Gts Securities Llc | 0 | -100.00 | 0 | |||||
| 2025-07-23 | 13F | Winthrop Advisory Group LLC | 1,198,040 | 5.64 | 60,753 | 5.66 | ||||
| 2025-05-15 | 13F | Intrepid Family Office Llc | 0 | -100.00 | 0 | |||||
| 2025-07-10 | 13F | HF Advisory Group, LLC | 4,401 | 1.10 | 223 | 1.36 | ||||
| 2025-08-06 | 13F | Texas Yale Capital Corp. | 11,400 | -77.82 | 578 | -77.81 | ||||
| 2025-07-29 | 13F | Vista Finance, Llc | 29,026 | 0.33 | 1,472 | 0.34 | ||||
| 2025-08-14 | 13F | Kintayl Capital LP | 122,200 | 0.00 | 6,197 | 0.02 | ||||
| 2025-08-12 | 13F | Advisors Asset Management, Inc. | 2,489 | -47.82 | 126 | -47.72 | ||||
| 2025-08-12 | 13F | Jpmorgan Chase & Co | 94,309 | -45.65 | 4,782 | -45.64 | ||||
| 2025-08-14 | 13F/A | Rockefeller Capital Management L.P. | 19,355 | 21.73 | 982 | 21.71 | ||||
| 2025-08-05 | 13F | Flynn Zito Capital Management, Llc | 4,565 | -22.05 | 231 | -21.96 | ||||
| 2025-08-05 | 13F | Ceera Investments, Llc | 10,570 | -82.18 | 536 | -82.18 | ||||
| 2025-07-10 | 13F | Wealth Enhancement Advisory Services, Llc | 2,644,271 | -11.43 | 133,615 | -11.73 | ||||
| 2025-07-14 | 13F | MY Wealth Management Inc. | 183,200 | 9,290 | ||||||
| 2025-07-21 | 13F | Crews Bank & Trust | 404 | 0.00 | 20 | 0.00 | ||||
| 2025-07-11 | 13F | LongView Wealth Management | 119,221 | 0.31 | 6,046 | 0.33 | ||||
| 2025-08-14 | 13F | Kovitz Investment Group Partners, LLC | 7,790 | 0.00 | 395 | 0.25 | ||||
| 2025-08-04 | 13F | Creekmur Asset Management LLC | 1,589 | 2.58 | 81 | 2.56 | ||||
| 2025-07-11 | 13F | Farther Finance Advisors, LLC | 20,739 | 27.48 | 1,052 | 28.01 | ||||
| 2025-07-17 | 13F | Emerald Advisors, LLC | 20,297 | -22.70 | 1,029 | -22.69 | ||||
| 2025-07-23 | 13F | Proffitt & Goodson Inc | 2,951 | -45.18 | 150 | -45.22 | ||||
| 2025-08-11 | 13F | Principal Securities, Inc. | 54,903 | 31.99 | 2,784 | 32.76 | ||||
| 2025-07-23 | 13F | Heck Capital Advisors, LLC | 7,627 | 31.93 | 387 | 31.74 | ||||
| 2025-07-29 | 13F | Arista Wealth Management, LLC | 21,801 | 1,106 | ||||||
| 2025-07-22 | 13F | Belpointe Asset Management LLC | 46,612 | -4.29 | 2,364 | -4.29 | ||||
| 2025-07-18 | 13F | SOA Wealth Advisors, LLC. | 877 | 0.00 | 44 | 0.00 | ||||
| 2025-07-30 | 13F | Avidian Wealth Solutions, LLC | 46,513 | -22.69 | 2,359 | -22.69 | ||||
| 2025-07-16 | 13F | Leading Edge Financial Planning LLC | 7,692 | -11.63 | 390 | -11.56 | ||||
| 2025-08-08 | 13F | TD Capital Management LLC | 0 | -100.00 | 0 | |||||
| 2025-07-28 | 13F | WJ Wealth Management, LLC | 218,419 | 804.16 | 11,076 | 804.90 | ||||
| 2025-08-11 | 13F | Lowe Brockenbrough & Co Inc | 1,107 | 56 | ||||||
| 2025-07-17 | 13F | Johnson Bixby & Associates, LLC | 10,243 | -52.62 | 519 | -52.65 | ||||
| 2025-05-14 | 13F | Pilgrim Partners Asia Pte Ltd | 2,320 | 0.00 | 118 | 0.86 | ||||
| 2025-07-08 | 13F | Canandaigua National Bank & Trust Co | 9,596 | -19.51 | 487 | -19.54 | ||||
| 2025-08-18 | 13F | Pacific Center for Financial Services | 12,624 | -0.16 | 640 | -0.16 | ||||
| 2025-07-15 | 13F | Regatta Capital Group, Llc | 14,107 | 13.44 | 715 | 13.49 | ||||
| 2025-07-24 | 13F | Costello Asset Management, INC | 514 | 0.98 | 26 | 4.00 | ||||
| 2025-07-30 | 13F | Capital Wealth Alliance, LLC | 32,840 | 25.34 | 1,665 | 25.38 | ||||
| 2025-08-06 | 13F | Legacy Investment Solutions, LLC | 98,888 | -26.29 | 5,015 | -25.98 | ||||
| 2025-08-11 | 13F | Strategic Wealth Partners, Ltd. | 3,623 | -36.09 | 184 | -36.01 | ||||
| 2025-08-15 | 13F | Tower Research Capital LLC (TRC) | 0 | -100.00 | 0 | |||||
| 2025-07-25 | 13F | RHS Financial, LLC | 53,203 | -34.53 | 2,698 | -34.52 | ||||
| 2025-08-07 | 13F | 49 Wealth Management, Llc | 11,220 | -66.12 | 569 | -66.17 | ||||
| 2025-08-19 | 13F | Newbridge Financial Services Group, Inc. | 2,795 | 11.80 | 142 | 11.90 | ||||
| 2025-07-31 | 13F | B & T Capital Management DBA Alpha Capital Management | 4,556 | -75.18 | 231 | -75.16 | ||||
| 2025-05-08 | 13F | Essential Planning, LLC. | 0 | -100.00 | 0 | |||||
| 2025-08-13 | 13F | Acorns Advisers, LLC | 975,055 | 0.41 | 49 | 0.00 | ||||
| 2025-08-11 | 13F | CFS Investment Advisory Services, LLC | 42,236 | 5.26 | 2 | 0.00 | ||||
| 2025-07-11 | 13F | Ridgeline Wealth, LLC | 0 | -100.00 | 0 | |||||
| 2025-08-11 | 13F | Bulltick Wealth Management, LLC | 133,739 | -32.49 | 6,782 | -32.49 | ||||
| 2025-07-22 | 13F | Steele Capital Management, Inc. | 246,515 | -0.35 | 12,501 | -0.33 | ||||
| 2025-06-24 | NP | Two Roads Shared Trust - Foundations Dynamic Income ETF | 11,868 | -11.14 | 602 | -11.09 | ||||
| 2025-08-12 | 13F | AlphaCore Capital LLC | 14,204 | -11.11 | 720 | -11.11 | ||||
| 2025-07-11 | 13F | Seacrest Wealth Management, Llc | 4,021 | 0.00 | 204 | 0.00 | ||||
| 2025-07-30 | 13F | Whittier Trust Co | 17,521 | -22.03 | 888 | -22.04 | ||||
| 2025-08-06 | 13F | ZEGA Investments, LLC | 32,653 | 41.46 | 1,656 | 41.45 | ||||
| 2025-07-24 | 13F | Comprehensive Money Management Services LLC | 52,004 | 6.58 | 2,637 | 6.63 | ||||
| 2025-08-15 | 13F | Equitable Holdings, Inc. | 14,342 | 42.10 | 727 | 42.27 | ||||
| 2025-04-23 | 13F | Fourth Dimension Wealth, LLC | 0 | -100.00 | 0 | |||||
| 2025-07-23 | 13F | Armstrong, Fleming & Moore, Inc | 0 | -100.00 | 0 | |||||
| 2025-08-13 | 13F | Renaissance Technologies Llc | 0 | -100.00 | 0 | |||||
| 2025-07-22 | 13F | Rochester Wealth Strategies, LLC | 114,317 | -11.76 | 5,797 | -11.74 | ||||
| 2025-07-09 | 13F | Krilogy Financial LLC | 37,645 | 1,909 | ||||||
| 2025-07-30 | 13F | Lionsbridge Wealth Management LLC | 32,379 | -6.32 | 1,642 | -6.34 | ||||
| 2025-04-17 | 13F | Western Pacific Wealth Management, LP | 0 | -100.00 | 0 | |||||
| 2025-05-12 | 13F | C2P Capital Advisory Group, LLC d.b.a. Prosperity Capital Advisors | 0 | -100.00 | 0 | -100.00 | ||||
| 2025-07-07 | 13F | New Capital Management LP | 9,995 | -14.84 | 507 | -14.96 | ||||
| 2025-08-06 | 13F | Round Rock Advisors, LLC | 15,800 | 4.93 | 801 | 4.98 | ||||
| 2025-08-14 | 13F | Ariadne Wealth Management, LP | 122,394 | -5.61 | 6,195 | -5.46 | ||||
| 2025-07-15 | 13F | Mather Group, Llc. | 0 | -100.00 | 0 | |||||
| 2025-08-01 | 13F | Gwn Securities Inc. | 194,733 | 146.69 | 9,877 | 146.80 | ||||
| 2025-07-07 | 13F | Peterson Wealth Advisors, LLC | 48,187 | -5.82 | 2,444 | -5.49 | ||||
| 2025-08-05 | 13F | Carolinas Wealth Consulting Llc | 0 | -100.00 | 0 | |||||
| 2025-08-05 | 13F | Sigma Planning Corp | 62,337 | 31.73 | 3,161 | 31.76 | ||||
| 2025-07-25 | 13F | We Are One Seven, LLC | 114,636 | -12.43 | 5,813 | -12.40 | ||||
| 2025-07-15 | 13F | Pine Haven Investment Counsel, Inc | 8,129 | -13.75 | 412 | -13.63 | ||||
| 2025-08-12 | 13F | Winnow Wealth Llc | 0 | -100.00 | 0 | -100.00 | ||||
| 2025-08-13 | 13F | Jones Financial Companies Lllp | 27,815 | 21.53 | 1,410 | 21.66 | ||||
| 2025-07-16 | 13F | Signaturefd, Llc | 265,926 | 2.24 | 13,485 | 2.26 | ||||
| 2025-08-07 | 13F | BOK Financial Private Wealth, Inc. | 86,076 | -1.86 | 4,365 | -1.84 | ||||
| 2025-04-22 | 13F | Synergy Financial Management, LLC | 0 | -100.00 | 0 | |||||
| 2025-08-07 | 13F | Tilson Financial Group, Inc. | 11,430 | 1.16 | 1 | |||||
| 2025-05-06 | 13F | WT Wealth Management | 68,144 | 97.89 | 3,455 | 98.96 | ||||
| 2025-04-17 | 13F | Missouri Trust & Investment Co | 0 | -100.00 | 0 | |||||
| 2025-07-28 | 13F | Ckw Financial Group | 1,282 | 0.00 | 0 | |||||
| 2025-07-31 | 13F | Moloney Securities Asset Management, LLC | 53,038 | 14.05 | 2,690 | 14.09 | ||||
| 2025-08-07 | 13F | Panoramic Investment Advisors, Llc | 79,084 | 63.19 | 4,010 | 63.27 | ||||
| 2025-07-30 | 13F | Klingman & Associates, LLC | 6,723 | 0.00 | 341 | 0.00 |