Basic Stats
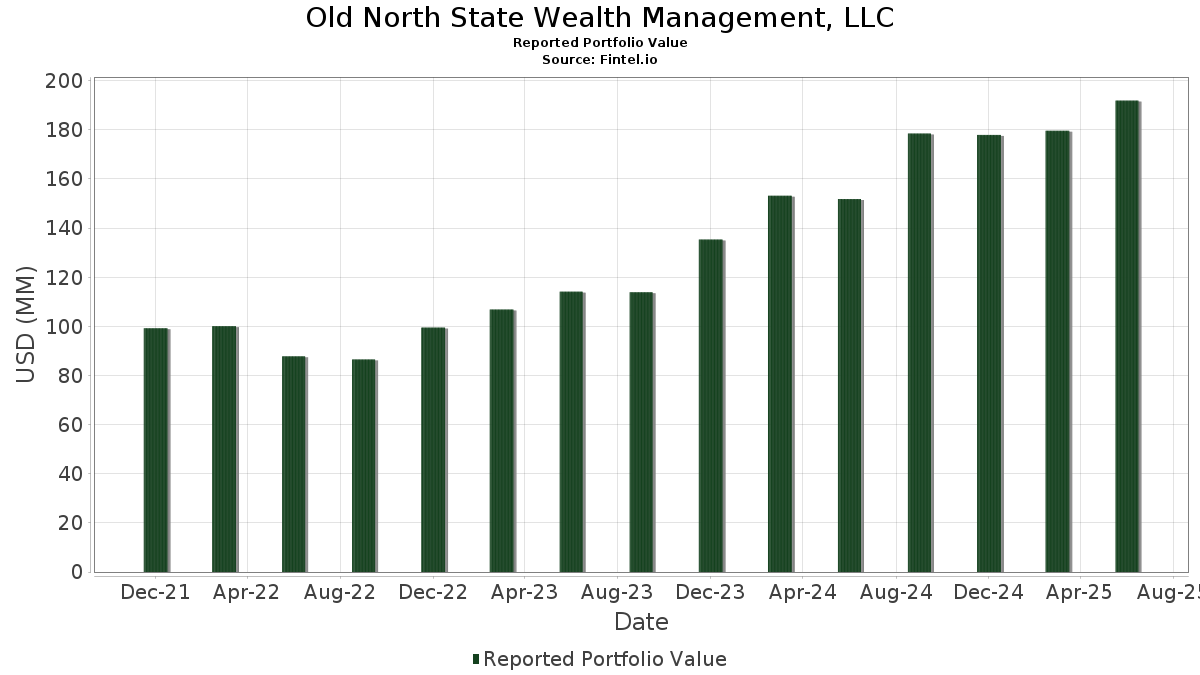
| Portfolio Value | $ 191,922,226 |
| Current Positions | 120 |
Latest Holdings, Performance, AUM (from 13F, 13D)
Old North State Wealth Management, LLC has disclosed 120 total holdings in their latest SEC filings. Most recent portfolio value is calculated to be $ 191,922,226 USD. Actual Assets Under Management (AUM) is this value plus cash (which is not disclosed). Old North State Wealth Management, LLC’s top holdings are Berkshire Hathaway Inc. (US:BRK.B) , Amazon.com, Inc. (US:AMZN) , CVS Health Corporation (US:CVS) , Apple Inc. (US:AAPL) , and Gilead Sciences, Inc. (US:GILD) . Old North State Wealth Management, LLC’s new positions include GE Vernova Inc. (US:GEV) , Vanguard Index Funds - Vanguard Small-Cap Value ETF (US:VBR) , Abbott Laboratories (US:ABT) , EOG Resources, Inc. (US:EOG) , and UnitedHealth Group Incorporated (US:UNH) .
Top Increases This Quarter
We use the change in the portfolio allocation because this is the most meaningful metric. Changes can be due to trades or changes in share prices.
| Security | Shares (MM) |
Value (MM$) |
Portfolio % | ΔPortfolio % |
|---|---|---|---|---|
| 0.04 | 5.62 | 2.9271 | 1.1129 | |
| 0.00 | 1.65 | 0.8572 | 0.5491 | |
| 0.00 | 0.75 | 0.3906 | 0.3906 | |
| 0.01 | 3.89 | 2.0271 | 0.3854 | |
| 0.01 | 3.11 | 1.6224 | 0.3641 | |
| 0.04 | 8.08 | 4.2105 | 0.3492 | |
| 0.02 | 4.39 | 2.2871 | 0.3218 | |
| 0.02 | 4.48 | 2.3360 | 0.3198 | |
| 0.01 | 2.13 | 1.1112 | 0.2631 | |
| 0.02 | 3.80 | 1.9789 | 0.2301 |
Top Decreases This Quarter
We use the change in the portfolio allocation because this is the most meaningful metric. Changes can be due to trades or changes in share prices.
| Security | Shares (MM) |
Value (MM$) |
Portfolio % | ΔPortfolio % |
|---|---|---|---|---|
| 0.03 | 12.30 | 6.4069 | -1.5701 | |
| 0.02 | 1.38 | 0.7191 | -0.7907 | |
| 0.02 | 3.78 | 1.9711 | -0.6478 | |
| 0.01 | 1.36 | 0.7062 | -0.5335 | |
| 0.04 | 4.99 | 2.6006 | -0.3394 | |
| 0.06 | 6.21 | 3.2344 | -0.3197 | |
| 0.03 | 6.42 | 3.3462 | -0.2842 | |
| 0.29 | 5.22 | 2.7222 | -0.2203 | |
| 0.08 | 3.45 | 1.7988 | -0.1930 | |
| 0.02 | 2.54 | 1.3235 | -0.1927 |
13F and Fund Filings
This form was filed on 2025-07-16 for the reporting period 2025-06-30. Click the link icon to see the full transaction history.
Upgrade to unlock premium data and export to Excel ![]() .
.
| Security | Type | Avg Share Price | Shares (MM) |
ΔShares (%) |
ΔShares (%) |
Value ($MM) |
Portfolio (%) |
ΔPortfolio (%) |
|
|---|---|---|---|---|---|---|---|---|---|
| BRK.B / Berkshire Hathaway Inc. | 0.03 | -5.92 | 12.30 | -14.19 | 6.4069 | -1.5701 | |||
| AMZN / Amazon.com, Inc. | 0.04 | 1.03 | 8.08 | 16.49 | 4.2105 | 0.3492 | |||
| CVS / CVS Health Corporation | 0.10 | 2.37 | 6.69 | 4.22 | 3.4853 | -0.0875 | |||
| AAPL / Apple Inc. | 0.03 | 6.61 | 6.42 | -1.52 | 3.3462 | -0.2842 | |||
| GILD / Gilead Sciences, Inc. | 0.06 | -1.73 | 6.21 | -2.77 | 3.2344 | -0.3197 | |||
| F / Ford Motor Company | 0.54 | -2.92 | 5.90 | 5.02 | 3.0767 | -0.0531 | |||
| NVDA / NVIDIA Corporation | 0.04 | 18.24 | 5.62 | 72.35 | 2.9271 | 1.1129 | |||
| ET / Energy Transfer LP - Limited Partnership | 0.29 | 1.34 | 5.22 | -1.15 | 2.7222 | -0.2203 | |||
| MHO / M/I Homes, Inc. | 0.04 | -3.76 | 4.99 | -5.49 | 2.6006 | -0.3394 | |||
| FMC / FMC Corporation | 0.12 | 5.09 | 4.84 | 4.04 | 2.5237 | -0.0678 | |||
| BA / The Boeing Company | 0.02 | 0.75 | 4.48 | 23.77 | 2.3360 | 0.3198 | |||
| VEEV / Veeva Systems Inc. | 0.02 | 0.00 | 4.39 | 24.33 | 2.2871 | 0.3218 | |||
| ENB / Enbridge Inc. | 0.09 | -1.74 | 4.24 | 0.50 | 2.2111 | -0.1397 | |||
| SWK / Stanley Black & Decker, Inc. | 0.06 | 27.19 | 4.06 | 12.01 | 2.1136 | 0.0978 | |||
| MSFT / Microsoft Corporation | 0.01 | -0.46 | 3.89 | 31.91 | 2.0271 | 0.3854 | |||
| HII / Huntington Ingalls Industries, Inc. | 0.02 | 2.15 | 3.80 | 20.89 | 1.9789 | 0.2301 | |||
| BDX / Becton, Dickinson and Company | 0.02 | 6.92 | 3.78 | -19.58 | 1.9711 | -0.6478 | |||
| VTV / Vanguard Index Funds - Vanguard Value ETF | 0.02 | 3.88 | 3.72 | 6.28 | 1.9394 | -0.0101 | |||
| MDT / Medtronic plc | 0.04 | 4.70 | 3.60 | 1.55 | 1.8741 | -0.0971 | |||
| SW / Smurfit Westrock Plc | 0.08 | 0.75 | 3.45 | -3.52 | 1.7988 | -0.1930 | |||
| PYPL / PayPal Holdings, Inc. | 0.04 | 1.66 | 3.30 | 15.81 | 1.7183 | 0.1329 | |||
| DUK / Duke Energy Corporation | 0.03 | 4.19 | 3.28 | 0.77 | 1.7084 | -0.1025 | |||
| TSM / Taiwan Semiconductor Manufacturing Company Limited - Depositary Receipt (Common Stock) | 0.01 | 0.96 | 3.11 | 37.74 | 1.6224 | 0.3641 | |||
| VB / Vanguard Index Funds - Vanguard Small-Cap ETF | 0.01 | -4.82 | 3.07 | 1.72 | 1.5998 | -0.0806 | |||
| BWA / BorgWarner Inc. | 0.09 | 1.49 | 2.96 | 18.58 | 1.5433 | 0.1530 | |||
| LYB / LyondellBasell Industries N.V. | 0.05 | 16.47 | 2.65 | -4.30 | 1.3788 | -0.1605 | |||
| KHC / The Kraft Heinz Company | 0.10 | 13.18 | 2.60 | -3.98 | 1.3569 | -0.1528 | |||
| BIIB / Biogen Inc. | 0.02 | 1.61 | 2.54 | -6.72 | 1.3235 | -0.1927 | |||
| PFE / Pfizer Inc. | 0.10 | 14.13 | 2.44 | 9.16 | 1.2727 | 0.0272 | |||
| KMI / Kinder Morgan, Inc. | 0.08 | 3.85 | 2.31 | 6.98 | 1.2057 | 0.0020 | |||
| GOOGL / Alphabet Inc. | 0.01 | 22.82 | 2.13 | 39.99 | 1.1112 | 0.2631 | |||
| GLW / Corning Incorporated | 0.04 | 0.54 | 2.12 | 15.47 | 1.1051 | 0.0829 | |||
| VZ / Verizon Communications Inc. | 0.05 | 5.40 | 2.02 | 0.55 | 1.0515 | -0.0658 | |||
| ALB / Albemarle Corporation | 0.03 | 17.68 | 1.86 | 2.36 | 0.9714 | -0.0423 | |||
| RTX / RTX Corporation | 0.01 | 0.47 | 1.75 | 10.72 | 0.9096 | 0.0322 | |||
| VTI / Vanguard Index Funds - Vanguard Total Stock Market ETF | 0.01 | 14.52 | 1.70 | 26.64 | 0.8872 | 0.1387 | |||
| OMC / Omnicom Group Inc. | 0.02 | 7.28 | 1.67 | -6.92 | 0.8688 | -0.1283 | |||
| VOO / Vanguard Index Funds - Vanguard S&P 500 ETF | 0.00 | 169.37 | 1.65 | 197.47 | 0.8572 | 0.5491 | |||
| MAR / Marriott International, Inc. | 0.01 | 0.02 | 1.54 | 14.71 | 0.8047 | 0.0552 | |||
| VIG / Vanguard Specialized Funds - Vanguard Dividend Appreciation ETF | 0.01 | -0.67 | 1.52 | 4.81 | 0.7942 | -0.0154 | |||
| MRK / Merck & Co., Inc. | 0.02 | 8.21 | 1.45 | -4.54 | 0.7568 | -0.0904 | |||
| VTR / Ventas, Inc. | 0.02 | -44.61 | 1.38 | -49.12 | 0.7191 | -0.7907 | |||
| XOM / Exxon Mobil Corporation | 0.01 | -32.88 | 1.36 | -39.16 | 0.7062 | -0.5335 | |||
| THO / THOR Industries, Inc. | 0.01 | 12.14 | 1.33 | 31.36 | 0.6923 | 0.1291 | |||
| DES / WisdomTree Trust - WisdomTree U.S. SmallCap Dividend Fund | 0.04 | -0.19 | 1.33 | -0.75 | 0.6920 | -0.0533 | |||
| JPM / JPMorgan Chase & Co. | 0.00 | 9.96 | 0.96 | 30.00 | 0.5014 | 0.0891 | |||
| JNJ / Johnson & Johnson | 0.01 | -7.29 | 0.92 | -14.59 | 0.4790 | -0.1201 | |||
| VXUS / Vanguard STAR Funds - Vanguard Total International Stock ETF | 0.01 | 0.72 | 0.83 | 11.99 | 0.4333 | 0.0202 | |||
| GSLC / Goldman Sachs ETF Trust - Goldman Sachs ActiveBeta U.S. Large Cap Equity ETF | 0.01 | 0.21 | 0.82 | 10.53 | 0.4270 | 0.0142 | |||
| META / Meta Platforms, Inc. | 0.00 | 29.27 | 0.82 | 65.52 | 0.4256 | 0.1510 | |||
| ICSH / iShares U.S. ETF Trust - iShares Ultra Short Duration Bond Active ETF | 0.02 | -19.44 | 0.79 | -19.36 | 0.4101 | -0.1337 | |||
| IWB / iShares Trust - iShares Russell 1000 ETF | 0.00 | 0.27 | 0.77 | 10.98 | 0.4004 | 0.0150 | |||
| HSY / The Hershey Company | 0.00 | 18.78 | 0.77 | 15.21 | 0.3988 | 0.0289 | |||
| GEV / GE Vernova Inc. | 0.00 | 0.75 | 0.3906 | 0.3906 | |||||
| GIS / General Mills, Inc. | 0.01 | 19.11 | 0.72 | 3.28 | 0.3775 | -0.0133 | |||
| VTRS / Viatris Inc. | 0.08 | -4.14 | 0.70 | -1.68 | 0.3669 | -0.0319 | |||
| CTVA / Corteva, Inc. | 0.01 | 9.33 | 0.67 | 29.38 | 0.3468 | 0.0605 | |||
| NOC / Northrop Grumman Corporation | 0.00 | 2.39 | 0.65 | 0.31 | 0.3369 | -0.0219 | |||
| EPD / Enterprise Products Partners L.P. - Limited Partnership | 0.02 | 1.58 | 0.58 | -7.74 | 0.3047 | -0.0481 | |||
| VOE / Vanguard Index Funds - Vanguard Mid-Cap Value ETF | 0.00 | 7.55 | 0.58 | 10.19 | 0.3045 | 0.0091 | |||
| PEP / PepsiCo, Inc. | 0.00 | 10.56 | 0.58 | -2.67 | 0.3038 | -0.0299 | |||
| ADBE / Adobe Inc. | 0.00 | -0.40 | 0.58 | 0.52 | 0.3030 | -0.0192 | |||
| CVX / Chevron Corporation | 0.00 | 5.98 | 0.57 | -9.32 | 0.2993 | -0.0533 | |||
| IYW / iShares Trust - iShares U.S. Technology ETF | 0.00 | -1.85 | 0.57 | 21.23 | 0.2979 | 0.0352 | |||
| NXPI / NXP Semiconductors N.V. | 0.00 | 3.47 | 0.57 | 19.08 | 0.2963 | 0.0302 | |||
| GSK / GSK plc - Depositary Receipt (Common Stock) | 0.01 | 2.95 | 0.57 | 1.98 | 0.2958 | -0.0138 | |||
| TT / Trane Technologies plc | 0.00 | 5.18 | 0.56 | 36.50 | 0.2924 | 0.0634 | |||
| TSLA / Tesla, Inc. | 0.00 | 11.72 | 0.55 | 37.13 | 0.2889 | 0.0635 | |||
| GE / General Electric Company | 0.00 | 1.89 | 0.54 | 31.23 | 0.2825 | 0.0523 | |||
| VOT / Vanguard Index Funds - Vanguard Mid-Cap Growth ETF | 0.00 | 11.62 | 0.53 | 29.58 | 0.2767 | 0.0487 | |||
| BUD / Anheuser-Busch InBev SA/NV - Depositary Receipt (Common Stock) | 0.01 | -4.35 | 0.51 | 6.88 | 0.2674 | 0.0001 | |||
| AVGO / Broadcom Inc. | 0.00 | 27.18 | 0.50 | 109.75 | 0.2583 | 0.1264 | |||
| LMT / Lockheed Martin Corporation | 0.00 | 2.73 | 0.49 | 6.52 | 0.2555 | -0.0010 | |||
| AJG / Arthur J. Gallagher & Co. | 0.00 | 14.47 | 0.48 | 6.26 | 0.2476 | -0.0015 | |||
| FE / FirstEnergy Corp. | 0.01 | 1.76 | 0.45 | 1.57 | 0.2366 | -0.0128 | |||
| DTE / DTE Energy Company | 0.00 | 0.74 | 0.45 | -3.41 | 0.2361 | -0.0254 | |||
| ES / Eversource Energy | 0.01 | 3.86 | 0.45 | 6.38 | 0.2348 | -0.0010 | |||
| BMY / Bristol-Myers Squibb Company | 0.01 | 4.01 | 0.45 | -21.06 | 0.2329 | -0.0821 | |||
| PHIN / PHINIA Inc. | 0.01 | 1.62 | 0.44 | 6.75 | 0.2309 | -0.0007 | |||
| SCHB / Schwab Strategic Trust - Schwab U.S. Broad Market ETF | 0.02 | 1.10 | 0.42 | 11.97 | 0.2198 | 0.0100 | |||
| NFLX / Netflix, Inc. | 0.00 | 20.00 | 0.40 | 72.10 | 0.2093 | 0.0795 | |||
| NUE / Nucor Corporation | 0.00 | 0.33 | 0.40 | 7.90 | 0.2067 | 0.0022 | |||
| BAC / Bank of America Corporation | 0.01 | 0.55 | 0.39 | 14.29 | 0.2044 | 0.0129 | |||
| IPG / The Interpublic Group of Companies, Inc. | 0.02 | 9.02 | 0.38 | -1.80 | 0.1989 | -0.0173 | |||
| SPY / SPDR S&P 500 ETF | 0.00 | 48.77 | 0.38 | 64.19 | 0.1961 | 0.0681 | |||
| VBR / Vanguard Index Funds - Vanguard Small-Cap Value ETF | 0.00 | 0.37 | 0.1913 | 0.1913 | |||||
| MA / Mastercard Incorporated | 0.00 | 2.38 | 0.36 | 4.91 | 0.1895 | -0.0032 | |||
| AXSM / Axsome Therapeutics, Inc. | 0.00 | 0.00 | 0.36 | -10.45 | 0.1877 | -0.0363 | |||
| VONG / Vanguard Scottsdale Funds - Vanguard Russell 1000 Growth ETF | 0.00 | 0.09 | 0.35 | 18.06 | 0.1841 | 0.0172 | |||
| WEC / WEC Energy Group, Inc. | 0.00 | 4.10 | 0.35 | -0.28 | 0.1836 | -0.0134 | |||
| BLD / TopBuild Corp. | 0.00 | 0.35 | 0.1822 | 0.1822 | |||||
| SCHD / Schwab Strategic Trust - Schwab U.S. Dividend Equity ETF | 0.01 | -1.66 | 0.35 | -7.01 | 0.1802 | -0.0264 | |||
| TMO / Thermo Fisher Scientific Inc. | 0.00 | 24.07 | 0.33 | 1.24 | 0.1702 | -0.0096 | |||
| CTRA / Coterra Energy Inc. | 0.01 | 4.67 | 0.32 | -8.02 | 0.1676 | -0.0272 | |||
| PLTR / Palantir Technologies Inc. | 0.00 | -22.07 | 0.32 | 25.79 | 0.1655 | 0.0250 | |||
| SLB / Schlumberger Limited | 0.01 | 24.06 | 0.31 | 0.32 | 0.1622 | -0.0106 | |||
| WHR / Whirlpool Corporation | 0.00 | 20.04 | 0.30 | 35.14 | 0.1563 | 0.0327 | |||
| T / AT&T Inc. | 0.01 | -11.71 | 0.30 | -9.73 | 0.1550 | -0.0283 | |||
| QQQ / Invesco QQQ Trust, Series 1 | 0.00 | 3.30 | 0.30 | 21.90 | 0.1537 | 0.0185 | |||
| LOW / Lowe's Companies, Inc. | 0.00 | 13.44 | 0.28 | 8.08 | 0.1466 | 0.0015 | |||
| XHB / SPDR Series Trust - SPDR S&P Homebuilders ETF | 0.00 | 0.15 | 0.27 | 1.89 | 0.1411 | -0.0069 | |||
| TD / The Toronto-Dominion Bank | 0.00 | -9.62 | 0.27 | 10.88 | 0.1382 | 0.0049 | |||
| SDY / SPDR Series Trust - SPDR S&P Dividend ETF | 0.00 | 0.69 | 0.26 | 0.78 | 0.1350 | -0.0082 | |||
| KMB / Kimberly-Clark Corporation | 0.00 | 10.36 | 0.26 | 0.00 | 0.1346 | -0.0091 | |||
| IVV / iShares Trust - iShares Core S&P 500 ETF | 0.00 | 0.50 | 0.25 | 11.01 | 0.1313 | 0.0047 | |||
| COST / Costco Wholesale Corporation | 0.00 | 0.00 | 0.25 | 5.15 | 0.1277 | -0.0025 | |||
| SPGP / Invesco Exchange-Traded Fund Trust - Invesco S&P 500 GARP ETF | 0.00 | 0.36 | 0.24 | 8.04 | 0.1265 | 0.0016 | |||
| IR / Ingersoll Rand Inc. | 0.00 | -2.67 | 0.24 | 1.27 | 0.1247 | -0.0070 | |||
| CRM / Salesforce, Inc. | 0.00 | 2.01 | 0.24 | 3.96 | 0.1232 | -0.0036 | |||
| WMT / Walmart Inc. | 0.00 | 0.24 | 0.1229 | 0.1229 | |||||
| ABT / Abbott Laboratories | 0.00 | 0.23 | 0.1205 | 0.1205 | |||||
| COKE / Coca-Cola Consolidated, Inc. | 0.00 | 905.08 | 0.22 | -16.92 | 0.1152 | -0.0333 | |||
| VOOV / Vanguard Admiral Funds - Vanguard S&P 500 Value ETF | 0.00 | 0.44 | 0.22 | 2.84 | 0.1134 | -0.0043 | |||
| HON / Honeywell International Inc. | 0.00 | 0.22 | 0.1134 | 0.1134 | |||||
| OXY / Occidental Petroleum Corporation | 0.01 | 15.72 | 0.22 | -1.36 | 0.1131 | -0.0096 | |||
| VO / Vanguard Index Funds - Vanguard Mid-Cap ETF | 0.00 | 0.22 | 0.1121 | 0.1121 | |||||
| EOG / EOG Resources, Inc. | 0.00 | 0.21 | 0.1109 | 0.1109 | |||||
| UNH / UnitedHealth Group Incorporated | 0.00 | 0.21 | 0.1068 | 0.1068 | |||||
| IBM / International Business Machines Corporation | 0.00 | 0.20 | 0.1056 | 0.1056 | |||||
| TRI N / Thomson Reuters Corporation | 0.00 | 0.20 | 0.1054 | 0.1054 | |||||
| CI / The Cigna Group | 0.00 | -100.00 | 0.00 | 0.0000 |