Basic Stats
| Institutional Owners | 173 total, 173 long only, 0 short only, 0 long/short - change of 4.85% MRQ |
| Average Portfolio Allocation | 0.3908 % - change of 20.14% MRQ |
| Institutional Shares (Long) | 33,789,586 (ex 13D/G) - change of 1.13MM shares 3.46% MRQ |
| Institutional Value (Long) | $ 710,594 USD ($1000) |
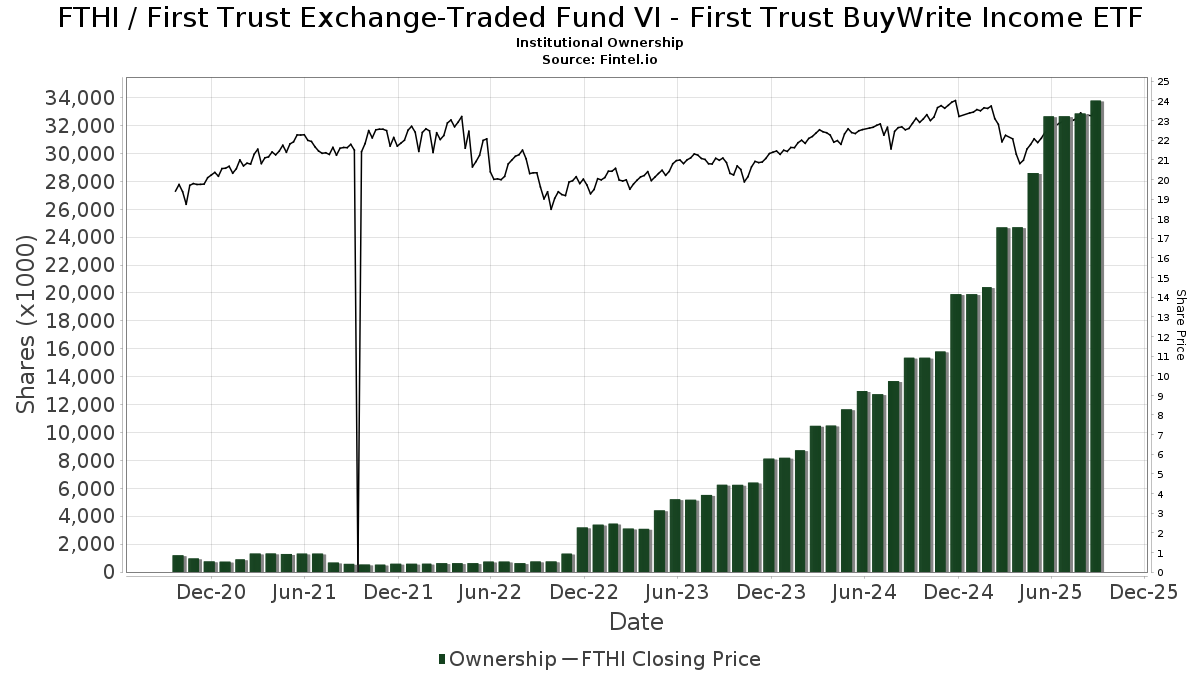
Institutional Ownership and Shareholders
First Trust Exchange-Traded Fund VI - First Trust BuyWrite Income ETF (US:FTHI) has 173 institutional owners and shareholders that have filed 13D/G or 13F forms with the Securities Exchange Commission (SEC). These institutions hold a total of 33,789,586 shares. Largest shareholders include LPL Financial LLC, Wells Fargo & Company/mn, Envestnet Asset Management Inc, Raymond James Financial Inc, D.a. Davidson & Co., Janney Montgomery Scott LLC, Royal Bank Of Canada, Cetera Investment Advisers, Stifel Financial Corp, and Cambridge Investment Research Advisors, Inc. .
First Trust Exchange-Traded Fund VI - First Trust BuyWrite Income ETF (NasdaqGM:FTHI) institutional ownership structure shows current positions in the company by institutions and funds, as well as latest changes in position size. Major shareholders can include individual investors, mutual funds, hedge funds, or institutions. The Schedule 13D indicates that the investor holds (or held) more than 5% of the company and intends (or intended) to actively pursue a change in business strategy. Schedule 13G indicates a passive investment of over 5%.
The share price as of September 5, 2025 is 23.39 / share. Previously, on September 9, 2024, the share price was 22.42 / share. This represents an increase of 4.33% over that period.
Fund Sentiment Score
The Fund Sentiment Score (fka Ownership Accumulation Score) finds the stocks that are being most bought by funds. It is the result of a sophisticated, multi-factor quantitative model that identifies companies with the highest levels of institutional accumulation. The scoring model uses a combination of the total increase in disclosed owners, the changes in portfolio allocations in those owners and other metrics. The number ranges from 0 to 100, with higher numbers indicating a higher level of accumulation to its peers, and 50 being the average.
Update Frequency: Daily
See Ownership Explorer, which provides a list of highest-ranking companies.
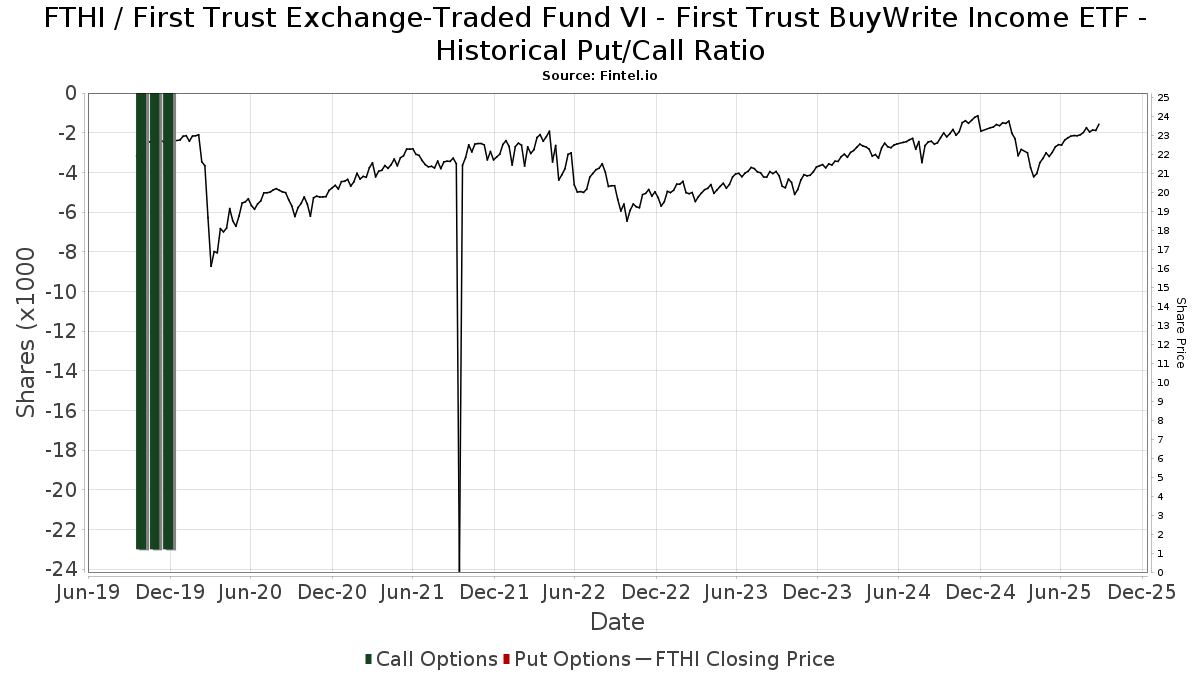
Institutional Put/Call Ratio
In addition to reporting standard equity and debt issues, institutions with more than 100MM assets under management must also disclose their put and call option holdings. Since put options generally indicate negative sentiment, and call options indicate positive sentiment, we can get a sense of the overall institutional sentiment by plotting the ratio of puts to calls. The chart to the right plots the historical put/call ratio for this instrument.
Using Put/Call Ratio as an indicator of investor sentiment overcomes one of the key deficiencies of using total institutional ownership, which is that a significant amount of assets under management are invested passively to track indices. Passively-managed funds do not typically buy options, so the put/call ratio indicator more closely tracks the sentiment of actively-managed funds.
13D/G Filings
We present 13D/G filings separately from the 13F filings because of the different treatement by the SEC. 13D/G filings can be filed by groups of investors (with one leading), whereas 13F filings cannot. This results in situations where an investor may file a 13D/G reporting one value for the total shares (representing all the shares owned by the investor group), but then file a 13F reporting a different value for the total shares (representing strictly their own ownership). This means that share ownership of 13D/G filings and 13F filings are oftentimes not directly comparable, so we present them separately.
Note: As of May 16, 2021, we no longer show owners that have not filed a 13D/G within the last year. Previously, we were showing the full history of 13D/G filings. In general, entities that are required to file 13D/G filings must file at least annually before submitting a closing filing. However, funds sometimes exit positions without submitting a closing filing (ie, they wind down), so displaying the full history sometimes resulted in confusion about the current ownership. To prevent confusion, we now only show ’current’ owners - that is - owners that have filed within the last year.
Upgrade to unlock premium data.
| File Date | Form | Investor | Prev Shares |
Latest Shares |
Δ Shares (Percent) |
Ownership (Percent) |
Δ Ownership (Percent) |
|
|---|---|---|---|---|---|---|---|---|
| 2025-07-23 | FIRST TRUST PORTFOLIOS LP | 16,143,864 | 15,663,087 | -2.98 | 26.12 | -6.68 |
13F and NPORT Filings
Detail on 13F filings are free. Detail on NP filings require a premium membership. Green rows indicate new positions. Red rows indicate closed positions. Click the link icon to see the full transaction history.
Upgrade
to unlock premium data and export to Excel ![]() .
.
| File Date | Source | Investor | Type | Avg Price (Est) |
Shares | Δ Shares (%) |
Reported Value ($1000) |
Δ Value (%) |
Port Alloc (%) |
|
|---|---|---|---|---|---|---|---|---|---|---|
| 2025-08-11 | 13F | Perennial Investment Advisors, LLC | 113,774 | 2.39 | 2,600 | 7.04 | ||||
| 2025-08-14 | 13F | Treasure Coast Financial Planning | 24,802 | 13.15 | 567 | 18.16 | ||||
| 2025-07-07 | 13F | Thurston, Springer, Miller, Herd & Titak, Inc. | 2,900 | 7.41 | 66 | 11.86 | ||||
| 2025-05-15 | 13F/A | Orion Portfolio Solutions, LLC | 21,473 | 3,034.74 | 469 | 3,808.33 | ||||
| 2025-07-07 | 13F | Investors Research Corp | 398 | 0.00 | 9 | 12.50 | ||||
| 2025-08-12 | 13F | Integrated Advisors Network LLC | 20,480 | 468 | ||||||
| 2025-08-11 | 13F | Principal Securities, Inc. | 98,980 | 8.90 | 2,262 | 6.95 | ||||
| 2025-07-08 | 13F | Zrc Wealth Management, Llc | 187,621 | 0.75 | 4,287 | 5.33 | ||||
| 2025-08-05 | 13F | American Institute for Advanced Investment Management, LLP | 53,820 | -1.64 | 1,230 | 2.76 | ||||
| 2025-08-12 | 13F | Cornerstone Wealth Management, LLC | 34,468 | 47.14 | 788 | 53.71 | ||||
| 2025-07-16 | 13F | Perigon Wealth Management, LLC | 11,719 | -11.51 | 268 | -7.61 | ||||
| 2025-07-17 | 13F | Nelson, Van Denburg & Campbell Wealth Management Group, LLC | 67,364 | -7.24 | 1,539 | -3.02 | ||||
| 2025-08-04 | 13F | Assetmark, Inc | 0 | -100.00 | 0 | |||||
| 2025-08-29 | 13F | Centaurus Financial, Inc. | 14,004 | 146.46 | 0 | |||||
| 2025-08-12 | 13F | LPL Financial LLC | 6,790,859 | 3.53 | 155,171 | 8.22 | ||||
| 2025-08-18 | 13F | Geneos Wealth Management Inc. | 51,309 | 76.29 | 1,172 | 84.28 | ||||
| 2025-07-28 | 13F | RFG Advisory, LLC | 19,333 | -53.14 | 442 | -51.05 | ||||
| 2025-04-24 | 13F | Kraft, Davis & Associates, LLC | 0 | -100.00 | 0 | |||||
| 2025-08-04 | 13F | Merkkuri Wealth Advisors LLC | 98,843 | 6.95 | 2,259 | 11.78 | ||||
| 2025-08-15 | 13F | Fsb Premier Wealth Management, Inc. | 27,097 | 1.30 | 619 | 5.99 | ||||
| 2025-08-11 | 13F | Nations Financial Group Inc, /ia/ /adv | 36,915 | 8.88 | 844 | 13.77 | ||||
| 2025-08-05 | 13F | Dunhill Financial, LLC | 54,545 | -86.92 | 1,246 | -86.34 | ||||
| 2025-08-13 | 13F | Scotia Capital Inc. | 0 | -100.00 | 0 | |||||
| 2025-07-23 | 13F | RiverTree Advisors, LLC | 201,047 | 181.99 | 4,594 | 194.80 | ||||
| 2025-07-25 | NP | LALT - First Trust Multi-Strategy Alternative ETF | 0 | -100.00 | 0 | -100.00 | ||||
| 2025-08-06 | 13F | Commonwealth Equity Services, Llc | 641,994 | 10.47 | 15 | 16.67 | ||||
| 2025-08-01 | 13F | Pasadena Private Wealth, LLC | 19,850 | 0.00 | 454 | 4.62 | ||||
| 2025-07-28 | 13F | Davidson Trust Co | 88,484 | 4.82 | 2,022 | 9.54 | ||||
| 2025-08-14 | 13F | GWM Advisors LLC | 45,886 | 1.85 | 1,049 | 6.50 | ||||
| 2025-08-13 | 13F | VestGen Advisors, LLC | 14,723 | 0.59 | 336 | 5.33 | ||||
| 2025-07-16 | 13F | Novem Group | 11,216 | 256 | ||||||
| 2025-08-13 | 13F | Northwestern Mutual Wealth Management Co | 88,302 | 2.10 | 2,018 | 6.72 | ||||
| 2025-08-14 | 13F | Financial Advisory Service, Inc. | 11 | 0 | ||||||
| 2025-07-25 | 13F | Cwm, Llc | 310,505 | 22.92 | 7 | 40.00 | ||||
| 2025-08-14 | 13F | Old Mission Capital Llc | 133,235 | 1,216.42 | 3,044 | 1,277.38 | ||||
| 2025-07-15 | 13F | BKA Wealth Consulting, Inc. | 0 | -100.00 | 0 | |||||
| 2025-05-28 | 13F | Intrua Financial, LLC | 0 | -100.00 | 0 | |||||
| 2025-08-01 | 13F | Envestnet Asset Management Inc | 2,978,349 | -1.63 | 68,055 | 2.82 | ||||
| 2025-08-14 | 13F | Comerica Bank | 2,071 | 0.00 | 47 | 4.44 | ||||
| 2025-08-14 | 13F | Integrated Wealth Concepts LLC | 141,190 | 5.71 | 3,226 | 10.52 | ||||
| 2025-08-06 | 13F | Tradewinds, LLC. | 98,843 | 2,259 | ||||||
| 2025-08-08 | 13F | Compass Financial Services Inc | 563 | 2.36 | 13 | 0.00 | ||||
| 2025-07-21 | 13F | Ameritas Advisory Services, LLC | 233,868 | -14.01 | 5,344 | -14.44 | ||||
| 2025-07-25 | 13F | We Are One Seven, LLC | 0 | -100.00 | 0 | |||||
| 2025-08-14 | 13F | Advisor OS, LLC | 358,456 | 9.12 | 8,191 | 14.07 | ||||
| 2025-08-07 | 13F | Kestra Private Wealth Services, Llc | 61,766 | 35.52 | 1,411 | 41.67 | ||||
| 2025-08-12 | 13F | Global Retirement Partners, LLC | 3,279 | 0.00 | 75 | -2.63 | ||||
| 2025-08-08 | 13F | Capital Investment Advisory Services, LLC | 104,531 | 10.99 | 2,389 | 16.03 | ||||
| 2025-07-30 | 13F | Brookstone Capital Management | 42,281 | 4.07 | 966 | 8.78 | ||||
| 2025-08-14 | 13F | Arete Wealth Advisors, LLC | 0 | -100.00 | 0 | |||||
| 2025-08-08 | 13F | Foundations Investment Advisors, LLC | 12,914 | 1.97 | 295 | 6.88 | ||||
| 2025-07-14 | 13F | Main Line Retirement Advisors, LLC | 41,800 | 955 | ||||||
| 2025-07-29 | 13F | Balboa Wealth Partners | 51,443 | 1,175 | ||||||
| 2025-07-17 | 13F | Janney Montgomery Scott LLC | 786,087 | 13.44 | 18 | 13.33 | ||||
| 2025-08-14 | 13F | CoreCap Advisors, LLC | 4,549 | -10.51 | 104 | -7.21 | ||||
| 2025-08-14 | 13F | Stifel Financial Corp | 691,621 | 7.90 | 15,804 | 12.79 | ||||
| 2025-08-14 | 13F | Sequent Planning LLC | 58,004 | 2.47 | 1,325 | 7.11 | ||||
| 2025-08-18 | 13F | Arq Wealth Advisors, Llc | 117,263 | 0.00 | 2,563 | 0.00 | ||||
| 2025-08-04 | 13F | Atria Investments Llc | 0 | -100.00 | 0 | |||||
| 2025-07-31 | 13F | Anchor Capital Management Group Inc | 67,000 | 0.00 | 1,531 | 4.51 | ||||
| 2025-07-15 | 13F | LVZ Advisors, Inc. | 61,940 | 3.60 | 1,415 | 8.35 | ||||
| 2025-08-12 | 13F | Steward Partners Investment Advisory, Llc | 20,047 | 17.30 | 458 | 22.79 | ||||
| 2025-07-01 | 13F | Private Client Services, Llc | 15,483 | 49.19 | 354 | 56.19 | ||||
| 2025-08-15 | 13F | Morgan Stanley | 16,419 | -0.98 | 375 | 3.59 | ||||
| 2025-08-14 | 13F | Benjamin Edwards Inc | 37,723 | 13.54 | 862 | 18.60 | ||||
| 2025-07-31 | 13F | Oppenheimer & Co Inc | 25,556 | 62.41 | 584 | 69.97 | ||||
| 2025-07-09 | 13F | Channel Wealth Llc | 15,129 | 8.61 | 346 | 13.49 | ||||
| 2025-08-13 | 13F | Smith, Moore & Co. | 14,924 | -0.67 | 341 | 3.96 | ||||
| 2025-08-05 | 13F | Lord & Richards Wealth Management, LLC | 0 | -100.00 | 0 | |||||
| 2025-08-11 | 13F | Regal Investment Advisors LLC | 43,477 | 993 | ||||||
| 2025-08-01 | 13F | Ferguson Shapiro LLC | 9,178 | 210 | ||||||
| 2025-08-14 | 13F | UBS Group AG | 361 | 8 | ||||||
| 2025-05-16 | 13F/A | Kestra Investment Management, LLC | 0 | -100.00 | 0 | |||||
| 2025-07-24 | 13F | Cyndeo Wealth Partners, LLC | 16,497 | -23.76 | 377 | -20.34 | ||||
| 2025-07-30 | 13F | Insight Advisors, LLC/ PA | 19,716 | 0.87 | 451 | 5.39 | ||||
| 2025-07-30 | 13F | TFB Advisors LLC | 35,773 | -6.86 | 817 | -2.62 | ||||
| 2025-06-26 | NP | ATCAX - Anchor Risk Managed Credit Strategies Fund Advisor Class Shares | 67,000 | 0.00 | 1,486 | -4.07 | ||||
| 2025-08-04 | 13F | Integrity Alliance, Llc. | 0 | -100.00 | 0 | |||||
| 2025-07-30 | 13F | D.a. Davidson & Co. | 2,486,389 | 3.34 | 56,814 | 8.02 | ||||
| 2025-08-18 | 13F | Tyler-Stone Wealth Management | 16,326 | 2.33 | 373 | 7.18 | ||||
| 2025-07-14 | 13F | AdvisorNet Financial, Inc | 3,508 | 84.63 | 80 | 95.12 | ||||
| 2025-07-25 | 13F | Envestnet Portfolio Solutions, Inc. | 39,370 | -62.51 | 900 | -60.83 | ||||
| 2025-08-15 | 13F | Kestra Advisory Services, LLC | 81,802 | 21.96 | 1,869 | 27.49 | ||||
| 2025-08-08 | 13F | SBI Securities Co., Ltd. | 1,560 | -9.25 | 36 | -5.41 | ||||
| 2025-08-14 | 13F | Snowden Capital Advisors LLC | 219,632 | 0.81 | 5,019 | 5.38 | ||||
| 2025-07-29 | 13F | International Assets Investment Management, Llc | 37,497 | 0.87 | 857 | 5.42 | ||||
| 2025-08-08 | 13F | Cetera Investment Advisers | 698,676 | 0.94 | 15,965 | 5.51 | ||||
| 2025-08-25 | NP | FTBI - First Trust Balanced Income ETF | 25,929 | 592 | ||||||
| 2025-08-06 | 13F | Legacy Investment Solutions, LLC | 28,653 | 66.76 | 655 | 61.88 | ||||
| 2025-08-13 | 13F | WCG Wealth Advisors LLC | 24,515 | 560 | ||||||
| 2025-08-14 | 13F | Hilltop Holdings Inc. | 9,281 | 212 | ||||||
| 2025-08-05 | 13F | GPS Wealth Strategies Group, LLC | 8,337 | 8.81 | 191 | 13.77 | ||||
| 2025-07-22 | 13F | Wealthcare Advisory Partners LLC | 10,327 | 0.08 | 236 | 4.44 | ||||
| 2025-07-14 | 13F | GAMMA Investing LLC | 913 | 0.00 | 21 | 5.26 | ||||
| 2025-08-11 | 13F | Elequin Capital Lp | 126,702 | 2,895 | ||||||
| 2025-08-08 | 13F | Avantax Advisory Services, Inc. | 128,694 | -1.52 | 2,941 | 2.94 | ||||
| 2025-08-11 | 13F | Aptus Capital Advisors, LLC | 4,435 | 30.10 | 101 | 36.49 | ||||
| 2025-08-13 | 13F | Beacon Pointe Advisors, LLC | 61,563 | -5.12 | 1,407 | -0.85 | ||||
| 2025-08-11 | 13F | Core Wealth Partners LLC | 34,301 | 33.58 | 784 | 39.57 | ||||
| 2025-08-07 | 13F | PCG Wealth Advisors, LLC | 74,652 | -45.32 | 1,706 | -42.86 | ||||
| 2025-05-27 | NP | XFLX - FundX Flexible ETF | 183,480 | 134.00 | 4,011 | 119.85 | ||||
| 2025-07-22 | 13F | DAVENPORT & Co LLC | 10,957 | 250 | ||||||
| 2025-08-27 | 13F/A | Brinker Capital Investments, LLC | 21,198 | -1.28 | 484 | 3.20 | ||||
| 2025-08-14 | 13F | Jane Street Group, Llc | 68,849 | -18.44 | 1,573 | -14.74 | ||||
| 2025-08-06 | 13F | Golden State Wealth Management, LLC | 1,263 | -95.87 | 29 | -95.81 | ||||
| 2025-07-22 | 13F | Accel Wealth Management | 50,749 | -0.98 | 1,160 | 3.48 | ||||
| 2025-08-14 | 13F | Wiley Bros.-aintree Capital, Llc | 18,980 | 434 | ||||||
| 2025-08-11 | 13F | Western Wealth Management, LLC | 0 | -100.00 | 0 | -100.00 | ||||
| 2025-08-14 | 13F | Citadel Advisors Llc | 24,187 | 553 | ||||||
| 2025-07-07 | 13F | Insight Wealth Strategies, LLC | 13,441 | 1.14 | 306 | 5.17 | ||||
| 2025-08-11 | 13F | One Capital Management, LLC | 0 | -100.00 | 0 | |||||
| 2025-08-11 | 13F | Lowe Brockenbrough & Co Inc | 3,500 | 80 | ||||||
| 2025-04-09 | 13F | HBW Advisory Services LLC | 0 | -100.00 | 0 | -100.00 | ||||
| 2025-08-13 | 13F | Level Four Advisory Services, Llc | 17,110 | -44.74 | 391 | -42.31 | ||||
| 2025-07-25 | 13F | Valley Brook Capital Group, Inc. | 11,180 | 0.24 | 255 | 4.94 | ||||
| 2025-07-09 | 13F | Presidio Capital Management, LLC | 19,863 | 5.30 | 454 | 9.95 | ||||
| 2025-07-31 | 13F | Cambridge Investment Research Advisors, Inc. | 684,255 | 25.23 | 16 | 36.36 | ||||
| 2025-07-08 | 13F | Nbc Securities, Inc. | 1,669 | 2.02 | 0 | |||||
| 2025-08-14 | 13F | Bank Of America Corp /de/ | 1 | 0.00 | 0 | |||||
| 2025-07-29 | 13F | Private Trust Co Na | 10,353 | 10.69 | 237 | 15.69 | ||||
| 2025-08-12 | 13F | Jpmorgan Chase & Co | 0 | -100.00 | 0 | |||||
| 2025-07-25 | 13F | Atria Wealth Solutions, Inc. | 60,697 | -64.69 | 1,387 | -63.11 | ||||
| 2025-04-15 | 13F | Transform Wealth, LLC | 41,631 | 910 | ||||||
| 2025-07-28 | 13F | Harbour Investments, Inc. | 124,275 | -1.06 | 2,840 | 3.42 | ||||
| 2025-05-09 | 13F | GeoWealth Management, LLC | 0 | -100.00 | 0 | |||||
| 2025-07-23 | 13F | Castle Rock Wealth Management, LLC | 15,566 | -0.03 | 360 | 5.59 | ||||
| 2025-08-14 | 13F | Wells Fargo & Company/mn | 4,567,850 | 23.28 | 104,375 | 28.86 | ||||
| 2025-07-22 | 13F | Legacy CG, LLC | 323,505 | -55.97 | 7,392 | -53.98 | ||||
| 2025-08-12 | 13F | Gladstone Institutional Advisory LLC | 15,629 | -17.48 | 357 | -13.77 | ||||
| 2025-08-06 | 13F | Moors & Cabot, Inc. | 9,050 | 207 | ||||||
| 2025-08-14 | 13F | Raymond James Financial Inc | 2,769,271 | -9.79 | 63,278 | -5.71 | ||||
| 2025-08-14 | 13F | Susquehanna International Group, Llp | 48,411 | -53.06 | 1,106 | -50.93 | ||||
| 2025-07-29 | 13F | Stratos Wealth Partners, LTD. | 0 | -100.00 | 0 | |||||
| 2025-08-06 | 13F | Prospera Financial Services Inc | 133,339 | 18.36 | 3,047 | 23.76 | ||||
| 2025-08-12 | 13F | Change Path, LLC | 293,875 | -0.79 | 6,715 | 3.71 | ||||
| 2025-07-23 | 13F | Sachetta, LLC | 12,870 | 294 | ||||||
| 2025-07-11 | 13F | Quad-Cities Investment Group, LLC | 50,685 | 8.11 | 1,158 | 13.09 | ||||
| 2025-08-08 | 13F | Mjp Associates Inc /adv | 387,576 | 17.99 | 8,856 | 23.34 | ||||
| 2025-07-28 | 13F | BRYN MAWR TRUST Co | 1,202 | -3.45 | 27 | 0.00 | ||||
| 2025-08-04 | 13F | IFG Advisory, LLC | 20,543 | 469 | ||||||
| 2025-08-13 | 13F | Capital Analysts, Inc. | 13,022 | 7.47 | 0 | |||||
| 2025-08-13 | 13F | StoneX Group Inc. | 23,092 | 0.00 | 528 | 4.56 | ||||
| 2025-04-29 | 13F | Onyx Bridge Wealth Group LLC | 0 | -100.00 | 0 | |||||
| 2025-07-24 | 13F | IFP Advisors, Inc | 24,610 | -3.00 | 562 | 1.44 | ||||
| 2025-08-12 | 13F | Richmond Investment Services, LLC | 14,666 | 335 | ||||||
| 2025-05-27 | NP | XRLX - FundX Conservative ETF | 83,551 | 178.50 | 1,826 | 161.60 | ||||
| 2025-07-18 | 13F | Truist Financial Corp | 94,565 | 11.80 | 2,161 | 16.88 | ||||
| 2025-07-11 | 13F | Farther Finance Advisors, LLC | 71,644 | 1,637 | ||||||
| 2025-07-30 | 13F | BlueChip Wealth Advisors LLC | 19,180 | 0.00 | 438 | 4.53 | ||||
| 2025-08-14 | 13F | Mariner, LLC | 94,321 | -63.06 | 2,155 | -61.39 | ||||
| 2025-08-14 | 13F | Marshall Investment Management, Llc | 0 | -100.00 | 0 | |||||
| 2025-07-23 | 13F | Gentry Private Wealth, Llc | 31,258 | 2.58 | 714 | 7.21 | ||||
| 2025-09-04 | 13F/A | Advisor Group Holdings, Inc. | 386,332 | 12.25 | 8,826 | 17.30 | ||||
| 2025-08-13 | 13F | Gateway Wealth Partners, LLC | 10,262 | 0.00 | 234 | 4.46 | ||||
| 2025-08-05 | 13F | Sigma Planning Corp | 0 | -100.00 | 0 | |||||
| 2025-08-06 | 13F | AE Wealth Management LLC | 34,891 | 3.66 | 797 | 8.44 | ||||
| 2025-08-14 | 13F | Goldman Sachs Group Inc | 0 | -100.00 | 0 | |||||
| 2025-08-28 | NP | TFAFX - Tactical Growth Allocation Fund Class I | 1,370 | 31 | ||||||
| 2025-07-21 | 13F | DHJJ Financial Advisors, Ltd. | 14 | 0.00 | 0 | |||||
| 2025-08-14 | 13F | IHT Wealth Management, LLC | 111,796 | 9.46 | 2,555 | 14.43 | ||||
| 2025-08-12 | 13F | Coldstream Capital Management Inc | 0 | -100.00 | 0 | |||||
| 2025-08-26 | 13F/A | Thrivent Financial For Lutherans | 0 | -100.00 | 0 | |||||
| 2025-04-16 | 13F | Farmers & Merchants Investments Inc | 0 | -100.00 | 0 | |||||
| 2025-08-07 | 13F | Resources Investment Advisors, LLC. | 65,658 | -17.72 | 1,500 | -13.99 | ||||
| 2025-08-13 | 13F | First Trust Advisors Lp | 27,808 | 635 | ||||||
| 2025-08-19 | 13F | Asset Dedication, LLC | 1,922 | 44 | ||||||
| 2025-08-14 | 13F | Warren Averett Asset Management, LLC | 10,304 | 235 | ||||||
| 2025-04-17 | 13F | Authentikos Wealth Advisory, LLC | 0 | -100.00 | 0 | |||||
| 2025-08-14 | 13F | Royal Bank Of Canada | 746,968 | 9.09 | 17,068 | 14.02 | ||||
| 2025-08-14 | 13F | Ausdal Financial Partners, Inc. | 78,222 | 15.08 | 1,787 | 20.34 | ||||
| 2025-08-15 | 13F | Puff Wealth Management, Llc | 48,831 | 3.61 | 1,116 | 8.25 | ||||
| 2025-08-27 | 13F | Barnes Wealth Management Group, Inc | 12,138 | 3.30 | 277 | 8.20 | ||||
| 2025-07-24 | 13F | Us Bancorp \de\ | 18,629 | -3.05 | 426 | 1.19 | ||||
| 2025-08-12 | 13F | J.w. Cole Advisors, Inc. | 23,442 | 51.91 | 536 | 58.75 | ||||
| 2025-08-12 | 13F | NWF Advisory Services Inc. | 0 | -100.00 | 0 | |||||
| 2025-07-30 | 13F | IMG Wealth Management, Inc. | 4,259 | 16.59 | 97 | 22.78 | ||||
| 2025-08-11 | 13F | Private Advisor Group, LLC | 28,083 | 91.93 | 642 | 100.94 | ||||
| 2025-08-14 | 13F | Ameriprise Financial Inc | 10,879 | -8.72 | 249 | -4.62 | ||||
| 2025-08-12 | 13F | SRS Capital Advisors, Inc. | 114,610 | 29.44 | 2,619 | 35.30 | ||||
| 2025-07-16 | 13F | Independent Wealth Network Inc. | 22,575 | -6.95 | 516 | -2.83 | ||||
| 2025-07-10 | 13F | Wealth Enhancement Advisory Services, Llc | 233,154 | -0.91 | 5,353 | 4.08 | ||||
| 2025-08-01 | 13F | Redmond Asset Management, LLC | 15,012 | -15.49 | 343 | -11.60 | ||||
| 2025-07-25 | 13F | Concurrent Investment Advisors, LLC | 93,363 | 17.50 | 2,133 | 22.87 | ||||
| 2025-08-13 | 13F | Quadrature Capital Ltd | 10,552 | 241 | ||||||
| 2025-08-12 | 13F | Proequities, Inc. | 0 | 0 | ||||||
| 2025-08-06 | 13F | Legacy Wealth Managment, LLC/ID | 28,653 | 34.26 | 655 | 40.34 | ||||
| 2025-07-17 | 13F | Janney Capital Management LLC | 129,298 | -0.60 | 3 | 0.00 | ||||
| 2025-08-01 | 13F | GoalVest Advisory LLC | 813 | -5.79 | 19 | 0.00 | ||||
| 2025-08-19 | 13F | National Asset Management, Inc. | 0 | -100.00 | 0 | |||||
| 2025-08-05 | 13F | Bank Of Montreal /can/ | 1,350 | 31 | ||||||
| 2025-08-14 | 13F | Mml Investors Services, Llc | 88,795 | 22.90 | 2 | 100.00 | ||||
| 2025-08-14 | 13F | Aqr Capital Management Llc | 22,682 | -0.25 | 518 | 4.23 | ||||
| 2025-07-16 | 13F | ORG Partners LLC | 2,000 | -75.00 | 46 | -74.29 | ||||
| 2025-08-14 | 13F | Two Sigma Investments, Lp | 448,600 | 10,251 | ||||||
| 2025-08-15 | 13F | Equitable Holdings, Inc. | 129,684 | 5.95 | 2,963 | 10.77 | ||||
| 2025-07-22 | 13F | Ergawealth Advisors, Inc. | 369,549 | 8,444 | ||||||
| 2025-08-14 | 13F/A | Rockefeller Capital Management L.P. | 198,688 | 5.05 | 4,540 | 9.82 | ||||
| 2025-08-19 | 13F | Advisory Services Network, LLC | 0 | -100.00 | 0 | |||||
| 2025-04-22 | 13F | Flagship Harbor Advisors, Llc | 0 | -100.00 | 0 | |||||
| 2025-07-23 | 13F | Kingswood Wealth Advisors, Llc | 49,180 | 7.50 | 1,124 | 11.85 | ||||
| 2025-05-15 | 13F | Concorde Asset Management, LLC | 9,695 | 206 | ||||||
| 2025-07-10 | 13F | Sovran Advisors, LLC | 36,139 | -10.08 | 826 | -1.90 | ||||
| 2025-08-18 | 13F | Tactive Advisors, LLC | 12,347 | 282 |