Basic Stats
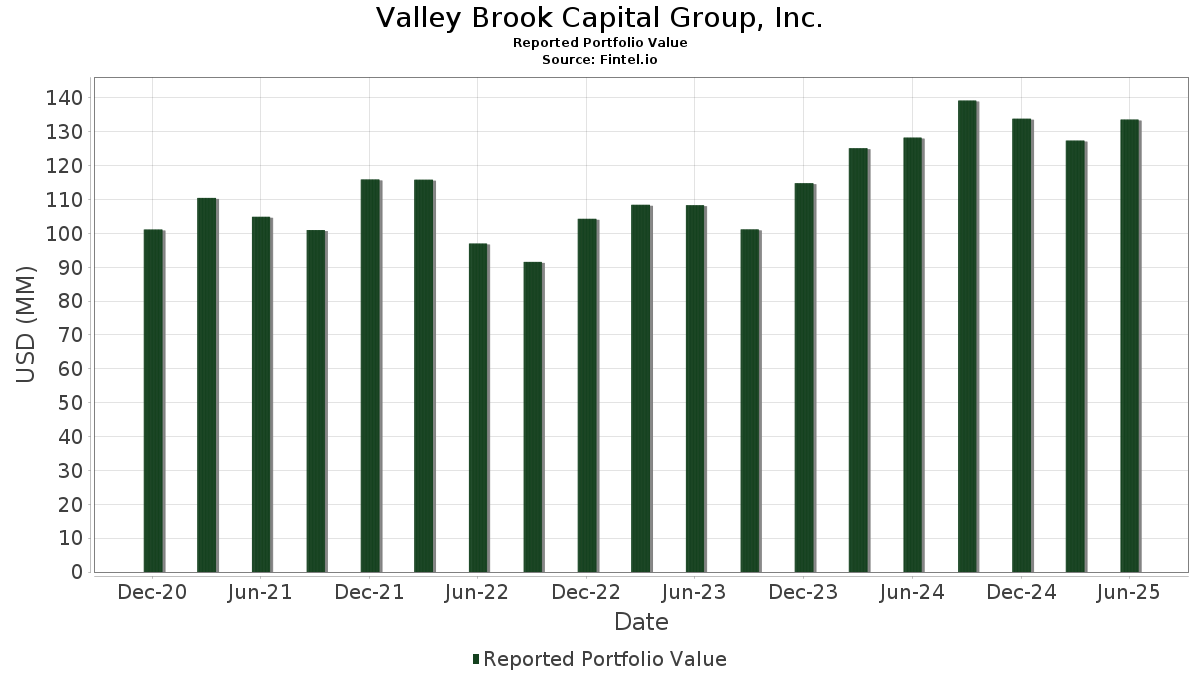
| Portfolio Value | $ 133,600,474 |
| Current Positions | 115 |
Latest Holdings, Performance, AUM (from 13F, 13D)
Valley Brook Capital Group, Inc. has disclosed 115 total holdings in their latest SEC filings. Most recent portfolio value is calculated to be $ 133,600,474 USD. Actual Assets Under Management (AUM) is this value plus cash (which is not disclosed). Valley Brook Capital Group, Inc.’s top holdings are Microsoft Corporation (US:MSFT) , Apple Inc. (US:AAPL) , JPMorgan Chase & Co. (US:JPM) , The Home Depot, Inc. (US:HD) , and Direxion Shares ETF Trust - Direxion Daily NVDA Bear 1X Shares (US:NVDD) . Valley Brook Capital Group, Inc.’s new positions include Constellation Energy Corporation (US:CEG) , The Gabelli Utility Trust (US:GUT) , .
Top Increases This Quarter
We use the change in the portfolio allocation because this is the most meaningful metric. Changes can be due to trades or changes in share prices.
| Security | Shares (MM) |
Value (MM$) |
Portfolio % | ΔPortfolio % |
|---|---|---|---|---|
| 0.02 | 12.28 | 9.1946 | 1.7704 | |
| 0.02 | 4.46 | 3.3405 | 1.0976 | |
| 0.03 | 4.49 | 3.3583 | 0.7059 | |
| 0.02 | 5.04 | 3.7748 | 0.4545 | |
| 0.00 | 2.24 | 1.6751 | 0.3137 | |
| 0.02 | 3.36 | 2.5151 | 0.3105 | |
| 0.00 | 1.22 | 0.9111 | 0.2794 | |
| 0.00 | 1.00 | 0.7453 | 0.2222 | |
| 0.00 | 1.20 | 0.8985 | 0.2090 | |
| 0.01 | 2.95 | 2.2071 | 0.1877 |
Top Decreases This Quarter
We use the change in the portfolio allocation because this is the most meaningful metric. Changes can be due to trades or changes in share prices.
| Security | Shares (MM) |
Value (MM$) |
Portfolio % | ΔPortfolio % |
|---|---|---|---|---|
| 0.04 | 8.91 | 6.6682 | -1.6964 | |
| 0.02 | 4.23 | 3.1666 | -0.6025 | |
| 0.00 | 1.28 | 0.9545 | -0.3638 | |
| 0.01 | 4.63 | 3.4619 | -0.2549 | |
| 0.01 | 3.13 | 2.3406 | -0.2279 | |
| 0.01 | 1.50 | 1.1257 | -0.2099 | |
| 0.01 | 1.68 | 1.2605 | -0.1747 | |
| 0.01 | 1.03 | 0.7735 | -0.1742 | |
| 0.01 | 1.99 | 1.4904 | -0.1660 | |
| 0.01 | 1.07 | 0.7988 | -0.1643 |
13F and Fund Filings
This form was filed on 2025-07-25 for the reporting period 2025-06-30. Click the link icon to see the full transaction history.
Upgrade to unlock premium data and export to Excel ![]() .
.
| Security | Type | Avg Share Price | Shares (MM) |
ΔShares (%) |
ΔShares (%) |
Value ($MM) |
Portfolio (%) |
ΔPortfolio (%) |
|
|---|---|---|---|---|---|---|---|---|---|
| MSFT / Microsoft Corporation | 0.02 | -1.98 | 12.28 | 29.89 | 9.1946 | 1.7704 | |||
| AAPL / Apple Inc. | 0.04 | -9.48 | 8.91 | -16.40 | 6.6682 | -1.6964 | |||
| JPM / JPMorgan Chase & Co. | 0.02 | 0.88 | 5.04 | 19.25 | 3.7748 | 0.4545 | |||
| HD / The Home Depot, Inc. | 0.01 | -2.36 | 4.63 | -2.30 | 3.4619 | -0.2549 | |||
| NVDD / Direxion Shares ETF Trust - Direxion Daily NVDA Bear 1X Shares | 0.03 | -8.91 | 4.49 | 32.80 | 3.3583 | 0.7059 | |||
| AVGO / Broadcom Inc. | 0.02 | -5.13 | 4.46 | 56.18 | 3.3405 | 1.0976 | |||
| ABBV / AbbVie Inc. | 0.02 | -0.55 | 4.23 | -11.89 | 3.1666 | -0.6025 | |||
| AMZN / Amazon.com, Inc. | 0.02 | 3.76 | 3.36 | 19.66 | 2.5151 | 0.3105 | |||
| UNP / Union Pacific Corporation | 0.01 | -1.88 | 3.13 | -4.43 | 2.3406 | -0.2279 | |||
| RTX / RTX Corporation | 0.02 | -0.75 | 2.98 | 9.42 | 2.2275 | 0.0924 | |||
| CAT / Caterpillar Inc. | 0.01 | -2.63 | 2.95 | 14.62 | 2.2071 | 0.1877 | |||
| WMT / Walmart Inc. | 0.03 | -0.45 | 2.65 | 10.85 | 1.9819 | 0.1073 | |||
| DE / Deere & Company | 0.00 | -3.31 | 2.54 | 4.74 | 1.9024 | -0.0020 | |||
| V / Visa Inc. | 0.01 | -0.99 | 2.52 | 0.32 | 1.8864 | -0.0858 | |||
| COST / Costco Wholesale Corporation | 0.00 | 1.44 | 2.45 | 6.17 | 1.8305 | 0.0224 | |||
| META / Meta Platforms, Inc. | 0.00 | 0.76 | 2.24 | 29.01 | 1.6751 | 0.3137 | |||
| MCD / McDonald's Corporation | 0.01 | 0.89 | 1.99 | -5.64 | 1.4904 | -0.1660 | |||
| PNC / The PNC Financial Services Group, Inc. | 0.01 | -1.49 | 1.96 | 4.48 | 1.4650 | -0.0056 | |||
| GOOG / Alphabet Inc. | 0.01 | 1.79 | 1.82 | 15.57 | 1.3618 | 0.1261 | |||
| JNJ / Johnson & Johnson | 0.01 | 0.00 | 1.68 | -7.88 | 1.2605 | -0.1747 | |||
| ADP / Automatic Data Processing, Inc. | 0.00 | -0.80 | 1.53 | 0.13 | 1.1461 | -0.0543 | |||
| XOM / Exxon Mobil Corporation | 0.01 | -2.48 | 1.50 | -11.64 | 1.1257 | -0.2099 | |||
| BRK.B / Berkshire Hathaway Inc. | 0.00 | 4.91 | 1.48 | -4.26 | 1.1101 | -0.1065 | |||
| GJR / Strats Trust For Procter & Gambel Security - Preferred Security | 0.01 | 0.00 | 1.46 | -6.46 | 1.0951 | -0.1334 | |||
| ABT / Abbott Laboratories | 0.01 | 0.00 | 1.44 | 2.56 | 1.0781 | -0.0246 | |||
| ITW / Illinois Tool Works Inc. | 0.01 | 0.17 | 1.42 | -0.14 | 1.0641 | -0.0533 | |||
| CRM / Salesforce, Inc. | 0.00 | 5.52 | 1.36 | 7.28 | 1.0143 | 0.0223 | |||
| TMO / Thermo Fisher Scientific Inc. | 0.00 | -6.81 | 1.28 | -24.06 | 0.9545 | -0.3638 | |||
| LLY / Eli Lilly and Company | 0.00 | 1.26 | 1.25 | -4.44 | 0.9347 | -0.0909 | |||
| TJX / The TJX Companies, Inc. | 0.01 | 0.71 | 1.24 | 2.06 | 0.9258 | -0.0251 | |||
| NFLX / Netflix, Inc. | 0.00 | 5.33 | 1.22 | 51.37 | 0.9111 | 0.2794 | |||
| GE / General Electric Company | 0.00 | 6.27 | 1.20 | 36.67 | 0.8985 | 0.2090 | |||
| AMGN / Amgen Inc. | 0.00 | -0.12 | 1.18 | -10.49 | 0.8812 | -0.1511 | |||
| LMT / Lockheed Martin Corporation | 0.00 | -4.87 | 1.09 | -1.36 | 0.8129 | -0.0515 | |||
| MA / Mastercard Incorporated | 0.00 | 3.13 | 1.07 | 5.71 | 0.8046 | 0.0065 | |||
| PEP / PepsiCo, Inc. | 0.01 | -1.22 | 1.07 | -12.97 | 0.7988 | -0.1643 | |||
| HON / Honeywell International Inc. | 0.00 | -5.56 | 1.05 | 3.86 | 0.7853 | -0.0076 | |||
| CVX / Chevron Corporation | 0.01 | 0.01 | 1.03 | -14.42 | 0.7735 | -0.1742 | |||
| NEE / NextEra Energy, Inc. | 0.01 | -3.37 | 1.00 | -5.37 | 0.7515 | -0.0814 | |||
| CRWD / CrowdStrike Holdings, Inc. | 0.00 | 3.44 | 1.00 | 49.40 | 0.7453 | 0.2222 | |||
| MPC / Marathon Petroleum Corporation | 0.01 | -0.76 | 0.98 | 13.15 | 0.7348 | 0.0538 | |||
| CARR / Carrier Global Corporation | 0.01 | -2.02 | 0.98 | 13.19 | 0.7324 | 0.0534 | |||
| FTXP / Foothills Exploration, Inc. | 0.00 | 1.94 | 0.94 | 34.33 | 0.7060 | 0.1548 | |||
| GOOGL / Alphabet Inc. | 0.00 | 3.97 | 0.85 | 18.47 | 0.6388 | 0.0734 | |||
| SO / The Southern Company | 0.01 | 0.62 | 0.77 | 0.52 | 0.5780 | -0.0252 | |||
| EMR / Emerson Electric Co. | 0.01 | 0.00 | 0.76 | 21.69 | 0.5713 | 0.0786 | |||
| CB / Chubb Limited | 0.00 | -0.96 | 0.75 | -4.97 | 0.5584 | -0.0579 | |||
| CSX / CSX Corporation | 0.02 | -2.20 | 0.73 | 8.52 | 0.5434 | 0.0179 | |||
| APD / Air Products and Chemicals, Inc. | 0.00 | 1.04 | 0.69 | -3.37 | 0.5151 | -0.0440 | |||
| PSX / Phillips 66 | 0.01 | -3.35 | 0.69 | -6.54 | 0.5135 | -0.0631 | |||
| GAB / The Gabelli Equity Trust Inc. | 0.12 | 2.66 | 0.67 | 8.53 | 0.5046 | 0.0166 | |||
| LRCX / Lam Research Corporation | 0.01 | 1.96 | 0.66 | 36.51 | 0.4925 | 0.1142 | |||
| NKE / NIKE, Inc. | 0.01 | -2.69 | 0.64 | 8.81 | 0.4812 | 0.0178 | |||
| NOW / ServiceNow, Inc. | 0.00 | 5.97 | 0.64 | 36.91 | 0.4779 | 0.1116 | |||
| TSM / Taiwan Semiconductor Manufacturing Company Limited - Depositary Receipt (Common Stock) | 0.00 | 26.83 | 0.62 | 73.06 | 0.4664 | 0.1837 | |||
| PSI / Invesco Exchange-Traded Fund Trust - Invesco Semiconductors ETF | 0.01 | -6.05 | 0.62 | 18.93 | 0.4661 | 0.0549 | |||
| NVS / Novartis AG - Depositary Receipt (Common Stock) | 0.00 | 0.00 | 0.60 | 8.70 | 0.4492 | 0.0152 | |||
| VZ / Verizon Communications Inc. | 0.01 | -4.27 | 0.58 | -8.66 | 0.4347 | -0.0645 | |||
| ASML / ASML Holding N.V. - Depositary Receipt (Common Stock) | 0.00 | 22.82 | 0.56 | 48.42 | 0.4229 | 0.1243 | |||
| TRGP / Targa Resources Corp. | 0.00 | -0.79 | 0.55 | -13.90 | 0.4085 | -0.0888 | |||
| ETN / Eaton Corporation plc | 0.00 | -0.33 | 0.54 | 30.81 | 0.4008 | 0.0797 | |||
| VST / Vistra Corp. | 0.00 | 14.41 | 0.52 | 88.64 | 0.3859 | 0.1715 | |||
| TRV / The Travelers Companies, Inc. | 0.00 | 0.00 | 0.51 | 1.18 | 0.3841 | -0.0141 | |||
| OTIS / Otis Worldwide Corporation | 0.01 | 0.00 | 0.50 | -4.02 | 0.3754 | -0.0349 | |||
| ADBE / Adobe Inc. | 0.00 | -7.33 | 0.49 | -6.50 | 0.3663 | -0.0446 | |||
| PANW / Palo Alto Networks, Inc. | 0.00 | -2.09 | 0.48 | 17.36 | 0.3597 | 0.0384 | |||
| TXN / Texas Instruments Incorporated | 0.00 | 0.00 | 0.48 | 15.42 | 0.3590 | 0.0331 | |||
| ES / Eversource Energy | 0.01 | 0.00 | 0.48 | 2.36 | 0.3585 | -0.0085 | |||
| SHW / The Sherwin-Williams Company | 0.00 | 2.42 | 0.45 | 0.90 | 0.3369 | -0.0140 | |||
| FTEC / Fidelity Covington Trust - Fidelity MSCI Information Technology Index ETF | 0.00 | 0.67 | 0.45 | 23.20 | 0.3341 | 0.0495 | |||
| ACN / Accenture plc | 0.00 | 0.00 | 0.44 | -4.15 | 0.3289 | -0.0312 | |||
| PPA / Invesco Exchange-Traded Fund Trust - Invesco Aerospace & Defense ETF | 0.00 | 1.64 | 0.44 | 23.66 | 0.3289 | 0.0497 | |||
| VMC / Vulcan Materials Company | 0.00 | 5.99 | 0.44 | 18.70 | 0.3280 | 0.0377 | |||
| DIS / The Walt Disney Company | 0.00 | -4.62 | 0.43 | 19.89 | 0.3255 | 0.0406 | |||
| ROK / Rockwell Automation, Inc. | 0.00 | 0.00 | 0.43 | 28.66 | 0.3232 | 0.0595 | |||
| FIDU / Fidelity Covington Trust - Fidelity MSCI Industrials Index ETF | 0.01 | 1.37 | 0.43 | 14.93 | 0.3228 | 0.0279 | |||
| RPG / Invesco Exchange-Traded Fund Trust - Invesco S&P 500 Pure Growth ETF | 0.01 | -1.66 | 0.40 | 17.89 | 0.3012 | 0.0327 | |||
| GEV / GE Vernova Inc. | 0.00 | -3.22 | 0.40 | 67.51 | 0.2978 | 0.1116 | |||
| AMT / American Tower Corporation | 0.00 | 0.00 | 0.40 | 1.53 | 0.2978 | -0.0097 | |||
| MINT / PIMCO ETF Trust - PIMCO Enhanced Short Maturity Active Exchange-Traded Fund | 0.00 | 1.70 | 0.40 | 1.53 | 0.2975 | -0.0095 | |||
| GIS / General Mills, Inc. | 0.01 | 0.00 | 0.39 | -13.23 | 0.2899 | -0.0610 | |||
| GD / General Dynamics Corporation | 0.00 | 0.08 | 0.38 | 6.98 | 0.2874 | 0.0057 | |||
| KMI / Kinder Morgan, Inc. | 0.01 | -3.76 | 0.38 | -0.79 | 0.2815 | -0.0162 | |||
| XLG / Invesco Exchange-Traded Fund Trust - Invesco S&P 500 Top 50 ETF | 0.01 | 9.51 | 0.38 | 24.17 | 0.2808 | 0.0433 | |||
| CL / Colgate-Palmolive Company | 0.00 | -5.57 | 0.36 | -8.33 | 0.2722 | -0.0394 | |||
| LOW / Lowe's Companies, Inc. | 0.00 | 0.00 | 0.35 | -5.09 | 0.2657 | -0.0272 | |||
| FNCL / Fidelity Covington Trust - Fidelity MSCI Financials Index ETF | 0.00 | 1.15 | 0.33 | 7.49 | 0.2478 | 0.0066 | |||
| BMY / Bristol-Myers Squibb Company | 0.01 | 0.00 | 0.32 | -24.10 | 0.2363 | -0.0902 | |||
| PPT / Putnam Premier Income Trust | 0.08 | 1.34 | 0.31 | 3.00 | 0.2318 | -0.0042 | |||
| OKE / ONEOK, Inc. | 0.00 | -7.35 | 0.31 | -23.95 | 0.2311 | -0.0868 | |||
| BLK / BlackRock, Inc. | 0.00 | 2.46 | 0.31 | 13.75 | 0.2291 | 0.0173 | |||
| CNI / Canadian National Railway Company | 0.00 | 0.00 | 0.30 | 6.74 | 0.2258 | 0.0040 | |||
| HSY / The Hershey Company | 0.00 | 0.00 | 0.29 | -3.06 | 0.2136 | -0.0173 | |||
| FHLC / Fidelity Covington Trust - Fidelity MSCI Health Care Index ETF | 0.00 | 0.69 | 0.28 | -5.76 | 0.2084 | -0.0235 | |||
| ED / Consolidated Edison, Inc. | 0.00 | 0.00 | 0.28 | -9.54 | 0.2066 | -0.0322 | |||
| ISRG / Intuitive Surgical, Inc. | 0.00 | -4.90 | 0.26 | 4.37 | 0.1973 | -0.0010 | |||
| SCCO / Southern Copper Corporation | 0.00 | -3.67 | 0.26 | 4.05 | 0.1929 | -0.0011 | |||
| FTHI / First Trust Exchange-Traded Fund VI - First Trust BuyWrite Income ETF | 0.01 | 0.24 | 0.26 | 4.94 | 0.1912 | -0.0002 | |||
| BTZ / BlackRock Credit Allocation Income Trust | 0.02 | 0.36 | 0.24 | 2.17 | 0.1760 | -0.0046 | |||
| SBUX / Starbucks Corporation | 0.00 | 1.42 | 0.23 | -5.37 | 0.1720 | -0.0184 | |||
| IDXX / IDEXX Laboratories, Inc. | 0.00 | 0.23 | 0.1706 | 0.1706 | |||||
| K / Kellanova | 0.00 | 0.00 | 0.23 | -3.83 | 0.1697 | -0.0149 | |||
| MRK / Merck & Co., Inc. | 0.00 | -12.09 | 0.22 | -22.49 | 0.1680 | -0.0593 | |||
| SPGI / S&P Global Inc. | 0.00 | 0.00 | 0.22 | 4.19 | 0.1677 | -0.0018 | |||
| T / AT&T Inc. | 0.01 | 0.00 | 0.22 | 2.34 | 0.1646 | -0.0041 | |||
| CEG / Constellation Energy Corporation | 0.00 | 0.22 | 0.1633 | 0.1633 | |||||
| C / Citigroup Inc. | 0.00 | 0.22 | 0.1625 | 0.1625 | |||||
| VO / Vanguard Index Funds - Vanguard Mid-Cap ETF | 0.00 | -10.61 | 0.22 | -3.57 | 0.1623 | -0.0136 | |||
| DGX / Quest Diagnostics Incorporated | 0.00 | 0.00 | 0.22 | 5.91 | 0.1613 | 0.0020 | |||
| BA / The Boeing Company | 0.00 | 0.21 | 0.1575 | 0.1575 | |||||
| PGF / Invesco Exchange-Traded Fund Trust - Invesco Financial Preferred ETF | 0.01 | 0.00 | 0.18 | -1.12 | 0.1331 | -0.0082 | |||
| MCR / MFS Charter Income Trust | 0.02 | 0.00 | 0.15 | 1.34 | 0.1135 | -0.0038 | |||
| AGNC / AGNC Investment Corp. | 0.01 | 0.00 | 0.11 | -4.20 | 0.0855 | -0.0080 | |||
| JPC / Nuveen Preferred & Income Opportunities Fund | 0.01 | 0.00 | 0.11 | 0.93 | 0.0810 | -0.0033 | |||
| GUT / The Gabelli Utility Trust | 0.02 | 0.10 | 0.0738 | 0.0738 | |||||
| UNH / UnitedHealth Group Incorporated | 0.00 | -100.00 | 0.00 | 0.0000 |