Basic Stats
| Institutional Owners | 290 total, 281 long only, 2 short only, 7 long/short - change of 0.35% MRQ |
| Average Portfolio Allocation | 0.1014 % - change of -9.06% MRQ |
| Institutional Shares (Long) | 173,438,953 (ex 13D/G) - change of -3.43MM shares -1.94% MRQ |
| Institutional Value (Long) | $ 1,272,967 USD ($1000) |
Institutional Ownership and Shareholders
United Microelectronics Corporation - Depositary Receipt (Common Stock) (US:UMC) has 290 institutional owners and shareholders that have filed 13D/G or 13F forms with the Securities Exchange Commission (SEC). These institutions hold a total of 173,438,953 shares. Largest shareholders include BlackRock, Inc., Morgan Stanley, UBS Group AG, Vanguard Group Inc, SOXX - iShares PHLX Semiconductor ETF, Rafferty Asset Management, LLC, Bank Of America Corp /de/, VEIEX - Vanguard Emerging Markets Stock Index Fund Investor Shares, SOXL - Direxion Daily Semiconductor Bull 3X Shares, and Goldman Sachs Group Inc .
United Microelectronics Corporation - Depositary Receipt (Common Stock) (NYSE:UMC) institutional ownership structure shows current positions in the company by institutions and funds, as well as latest changes in position size. Major shareholders can include individual investors, mutual funds, hedge funds, or institutions. The Schedule 13D indicates that the investor holds (or held) more than 5% of the company and intends (or intended) to actively pursue a change in business strategy. Schedule 13G indicates a passive investment of over 5%.
The share price as of September 8, 2025 is 6.89 / share. Previously, on September 9, 2024, the share price was 8.43 / share. This represents a decline of 18.27% over that period.

Fund Sentiment Score
The Fund Sentiment Score (fka Ownership Accumulation Score) finds the stocks that are being most bought by funds. It is the result of a sophisticated, multi-factor quantitative model that identifies companies with the highest levels of institutional accumulation. The scoring model uses a combination of the total increase in disclosed owners, the changes in portfolio allocations in those owners and other metrics. The number ranges from 0 to 100, with higher numbers indicating a higher level of accumulation to its peers, and 50 being the average.
Update Frequency: Daily
See Ownership Explorer, which provides a list of highest-ranking companies.
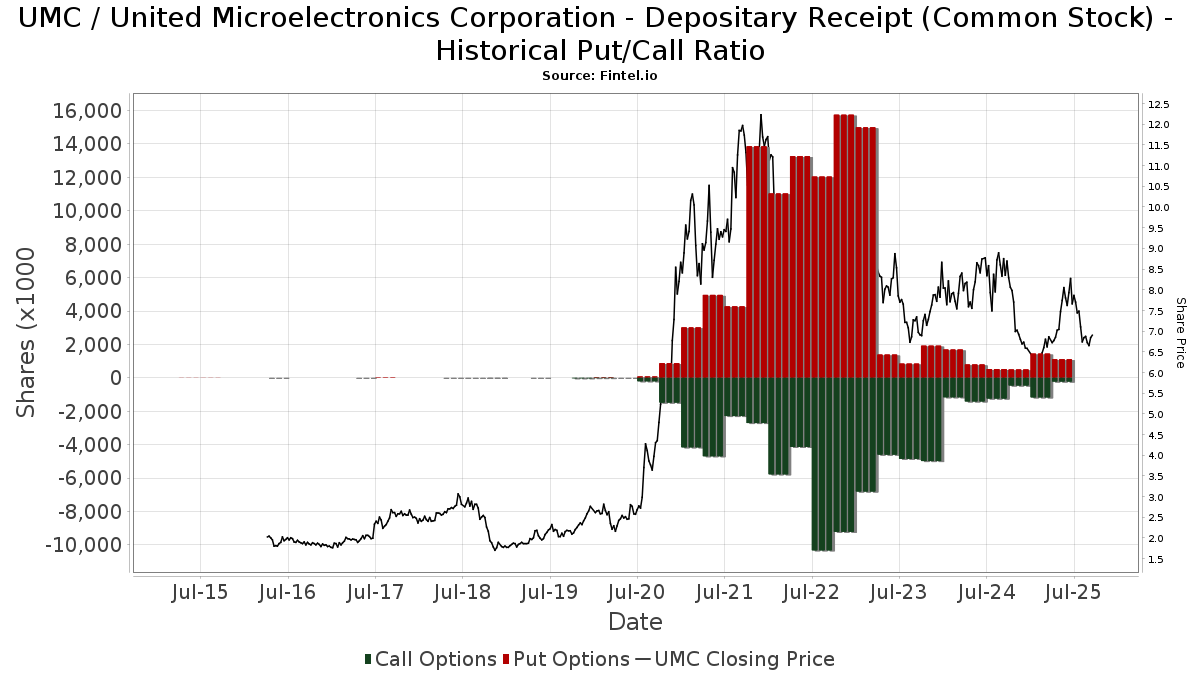
Institutional Put/Call Ratio
In addition to reporting standard equity and debt issues, institutions with more than 100MM assets under management must also disclose their put and call option holdings. Since put options generally indicate negative sentiment, and call options indicate positive sentiment, we can get a sense of the overall institutional sentiment by plotting the ratio of puts to calls. The chart to the right plots the historical put/call ratio for this instrument.
Using Put/Call Ratio as an indicator of investor sentiment overcomes one of the key deficiencies of using total institutional ownership, which is that a significant amount of assets under management are invested passively to track indices. Passively-managed funds do not typically buy options, so the put/call ratio indicator more closely tracks the sentiment of actively-managed funds.
13F and NPORT Filings
Detail on 13F filings are free. Detail on NP filings require a premium membership. Green rows indicate new positions. Red rows indicate closed positions. Click the link icon to see the full transaction history.
Upgrade
to unlock premium data and export to Excel ![]() .
.
| File Date | Source | Investor | Type | Avg Price (Est) |
Shares | Δ Shares (%) |
Reported Value ($1000) |
Δ Value (%) |
Port Alloc (%) |
|
|---|---|---|---|---|---|---|---|---|---|---|
| 2025-08-14 | 13F | Aquatic Capital Management LLC | 0 | -100.00 | 0 | |||||
| 2025-08-18 | 13F | Geneos Wealth Management Inc. | 117 | 1 | ||||||
| 2025-08-14 | 13F | Nomura Holdings Inc | 0 | -100.00 | 0 | |||||
| 2025-08-28 | NP | GMF - SPDR(R) S&P(R) EMERGING ASIA PACIFIC ETF | 157,044 | -6.51 | 1,201 | 0.00 | ||||
| 2025-05-02 | 13F | Capital A Wealth Management, LLC | 504 | 0.00 | 4 | 0.00 | ||||
| 2025-08-27 | 13F/A | Squarepoint Ops LLC | Call | 0 | -100.00 | 0 | -100.00 | |||
| 2025-07-21 | 13F | Hennessy Advisors Inc | 14,908 | -25.82 | 114 | -20.28 | ||||
| 2025-08-08 | 13F | Wealth Alliance | 10,042 | 77 | ||||||
| 2025-08-12 | 13F | CIBC Private Wealth Group, LLC | 2,024 | 47.52 | 15 | 87.50 | ||||
| 2025-08-14 | 13F | Mml Investors Services, Llc | 10,507 | 0 | ||||||
| 2025-08-04 | 13F | Simon Quick Advisors, Llc | 22,710 | 51.17 | 174 | 61.68 | ||||
| 2025-06-26 | NP | HFIGX - Hartford Schroders Diversified Growth Fund Class I | 10,628 | 31.23 | 75 | 60.87 | ||||
| 2025-06-26 | NP | DFCEX - Emerging Markets Core Equity Portfolio - Institutional Class This fund is a listed as child fund of Dimensional Fund Advisors Lp and if that institution has disclosed ownership in this security, then these positions will not be double counted when calculating total shares and total value | 82,862 | 0.00 | 583 | 21.97 | ||||
| 2025-08-12 | 13F/A | Cozad Asset Management Inc | 12,829 | 0.00 | 98 | 7.69 | ||||
| 2025-08-14 | 13F | Old Mission Capital Llc | 0 | -100.00 | 0 | |||||
| 2025-08-13 | 13F | Russell Investments Group, Ltd. | 171 | 17,000.00 | 1 | |||||
| 2025-06-30 | NP | TRFM - AAM Transformers ETF | 21,837 | 154 | ||||||
| 2025-08-11 | 13F | Vanguard Group Inc | 14,825,471 | -5.64 | 113,415 | 0.95 | ||||
| 2025-08-14 | 13F | SIH Partners, LLLP | Put | 0 | -100.00 | 0 | ||||
| 2025-06-30 | NP | VMNVX - Vanguard Global Minimum Volatility Fund Admiral Shares | 4,743,496 | -11.55 | 33,394 | 7.73 | ||||
| 2025-07-25 | 13F | Johnson Investment Counsel Inc | 29,000 | -32.24 | 222 | -27.78 | ||||
| 2025-08-07 | 13F | Parkside Financial Bank & Trust | 1,020 | 61.90 | 8 | 75.00 | ||||
| 2025-08-14 | 13F | Ubs Asset Management Americas Inc | 25,600 | -88.09 | 196 | -87.31 | ||||
| 2025-08-14 | 13F | Atomi Financial Group, Inc. | 50,360 | 40.49 | 385 | 50.39 | ||||
| 2025-06-27 | NP | SOXL - Direxion Daily Semiconductor Bull 3X Shares | 6,757,244 | 17.13 | 47,571 | 42.66 | ||||
| 2025-08-05 | 13F | Crestwood Advisors Group LLC | 19,614 | 9.26 | 150 | 17.19 | ||||
| 2025-08-27 | 13F/A | Squarepoint Ops LLC | 148,637 | -16.61 | 1,137 | -10.75 | ||||
| 2025-08-08 | 13F | Allianz Se | 0 | -100.00 | 0 | |||||
| 2025-08-14 | 13F | CoreCap Advisors, LLC | 2,805 | 0.00 | 21 | 5.00 | ||||
| 2025-08-14 | 13F | Goldman Sachs Group Inc | 5,585,582 | -1.24 | 42,730 | 5.67 | ||||
| 2025-08-26 | NP | Profunds - Profund Vp Emerging Markets | 39,885 | 11.17 | 305 | 19.14 | ||||
| 2025-08-14 | 13F | Integrated Wealth Concepts LLC | 13,298 | 102 | ||||||
| 2025-05-15 | 13F | Wolverine Trading, Llc | Call | 0 | -100.00 | 0 | ||||
| 2025-08-13 | 13F | Jones Financial Companies Lllp | 5,262 | 43.77 | 40 | 73.91 | ||||
| 2025-08-14 | 13F | LMR Partners LLP | 0 | -100.00 | 0 | |||||
| 2025-08-14 | 13F | Symmetry Investments LP | Call | 0 | -100.00 | 0 | ||||
| 2025-04-01 | NP | CVY - Invesco Zacks Multi-Asset Income ETF This fund is a listed as child fund of Invesco Ltd. and if that institution has disclosed ownership in this security, then these positions will not be double counted when calculating total shares and total value | 137,461 | 0.09 | 795 | -15.44 | ||||
| 2025-07-21 | 13F | Ameriflex Group, Inc. | 267 | -50.74 | 2 | -33.33 | ||||
| 2025-08-13 | 13F | Quantbot Technologies LP | 7,971 | -97.28 | 61 | -97.14 | ||||
| 2025-07-17 | 13F | HB Wealth Management, LLC | 13,471 | 103 | ||||||
| 2025-04-29 | 13F | Bank of New York Mellon Corp | 0 | -100.00 | 0 | |||||
| 2025-08-13 | 13F | EverSource Wealth Advisors, LLC | 21,111 | 51.08 | 161 | 62.63 | ||||
| 2025-08-13 | 13F | Natixis Advisors, L.p. | 163,518 | -5.05 | 1 | 0.00 | ||||
| 2025-07-23 | 13F | Prime Capital Investment Advisors, LLC | 14,249 | -32.78 | 109 | -27.81 | ||||
| 2025-07-17 | 13F | Clean Yield Group | 218 | 0.00 | 2 | 0.00 | ||||
| 2025-08-11 | 13F | Frank, Rimerman Advisors LLC | 62,082 | 475 | ||||||
| 2025-05-15 | 13F | Angeles Investment Advisors, LLC | 0 | -100.00 | 0 | |||||
| 2025-08-05 | 13F | Key FInancial Inc | 1,200 | 0.00 | 9 | 12.50 | ||||
| 2025-05-14 | 13F | Fisher Asset Management, LLC | 0 | -100.00 | 0 | |||||
| 2025-08-14 | 13F | Axa S.a. | 63,004 | 0.00 | 482 | 6.89 | ||||
| 2025-08-12 | 13F | Coldstream Capital Management Inc | 0 | -100.00 | 0 | |||||
| 2025-08-13 | 13F | Invesco Ltd. | 87,636 | -23.66 | 670 | -18.29 | ||||
| 2025-08-12 | 13F | SRS Capital Advisors, Inc. | 1,293 | 10 | ||||||
| 2025-08-13 | 13F | Guggenheim Capital Llc | 350,382 | -5.26 | 2,680 | 1.36 | ||||
| 2025-08-14 | 13F | Jain Global LLC | 49,197 | 376 | ||||||
| 2025-05-15 | 13F | MIRAE ASSET GLOBAL ETFS HOLDINGS Ltd. | 0 | -100.00 | 0 | |||||
| 2025-08-14 | 13F | SIH Partners, LLLP | Call | 0 | -100.00 | 0 | ||||
| 2025-08-13 | 13F | Jump Financial, LLC | 0 | -100.00 | 0 | |||||
| 2025-07-22 | 13F | Carolina Wealth Advisors, LLC | 30 | 0 | ||||||
| 2025-08-14 | 13F | Optiver Holding B.V. | 1 | 0 | ||||||
| 2025-07-31 | 13F | Nisa Investment Advisors, Llc | 500 | 0.00 | 4 | 33.33 | ||||
| 2025-07-24 | 13F | Callan Family Office, LLC | 54,754 | 406.79 | 419 | 442.86 | ||||
| 2025-08-13 | 13F | Bollard Group LLC | 0 | -100.00 | 0 | |||||
| 2025-08-27 | NP | RYWTX - Emerging Markets 2x Strategy Fund Class A | 12,432 | 147.90 | 95 | 171.43 | ||||
| 2025-05-13 | 13F | Arrowpoint Investment Partners (Singapore) Pte. Ltd. | 0 | -100.00 | 0 | |||||
| 2025-08-13 | 13F | Arrowstreet Capital, Limited Partnership | 317,271 | 2,427 | ||||||
| 2025-08-14 | 13F | Hrt Financial Lp | 0 | -100.00 | 0 | |||||
| 2025-07-14 | 13F | Abound Wealth Management | 160 | 0.00 | 1 | 0.00 | ||||
| 2025-08-14 | 13F | Man Group plc | 19,346 | -90.33 | 148 | -89.72 | ||||
| 2025-07-24 | 13F | PDS Planning, Inc | 70,758 | 3.49 | 541 | 10.86 | ||||
| 2025-07-25 | 13F | Sequoia Financial Advisors, LLC | 176,603 | 29.43 | 1,351 | 38.56 | ||||
| 2025-07-28 | 13F | Kiker Wealth Management, LLC | 670 | 0.00 | 5 | 25.00 | ||||
| 2025-08-12 | 13F | Park Square Financial Group, LLC | 524 | 0.00 | 4 | 33.33 | ||||
| 2025-08-14 | 13F | Jane Street Group, Llc | Call | 0 | -100.00 | 0 | ||||
| 2025-08-14 | 13F | Jane Street Group, Llc | 0 | -100.00 | 0 | |||||
| 2025-08-14 | 13F | Millennium Management Llc | 58,780 | -99.26 | 450 | -99.20 | ||||
| 2025-05-14 | 13F | KilterHowling LLC | 0 | -100.00 | 0 | |||||
| 2025-07-18 | 13F | BSW Wealth Partners | 35,482 | -3.36 | 271 | 3.44 | ||||
| 2025-07-28 | 13F | BRYN MAWR TRUST Co | 325 | 0.00 | 2 | 0.00 | ||||
| 2025-07-11 | 13F | Viking Fund Management Llc | 12,000 | 92 | ||||||
| 2025-08-12 | 13F | Enterprise Financial Services Corp | 12,008 | 92 | ||||||
| 2025-08-12 | 13F | MAI Capital Management | 21,104 | 6,934.67 | 161 | 7,950.00 | ||||
| 2025-08-25 | 13F/A | Neuberger Berman Group LLC | 62,104 | 475 | ||||||
| 2025-08-27 | NP | RYDEX VARIABLE TRUST - Electronics Fund Variable Annuity | 14,808 | -61.56 | 113 | -58.91 | ||||
| 2025-08-14 | 13F | Ameriprise Financial Inc | 30,574 | -2.34 | 245 | 9.42 | ||||
| 2025-07-28 | NP | NSI - National Security Emerging Markets Index ETF | 29,978 | 38.48 | 228 | 64.03 | ||||
| 2025-08-13 | 13F | Walleye Trading LLC | Put | 23,100 | -93.35 | 177 | -92.91 | |||
| 2025-08-14 | 13F | Vident Advisory, LLC | 569,810 | 50.83 | 4,359 | 61.38 | ||||
| 2025-08-29 | NP | MPLAX - Praxis International Index Fund Class A | 177,976 | -10.76 | 1,362 | -4.49 | ||||
| 2025-04-28 | 13F | Vontobel Holding Ltd. | 0 | -100.00 | 0 | |||||
| 2025-08-12 | 13F | Ameritas Investment Partners, Inc. | 2 | 0.00 | 0 | |||||
| 2025-08-14 | 13F/A | Barclays Plc | 5,257,834 | 43.33 | 40 | 53.85 | ||||
| 2025-05-15 | 13F | Laird Norton Trust Company, Llc | 0 | -100.00 | 0 | |||||
| 2025-07-23 | 13F | Canopy Partners, LLC | 24,325 | -9.17 | 186 | -2.62 | ||||
| 2025-05-15 | 13F | Gts Securities Llc | 0 | -100.00 | 0 | |||||
| 2025-08-14 | 13F | Stifel Financial Corp | 126,016 | -0.50 | 964 | 6.52 | ||||
| 2025-08-13 | 13F | First Trust Advisors Lp | 112,176 | -17.81 | 858 | -12.00 | ||||
| 2025-08-14 | 13F | Fmr Llc | 220,351 | -60.04 | 1,686 | -57.26 | ||||
| 2025-08-11 | 13F | Principal Securities, Inc. | 367 | 28.32 | 3 | 100.00 | ||||
| 2025-08-13 | 13F | Marshall Wace, Llp | 0 | -100.00 | 0 | |||||
| 2025-07-21 | 13F | Mirae Asset Global Investments Co., Ltd. | 1,031 | 8 | ||||||
| 2025-08-12 | 13F | Global Retirement Partners, LLC | 10,457 | 1.69 | 80 | 19.70 | ||||
| 2025-08-12 | 13F | Proequities, Inc. | Put | 0 | 0 | |||||
| 2025-08-12 | 13F | Proequities, Inc. | Call | 0 | 0 | |||||
| 2025-08-12 | 13F | Proequities, Inc. | 0 | 0 | ||||||
| 2025-08-14 | 13F | Henry James International Management Inc. | 14,000 | 0.50 | 107 | 8.08 | ||||
| 2025-05-15 | 13F | Qube Research & Technologies Ltd | 0 | -100.00 | 0 | |||||
| 2025-08-14 | 13F | Federation des caisses Desjardins du Quebec | 2,500 | 25.00 | 19 | 35.71 | ||||
| 2025-08-01 | 13F | Ashton Thomas Private Wealth, LLC | 0 | -100.00 | 0 | |||||
| 2025-08-01 | 13F | Bessemer Group Inc | 12,515 | 0.00 | 0 | |||||
| 2025-08-13 | 13F | West Family Investments, Inc. | 187,696 | 37.23 | 1,436 | 46.88 | ||||
| 2025-08-14 | 13F | State Street Corp | 4,292,954 | 8.22 | 34,449 | 21.46 | ||||
| 2025-08-14 | 13F | Scientech Research LLC | 0 | -100.00 | 0 | |||||
| 2025-08-12 | 13F | BlackRock, Inc. | 24,317,060 | 6.67 | 186,026 | 14.13 | ||||
| 2025-08-14 | 13F/A | Skopos Labs, Inc. | 40,994 | 186.37 | 314 | 206.86 | ||||
| 2025-07-24 | 13F | Us Bancorp \de\ | 266,887 | 1.87 | 2,042 | 8.97 | ||||
| 2025-08-04 | 13F | Atria Investments Llc | 20,404 | -0.42 | 156 | 6.85 | ||||
| 2025-08-07 | 13F | Sierra Ocean, Llc | 731 | -16.84 | 6 | -16.67 | ||||
| 2025-08-14 | 13F | Prestige Wealth Management Group LLC | 661 | 0.00 | 5 | 25.00 | ||||
| 2025-05-09 | 13F | Headlands Technologies LLC | 0 | -100.00 | 0 | |||||
| 2025-08-14 | 13F | Millennium Management Llc | Call | 0 | -100.00 | 0 | -100.00 | |||
| 2025-08-13 | 13F | Walleye Capital LLC | Call | 0 | -100.00 | 0 | -100.00 | |||
| 2025-08-13 | 13F | Twin Peaks Wealth Advisors, LLC | 323 | 2 | ||||||
| 2025-07-15 | 13F | Ballentine Partners, LLC | 183,254 | 16.11 | 1,402 | 24.20 | ||||
| 2025-08-06 | 13F | Golden State Wealth Management, LLC | 0 | -100.00 | 0 | |||||
| 2025-08-14 | 13F | Ancora Advisors, LLC | 381 | 3 | ||||||
| 2025-07-16 | 13F | Signaturefd, Llc | 232,860 | 6.33 | 1,781 | 13.80 | ||||
| 2025-07-31 | 13F | Caitong International Asset Management Co., Ltd | 0 | -100.00 | 0 | |||||
| 2025-04-29 | 13F | Lee Danner & Bass Inc | 0 | -100.00 | 0 | |||||
| 2025-08-06 | 13F | Valued Wealth Advisors LLC | 423 | 0.00 | 3 | 0.00 | ||||
| 2025-08-14 | 13F | Colony Group, LLC | 16,417 | 22.12 | 126 | 30.21 | ||||
| 2025-05-15 | 13F | Graham Capital Management, L.P. | 0 | -100.00 | 0 | |||||
| 2025-08-12 | 13F | LPL Financial LLC | 58,489 | -5.46 | 447 | 1.13 | ||||
| 2025-08-15 | 13F | CI Private Wealth, LLC | 320,301 | 83.51 | 2,450 | 96.47 | ||||
| 2025-08-13 | 13F | Quadrant Capital Group Llc | 397,602 | 154.54 | 3,042 | 172.49 | ||||
| 2025-07-17 | 13F | CogentBlue Wealth Advisors, LLC | 10,372 | -50.04 | 79 | -46.62 | ||||
| 2025-08-14 | 13F | Susquehanna International Group, Llp | 360,128 | -45.58 | 2,755 | -41.79 | ||||
| 2025-06-30 | NP | VT - Vanguard Total World Stock Index Fund ETF Shares | 51,487 | 0.00 | 362 | 21.89 | ||||
| 2025-08-12 | 13F | Dimensional Fund Advisors Lp | 1,743,615 | 21.75 | 13,339 | 30.27 | ||||
| 2025-08-14 | 13F | Susquehanna International Group, Llp | Call | 20,900 | -94.02 | 160 | -93.63 | |||
| 2025-08-14 | 13F | Susquehanna International Group, Llp | Put | 166,300 | 351.90 | 1,272 | 383.65 | |||
| 2025-08-13 | 13F | Walleye Capital LLC | Put | 51,200 | 25,500.00 | 392 | 39,000.00 | |||
| 2025-08-13 | 13F | Walleye Capital LLC | 688 | -99.05 | 5 | -99.03 | ||||
| 2025-05-12 | 13F | Aigen Investment Management, Lp | 0 | -100.00 | 0 | |||||
| 2025-06-27 | NP | SOXY - YieldMax(TM) Target 12(TM) Semiconductor Option Income ETF | 4,190 | 25.00 | 29 | 52.63 | ||||
| 2025-07-22 | 13F | Valeo Financial Advisors, LLC | 10,683 | 82 | ||||||
| 2025-08-08 | 13F/A | Ignite Planners, LLC | 113,172 | 1.56 | 847 | 8.32 | ||||
| 2025-08-14 | 13F | Banque Transatlantique SA | 0 | -100.00 | 0 | |||||
| 2025-08-13 | 13F | Schroder Investment Management Group | 4,237,787 | -1.45 | 32,419 | 15.10 | ||||
| 2025-05-01 | 13F | Bleakley Financial Group, LLC | 0 | -100.00 | 0 | -100.00 | ||||
| 2025-07-11 | 13F/A | Umb Bank N A/mo | 1,725 | 0.00 | 13 | 8.33 | ||||
| 2025-07-29 | 13F | Private Trust Co Na | 0 | -100.00 | 0 | |||||
| 2025-04-30 | 13F | Banque Pictet & Cie Sa | 0 | -100.00 | 0 | |||||
| 2025-08-15 | 13F | Morgan Stanley | 21,814,127 | 21.18 | 166,878 | 29.65 | ||||
| 2025-04-22 | NP | GINN - Goldman Sachs Innovate Equity ETF | 45,381 | -8.07 | 293 | -12.31 | ||||
| 2025-05-15 | 13F | DZ BANK AG Deutsche Zentral Genossenschafts Bank, Frankfurt am Main | 0 | -100.00 | 0 | |||||
| 2025-08-14 | 13F | Two Sigma Advisers, Lp | 11,700 | -96.64 | 90 | -96.42 | ||||
| 2025-08-14 | 13F | GWM Advisors LLC | 700 | 0.00 | 5 | 0.00 | ||||
| 2025-07-24 | 13F | Jfs Wealth Advisors, Llc | 2,826 | 0.00 | 22 | 5.00 | ||||
| 2025-05-05 | 13F | Lindbrook Capital, Llc | 28,053 | 12.30 | 201 | 23.46 | ||||
| 2025-05-08 | 13F | Harbour Investments, Inc. | 0 | -100.00 | 0 | |||||
| 2025-07-14 | 13F | Abacus Wealth Partners, LLC | 23,169 | 177 | ||||||
| 2025-06-30 | NP | VGTSX - Vanguard Total International Stock Index Fund Investor Shares | 1,006,015 | 0.00 | 7,082 | 21.81 | ||||
| 2025-08-14 | 13F | Rafferty Asset Management, LLC | 8,403,064 | 50.68 | 64,283 | 61.22 | ||||
| 2025-08-12 | 13F | Steward Partners Investment Advisory, Llc | 9 | 0 | ||||||
| 2025-06-30 | NP | VEIEX - Vanguard Emerging Markets Stock Index Fund Investor Shares | 6,767,268 | -4.92 | 47,642 | 15.81 | ||||
| 2025-07-15 | 13F | Foster Victor Wealth Advisors, LLC | 23,578 | -2.06 | 182 | 9.70 | ||||
| 2025-08-13 | 13F | Walleye Trading LLC | 0 | -100.00 | 0 | -100.00 | ||||
| 2025-08-13 | 13F | Walleye Trading LLC | Call | 0 | -100.00 | 0 | -100.00 | |||
| 2025-05-15 | 13F | Bayesian Capital Management, LP | 0 | -100.00 | 0 | |||||
| 2025-08-11 | 13F | Citigroup Inc | 3,727,817 | -38.19 | 28,518 | -33.86 | ||||
| 2025-08-14 | 13F | Xponance, Inc. | 17,665 | 0.93 | 135 | 8.00 | ||||
| 2025-08-07 | 13F | Hennion & Walsh Asset Management, Inc. | 160,373 | -12.49 | 1,227 | -6.41 | ||||
| 2025-08-14 | 13F | Smartleaf Asset Management LLC | 3,574 | 27 | ||||||
| 2025-07-31 | 13F | Buckingham Strategic Partners | 24,685 | -33.24 | 189 | -28.79 | ||||
| 2025-08-29 | NP | FRDM - Freedom 100 Emerging Markets ETF | 1,191,434 | 16.76 | 9,114 | 24.92 | ||||
| 2025-05-14 | 13F | Credit Agricole S A | 210 | 0.00 | 2 | 0.00 | ||||
| 2025-08-13 | 13F | Victory Capital Management Inc | 104,945 | 0.00 | 803 | 6.93 | ||||
| 2025-06-27 | NP | SPTE - SP Funds S&P Global Technology ETF | 63,394 | -37.72 | 446 | -24.15 | ||||
| 2025-07-08 | 13F | Parallel Advisors, LLC | 132,375 | 17.06 | 1,013 | 25.56 | ||||
| 2025-08-14 | 13F | Toroso Investments, LLC | 110,375 | 24.76 | 844 | 33.54 | ||||
| 2025-06-30 | NP | VEU - Vanguard FTSE All-World ex-US Index Fund ETF Shares | 2,283,026 | 0.00 | 16,073 | 21.80 | ||||
| 2025-08-14 | 13F | Wells Fargo & Company/mn | 5,800 | 74.54 | 44 | 91.30 | ||||
| 2025-08-04 | 13F | Creekmur Asset Management LLC | 1 | 0.00 | 0 | |||||
| 2025-08-01 | 13F | Y-Intercept (Hong Kong) Ltd | 970,407 | 84.38 | 7,424 | 97.26 | ||||
| 2025-08-14 | 13F | KADENSA CAPITAL Ltd | 1,335,392 | 13.63 | 10,216 | 21.58 | ||||
| 2025-08-14 | 13F | Royal Bank Of Canada | 11,471 | 118.70 | 87 | 128.95 | ||||
| 2025-07-14 | 13F | UMA Financial Services, Inc. | 375 | 86.57 | 3 | 100.00 | ||||
| 2025-08-08 | 13F | Larson Financial Group LLC | 745 | 6 | ||||||
| 2025-07-30 | 13F | Ethic Inc. | 343,574 | -0.01 | 2,639 | 10.01 | ||||
| 2025-05-14 | 13F | Groupama Asset Managment | 0 | -100.00 | 0 | |||||
| 2025-08-08 | 13F | Candriam Luxembourg S.C.A. | 28,764 | 0.00 | 220 | 7.32 | ||||
| 2025-08-07 | 13F | Profund Advisors Llc | 122,831 | 2.61 | 940 | 9.82 | ||||
| 2025-07-29 | NP | RBB FUND, INC. - Aquarius International Fund | 36,418 | 0.00 | 277 | 18.38 | ||||
| 2025-08-08 | 13F | Creative Planning | 1,689,542 | 33.98 | 12,925 | 43.35 | ||||
| 2025-07-28 | 13F | Moran Wealth Management, LLC | 672,124 | 1.63 | 5,142 | 8.74 | ||||
| 2025-08-12 | 13F | Mizuho Securities Co. Ltd. | 501 | 4 | ||||||
| 2025-08-06 | 13F | Savant Capital, LLC | 29,336 | 224 | ||||||
| 2025-08-28 | NP | SPGM - SPDR(R) Portfolio MSCI Global Stock Market ETF | 85,532 | 2.96 | 654 | 10.29 | ||||
| 2025-07-11 | 13F | Farther Finance Advisors, LLC | 4,240 | -14.86 | 32 | -5.88 | ||||
| 2025-08-12 | 13F | Advisors Asset Management, Inc. | 235,539 | 10.30 | 1,802 | 18.02 | ||||
| 2025-08-14 | 13F | Wetherby Asset Management Inc | 326,804 | 12.33 | 2,502 | 32.47 | ||||
| 2025-07-31 | 13F | Resonant Capital Advisors, LLC | 14,592 | 119 | ||||||
| 2025-08-12 | 13F | Clear Street Markets Llc | Put | 200 | 2 | |||||
| 2025-08-12 | 13F | Clear Street Markets Llc | 5,600 | 43 | ||||||
| 2025-08-14 | 13F | Silvercrest Asset Management Group Llc | 0 | -100.00 | 0 | |||||
| 2025-07-22 | 13F | Valley National Advisers Inc | 0 | -100.00 | 0 | |||||
| 2025-03-28 | NP | HAOSX - Harbor Overseas Fund Institutional Class | 52,590 | -26.82 | 304 | -38.29 | ||||
| 2025-08-08 | 13F | Mitsubishi UFJ Trust & Banking Corp | 10,300 | 79 | ||||||
| 2025-08-13 | 13F | Capital Fund Management S.a. | 35,800 | 274 | ||||||
| 2025-07-25 | 13F | LRI Investments, LLC | 364 | 0.00 | 3 | 0.00 | ||||
| 2025-06-26 | NP | DEXC - Dimensional Emerging Markets ex China Core Equity ETF | 76,000 | 18.75 | 535 | 44.99 | ||||
| 2025-05-15 | 13F | CAPROCK Group, Inc. | 115,769 | -10.28 | 828 | -1.19 | ||||
| 2025-07-30 | NP | AIS - VistaShares Artificial Intelligence Supercycle ETF | 4,991 | 187.50 | 38 | 236.36 | ||||
| 2025-08-04 | 13F | Migdal Insurance & Financial Holdings Ltd. | 0 | -100.00 | 0 | |||||
| 2025-08-05 | 13F | NewSquare Capital LLC | 1,052 | -10.09 | 8 | 0.00 | ||||
| 2025-08-11 | 13F | EntryPoint Capital, LLC | 18,812 | -3.71 | 144 | 2.88 | ||||
| 2025-08-12 | 13F | Jpmorgan Chase & Co | Call | 0 | -100.00 | 0 | -100.00 | |||
| 2025-08-01 | 13F | Envestnet Asset Management Inc | 90,114 | -4.23 | 689 | 2.53 | ||||
| 2025-06-26 | NP | SGIDX - Steward Global Equity Income Fund Class A | 541,403 | 8.58 | 3,811 | 32.23 | ||||
| 2025-05-08 | 13F | Waldron Private Wealth LLC | 0 | -100.00 | 0 | |||||
| 2025-08-14 | 13F | Bnp Paribas Arbitrage, Sa | Call | 0 | -100.00 | 0 | ||||
| 2025-06-26 | NP | DFAE - Dimensional Emerging Core Equity Market ETF | 357,000 | 4.08 | 2,513 | 26.79 | ||||
| 2025-08-12 | 13F | Prudential Financial Inc | 23,570 | 0.00 | 180 | 7.14 | ||||
| 2025-08-28 | NP | SPEM - SPDR(R) Portfolio Emerging Markets ETF | 3,729,594 | 8.86 | 28,531 | 16.47 | ||||
| 2025-05-16 | 13F | Coppell Advisory Solutions LLC | 0 | -100.00 | 0 | |||||
| 2025-07-24 | 13F | IFP Advisors, Inc | 535 | 25.59 | 4 | 33.33 | ||||
| 2025-08-14 | 13F | Farringdon Capital, Ltd. | 22,816 | 175 | ||||||
| 2025-08-14 | 13F | Glenmede Investment Management, LP | 27,705 | 212 | ||||||
| 2025-08-14 | 13F | D. E. Shaw & Co., Inc. | 477,789 | -30.38 | 3,655 | -25.50 | ||||
| 2025-08-14 | 13F | Mercer Global Advisors Inc /adv | 43,028 | -5.80 | 329 | 0.92 | ||||
| 2025-08-11 | 13F | Pinnacle Wealth Planning Services, Inc. | 25,754 | -22.00 | 197 | -16.53 | ||||
| 2025-03-31 | NP | GIAX - Nicholas Global Equity and Income ETF | 138,029 | 112.27 | 798 | 79.50 | ||||
| 2025-08-07 | 13F | Aviva Plc | 13,807 | 0.00 | 106 | 7.14 | ||||
| 2025-08-06 | 13F | Commonwealth Equity Services, Llc | 16,120 | -14.72 | 0 | |||||
| 2025-08-12 | 13F | O'shaughnessy Asset Management, Llc | 385,531 | 25.03 | 2,949 | 33.80 | ||||
| 2025-07-22 | 13F | IMC-Chicago, LLC | Call | 0 | -100.00 | 0 | -100.00 | |||
| 2025-08-13 | 13F | Cerity Partners LLC | 242,862 | -25.09 | 1,859 | -19.84 | ||||
| 2025-08-14 | 13F | UBS Group AG | 16,888,821 | 9.34 | 129,199 | 16.98 | ||||
| 2025-08-14 | 13F | UBS Group AG | Call | 50,000 | 382 | |||||
| 2025-08-11 | 13F | Bell Investment Advisors, Inc | 1,176 | 72.18 | 9 | 100.00 | ||||
| 2025-07-25 | 13F | JustInvest LLC | 365,708 | 31.80 | 2,798 | 41.05 | ||||
| 2025-07-25 | 13F | Allspring Global Investments Holdings, LLC | 13,281 | -95.19 | 101 | -94.76 | ||||
| 2025-07-30 | NP | APIE - ActivePassive International Equity ETF | 167,502 | -19.75 | 1,275 | -5.35 | ||||
| 2025-08-13 | 13F | Safe Harbor Fiduciary, LLC | 300 | 0.00 | 2 | 0.00 | ||||
| 2025-05-15 | 13F | Bridgefront Capital, LLC | 0 | -100.00 | 0 | |||||
| 2025-08-14 | 13F | Aqr Capital Management Llc | 1,445,478 | 0.69 | 11,058 | 7.73 | ||||
| 2025-07-18 | 13F | Generali Investments CEE, investicni spolecnost, a.s. | 170,779 | 0.00 | 1,306 | 6.96 | ||||
| 2025-07-17 | 13F | Greenleaf Trust | 150,786 | 0.71 | 1,154 | 7.76 | ||||
| 2025-08-04 | 13F | Assetmark, Inc | 680 | 5 | ||||||
| 2025-08-05 | 13F | GPS Wealth Strategies Group, LLC | 768 | 0.00 | 6 | 0.00 | ||||
| 2025-08-11 | 13F | Inspire Advisors, LLC | 18,355 | -5.57 | 140 | 1.45 | ||||
| 2025-08-14 | 13F | Beaird Harris Wealth Management, LLC | 1,000 | 0.00 | 8 | 0.00 | ||||
| 2025-08-07 | 13F | Vise Technologies, Inc. | 192,714 | 614.05 | 1,474 | 742.29 | ||||
| 2025-08-11 | 13F | HighTower Advisors, LLC | 22,054 | -26.87 | 169 | -21.86 | ||||
| 2025-08-29 | NP | SA FUNDS INVESTMENT TRUST - SA Emerging Markets Value Fund | 56,252 | 0.00 | 430 | 6.97 | ||||
| 2025-08-12 | 13F | Pathstone Holdings, LLC | 99,535 | 10.49 | 766 | 18.79 | ||||
| 2025-08-08 | 13F | SBI Securities Co., Ltd. | 11,958 | -1.84 | 91 | 4.60 | ||||
| 2025-06-30 | 13F/A | Deutsche Bank Ag\ | 0 | -100.00 | 0 | |||||
| 2025-07-25 | 13F | Cwm, Llc | 19,213 | -6.41 | 0 | |||||
| 2025-08-14 | 13F | Group One Trading, L.p. | Put | 100 | -97.22 | 1 | -100.00 | |||
| 2025-08-14 | 13F | Group One Trading, L.p. | Call | 73,600 | -69.97 | 563 | -67.87 | |||
| 2025-08-13 | 13F | Northwestern Mutual Wealth Management Co | 1,956 | 15 | ||||||
| 2025-08-19 | 13F | Asset Dedication, LLC | 0 | -100.00 | 0 | |||||
| 2025-08-28 | NP | SOXX - iShares PHLX Semiconductor ETF | 11,448,043 | 0.88 | 87,578 | 7.93 | ||||
| 2025-08-14 | 13F | Group One Trading, L.p. | 521 | 4 | ||||||
| 2025-08-15 | 13F | Tower Research Capital LLC (TRC) | 6,344 | -89.04 | 49 | -88.38 | ||||
| 2025-05-14 | 13F | Renaissance Technologies Llc | 0 | -100.00 | 0 | |||||
| 2025-08-14 | 13F | Aprio Wealth Management, LLC | 22,584 | -2.64 | 173 | 4.24 | ||||
| 2025-08-26 | NP | Profunds - Profund Vp Asia 30 | 68,097 | -7.23 | 521 | -0.76 | ||||
| 2025-08-05 | 13F | Redwood Wealth Management Group, LLC | 36,671 | -9.16 | 281 | -2.78 | ||||
| 2025-08-14 | 13F | Schonfeld Strategic Advisors LLC | 134,341 | -57.36 | 1,028 | -54.40 | ||||
| 2025-08-14 | 13F | Bank Of America Corp /de/ | 7,044,452 | -11.71 | 53,890 | -5.54 | ||||
| 2025-07-25 | 13F | Yousif Capital Management, Llc | 39,941 | 5.84 | 306 | 13.38 | ||||
| 2025-04-24 | 13F | Diversified Trust Co | 0 | -100.00 | 0 | |||||
| 2025-07-14 | 13F | GAMMA Investing LLC | 13,164 | 8.72 | 101 | 16.28 | ||||
| 2025-07-31 | 13F | R Squared Ltd | 0 | -100.00 | 0 | |||||
| 2025-08-12 | 13F | Legal & General Group Plc | 14,134 | 108 | ||||||
| 2025-08-14 | 13F | Sculptor Capital LP | Put | 0 | -100.00 | 0 | ||||
| 2025-08-08 | 13F | Cetera Investment Advisers | 20,211 | 1.75 | 155 | 8.45 | ||||
| 2025-08-14 | 13F | CIBC World Markets Inc. | 17,732 | 19.75 | 136 | 28.57 | ||||
| 2025-08-14 | 13F | Engineers Gate Manager LP | 0 | -100.00 | 0 | |||||
| 2025-08-14 | 13F | Sculptor Capital LP | 0 | -100.00 | 0 | |||||
| 2025-08-13 | 13F | Mackenzie Financial Corp | 72,734 | -64.36 | 556 | -61.89 | ||||
| 2025-05-01 | 13F | Genesis Investment Management, LLP | 0 | -100.00 | 0 | |||||
| 2025-07-09 | 13F | Sivia Capital Partners, LLC | 29,408 | 25.78 | 225 | 34.13 | ||||
| 2025-07-25 | 13F | Atria Wealth Solutions, Inc. | 23,550 | 87.65 | 187 | 108.99 | ||||
| 2025-08-04 | 13F | Hantz Financial Services, Inc. | 21,456 | 2,160.91 | 0 | |||||
| 2025-08-29 | 13F | Infini Capital Management Ltd | 0 | -100.00 | 0 | |||||
| 2025-08-12 | 13F | Jpmorgan Chase & Co | 1,668,846 | 33.27 | 12,767 | 42.59 | ||||
| 2025-08-14 | 13F | Sei Investments Co | 72,599 | 20.20 | 555 | 28.77 | ||||
| 2025-08-14 | 13F | Citadel Advisors Llc | Call | 27,700 | -5.78 | 212 | 0.48 | |||
| 2025-08-14 | 13F | Citadel Advisors Llc | Put | 64,200 | 13.63 | 491 | 21.84 | |||
| 2025-06-26 | NP | SNTKX - Steward International Enhanced Index Fund Class A | 136,133 | 0.00 | 958 | 21.88 | ||||
| 2025-08-14 | 13F | Verition Fund Management LLC | 62,081 | -76.45 | 475 | -74.84 | ||||
| 2025-08-14 | 13F | Quantinno Capital Management LP | 346,994 | 37.44 | 2,655 | 47.04 | ||||
| 2025-07-11 | 13F | Annex Advisory Services, LLC | 0 | -100.00 | 0 | |||||
| 2025-08-14 | 13F | Citadel Advisors Llc | 592,879 | -77.23 | 4,536 | -75.64 | ||||
| 2025-07-28 | 13F | Bayforest Capital Ltd | 19,329 | 148 | ||||||
| 2025-05-02 | 13F | Apollon Wealth Management, LLC | 0 | -100.00 | 0 | |||||
| 2025-05-06 | 13F | Venturi Wealth Management, LLC | 0 | -100.00 | 0 | |||||
| 2025-05-14 | 13F | Boston Private Wealth Llc | 0 | -100.00 | 0 | |||||
| 2025-07-30 | 13F | FNY Investment Advisers, LLC | 1,400 | 0 | ||||||
| 2025-07-16 | 13F | Highline Wealth Partners Llc | 725 | 16.56 | 6 | 25.00 | ||||
| 2025-08-11 | 13F | Lsv Asset Management | 565,611 | -2.09 | 4 | 0.00 | ||||
| 2025-08-13 | 13F | Baird Financial Group, Inc. | 525,406 | -2.91 | 4,019 | 3.88 | ||||
| 2025-07-23 | 13F | High Note Wealth, LLC | 28 | 0.00 | 0 | |||||
| 2025-08-13 | 13F | BCJ Capital Management, LLC | 11,246 | 86 | ||||||
| 2025-09-04 | 13F/A | Advisor Group Holdings, Inc. | 14,756 | 11.45 | 113 | 19.15 | ||||
| 2025-07-24 | 13F | Leo Wealth, LLC | 14,471 | 32.02 | 111 | 41.03 | ||||
| 2025-08-11 | 13F | Brown Brothers Harriman & Co | 558 | 4 | ||||||
| 2025-05-14 | 13F | Van Hulzen Asset Management, LLC | 0 | -100.00 | 0 | |||||
| 2025-08-05 | 13F | Bridgewater Advisors Inc. | 75,594 | -2.19 | 538 | 0.75 | ||||
| 2025-06-26 | NP | DFEM - Dimensional Emerging Markets Core Equity 2 ETF | 188,000 | 2.17 | 1,324 | 24.46 | ||||
| 2025-07-31 | 13F | Cambridge Investment Research Advisors, Inc. | 76,135 | -0.43 | 1 | |||||
| 2025-08-08 | 13F | Crossmark Global Holdings, Inc. | 1,281,177 | 1.85 | 9,801 | 8.98 | ||||
| 2025-08-07 | 13F | Acadian Asset Management Llc | 314,993 | 93.97 | 2 | 100.00 | ||||
| 2025-05-01 | 13F | Schechter Investment Advisors, LLC | 15,635 | -25.62 | 112 | -18.38 | ||||
| 2025-07-25 | 13F | Natural Investments, Llc | 16,309 | 41.66 | 0 | |||||
| 2025-07-21 | 13F | Ascent Group, LLC | 18,153 | 139 | ||||||
| 2025-06-26 | NP | Dfa Investment Trust Co - The Emerging Markets Series This fund is a listed as child fund of Dimensional Fund Advisors Lp and if that institution has disclosed ownership in this security, then these positions will not be double counted when calculating total shares and total value | 59,082 | 0.00 | 416 | 21.70 | ||||
| 2025-07-14 | 13F | Foster Group, Inc. | 43,350 | 3.04 | 332 | 10.33 | ||||
| 2025-08-07 | 13F | Verus Capital Partners, Llc | 38,900 | 2.10 | 298 | 9.19 | ||||
| 2025-08-11 | 13F | Private Advisor Group, LLC | 0 | -100.00 | 0 | |||||
| 2025-04-30 | 13F | Rehmann Capital Advisory Group | 0 | -100.00 | 0 | |||||
| 2025-08-01 | 13F | May Hill Capital, LLC | 12,460 | 95 | ||||||
| 2025-08-14 | 13F | Jane Street Group, Llc | Put | 780,000 | -0.36 | 5,967 | 6.61 | |||
| 2025-07-30 | 13F | Eqis Capital Management, Inc. | 23,376 | -6.00 | 179 | 0.56 | ||||
| 2025-04-17 | 13F | Vista Wealth Management Group, LLC | 12,426 | 89 | ||||||
| 2025-05-15 | 13F | Glenmede Trust Co Na | 28,216 | -28.44 | 202 | -21.18 | ||||
| 2025-05-12 | 13F | Virtu Financial LLC | 0 | -100.00 | 0 | |||||
| 2025-05-08 | 13F | XTX Topco Ltd | 0 | -100.00 | 0 | |||||
| 2025-08-28 | NP | JINTX - Johnson International Fund | 29,000 | -32.24 | 222 | -27.78 | ||||
| 2025-08-14 | 13F | Ariadne Wealth Management, LP | 32,625 | -3.57 | 223 | -11.51 | ||||
| 2025-08-14 | 13F | Two Sigma Investments, Lp | 378,628 | -70.52 | 2,897 | -68.46 | ||||
| 2025-07-23 | 13F | Shell Asset Management Co | 0 | 0 | ||||||
| 2025-08-15 | 13F | WealthCollab, LLC | 779 | 6.86 | 6 | 0.00 | ||||
| 2025-08-13 | 13F | Rsm Us Wealth Management Llc | 0 | -100.00 | 0 | |||||
| 2025-08-13 | 13F | GeoWealth Management, LLC | 14,251 | -19.59 | 109 | -13.49 | ||||
| 2025-08-14 | 13F | Mariner, LLC | 186,692 | 83.86 | 1,428 | 97.51 | ||||
| 2025-08-13 | 13F | Hsbc Holdings Plc | 0 | -100.00 | 0 | |||||
| 2025-08-14 | 13F | Barometer Capital Management Inc. | 15,447 | 0.00 | 118 | 7.27 | ||||
| 2025-07-24 | 13F | Ronald Blue Trust, Inc. | 99,341 | 27.89 | 760 | 36.76 | ||||
| 2025-04-28 | 13F | North of South Capital LLP | 0 | -100.00 | 0 | |||||
| 2025-07-29 | 13F | Wealthstream Advisors, Inc. | 25,205 | 53.08 | 193 | 64.10 | ||||
| 2025-07-30 | 13F | Cullen/frost Bankers, Inc. | 0 | -100.00 | 0 | |||||
| 2025-08-14 | 13F | Bnp Paribas Arbitrage, Sa | 1,486,004 | -11.08 | 11,368 | -4.86 | ||||
| 2025-06-27 | NP | SPWO - SP Funds S&P World (ex-US) ETF | 19,843 | 13.50 | 140 | 37.62 | ||||
| 2025-07-25 | 13F | Verdence Capital Advisors LLC | 12,014 | 9.08 | 92 | 16.67 | ||||
| 2025-08-05 | 13F | Simplex Trading, Llc | Put | 7,200 | -50.34 | 0 | ||||
| 2025-08-05 | 13F | Simplex Trading, Llc | 4,038 | -68.30 | 0 | |||||
| 2025-08-11 | 13F | United Capital Financial Advisers, Llc | 17,332 | 5.52 | 133 | 12.82 | ||||
| 2025-08-05 | 13F | Simplex Trading, Llc | Call | 37,400 | -19.57 | 0 | ||||
| 2025-08-08 | 13F | Pnc Financial Services Group, Inc. | 105,368 | 16.42 | 806 | 24.57 | ||||
| 2025-08-14 | 13F | Ieq Capital, Llc | 81,253 | 192.59 | 622 | 213.64 | ||||
| 2025-08-13 | 13F | Northern Trust Corp | 3,616,436 | 8.44 | 27,666 | 16.02 | ||||
| 2025-08-07 | 13F | BOK Financial Private Wealth, Inc. | 0 | -100.00 | 0 | |||||
| 2025-04-14 | 13F | IMC-Chicago, LLC | Put | 0 | -100.00 | 0 | -100.00 | |||
| 2025-08-12 | 13F | Franklin Resources Inc | 24,735 | 37.86 | 189 | 47.66 | ||||
| 2025-08-14 | 13F | Maple Rock Capital Partners Inc. | 3,140,443 | 24,024 | ||||||
| 2025-07-25 | 13F | Wealth Architects, LLC | 14,981 | 0.11 | 115 | 6.54 | ||||
| 2025-08-14 | 13F | Parallax Volatility Advisers, L.P. | Put | 20,000 | 0.00 | 153 | 6.99 | |||
| 2025-08-14 | 13F | Evergreen Capital Management Llc | 44,198 | 362 | ||||||
| 2025-06-26 | NP | DFEV - Dimensional Emerging Markets Value ETF | 308,787 | 9.72 | 2,174 | 33.64 | ||||
| 2025-07-17 | 13F | Sound Income Strategies, LLC | 200 | 0.00 | 2 | 0.00 | ||||
| 2025-08-27 | NP | RYSIX - Electronics Fund Investor Class | 107,029 | -7.64 | 819 | -1.21 | ||||
| 2025-04-14 | 13F | IMC-Chicago, LLC | 0 | -100.00 | 0 | -100.00 | ||||
| 2025-08-14 | 13F | Tcw Group Inc | 81,253 | -18.55 | 622 | -12.90 | ||||
| 2025-08-14 | 13F | Parallax Volatility Advisers, L.P. | 6,198 | -41.52 | 47 | -37.33 | ||||
| 2025-06-26 | NP | HTECX - Hennessy Technology Fund Investor Class | 14,908 | -25.82 | 105 | -10.34 | ||||
| 2025-06-23 | NP | UUPIX - Ultraemerging Markets Profund Investor Class | 9,621 | 9.48 | 68 | 34.00 | ||||
| 2025-07-17 | 13F | Nelson, Van Denburg & Campbell Wealth Management Group, LLC | 14,367 | -28.40 | 110 | -23.78 | ||||
| 2025-07-21 | 13F | Qrg Capital Management, Inc. | 66,027 | 4.13 | 505 | 11.48 | ||||
| 2025-08-14 | 13F | Balyasny Asset Management Llc | 463,477 | 18.69 | 3,546 | 27.02 | ||||
| 2025-07-15 | 13F | Fifth Third Bancorp | 398 | 0.00 | 3 | 50.00 | ||||
| 2025-08-05 | 13F | Bank Of Montreal /can/ | 16,842 | -5.90 | 129 | 0.79 | ||||
| 2025-08-06 | 13F | True Wealth Design, LLC | 359 | -44.85 | 3 | -50.00 | ||||
| 2025-08-14 | 13F | Voloridge Investment Management, Llc | 0 | -100.00 | 0 | |||||
| 2025-05-13 | 13F | Wellington Management Group Llp | 0 | -100.00 | 0 | -100.00 | ||||
| 2025-08-12 | 13F | Rhumbline Advisers | 716,330 | -0.31 | 5,480 | 6.66 | ||||
| 2025-06-26 | NP | DEHP - Dimensional Emerging Markets High Profitability ETF | 56,218 | -10.36 | 396 | 9.12 | ||||
| 2025-08-27 | NP | RMEAX - Aspiriant Risk-Managed Equity Allocation Fund Advisor Shares | 62,250 | -6.60 | 476 | 0.00 | ||||
| 2025-07-28 | 13F | Ritholtz Wealth Management | 87,663 | 2.36 | 671 | 9.48 | ||||
| 2025-08-07 | 13F | Allworth Financial LP | 7,000 | 6.48 | 54 | 17.78 | ||||
| 2025-08-04 | 13F | Savvy Advisors, Inc. | 0 | -100.00 | 0 | |||||
| 2025-07-03 | 13F | Garde Capital, Inc. | 200 | 2 | ||||||
| 2025-07-22 | 13F | Cedar Mountain Advisors, LLC | 1,000 | 0.00 | 8 | 0.00 | ||||
| 2025-08-14 | 13F | Raymond James Financial Inc | 35,610 | -22.68 | 272 | -17.33 | ||||
| 2025-08-08 | 13F | Wiser Advisor Group LLC | 0 | -100.00 | 0 | |||||
| 2025-04-11 | 13F | First Affirmative Financial Network | 36,935 | 55.89 | 264 | 72.55 | ||||
| 2025-06-30 | NP | AIM INTERNATIONAL MUTUAL FUNDS (INVESCO INTERNATIONAL MUTUAL FUNDS) - Invesco Oppenheimer Global Multi-Asset Growth Fund Class R6 | 7,909 | 35.08 | 56 | 66.67 | ||||
| 2025-08-28 | NP | CWI - SPDR(R) MSCI ACWI EX-US ETF | 206,513 | -10.95 | 1,580 | -4.76 | ||||
| 2025-05-05 | 13F | Transce3nd, LLC | 0 | -100.00 | 0 |