Basic Stats
| Institutional Owners | 154 total, 154 long only, 0 short only, 0 long/short - change of -3.14% MRQ |
| Average Portfolio Allocation | 0.1516 % - change of 7.96% MRQ |
| Institutional Shares (Long) | 19,188,172 (ex 13D/G) - change of 0.22MM shares 1.15% MRQ |
| Institutional Value (Long) | $ 377,071 USD ($1000) |
Institutional Ownership and Shareholders
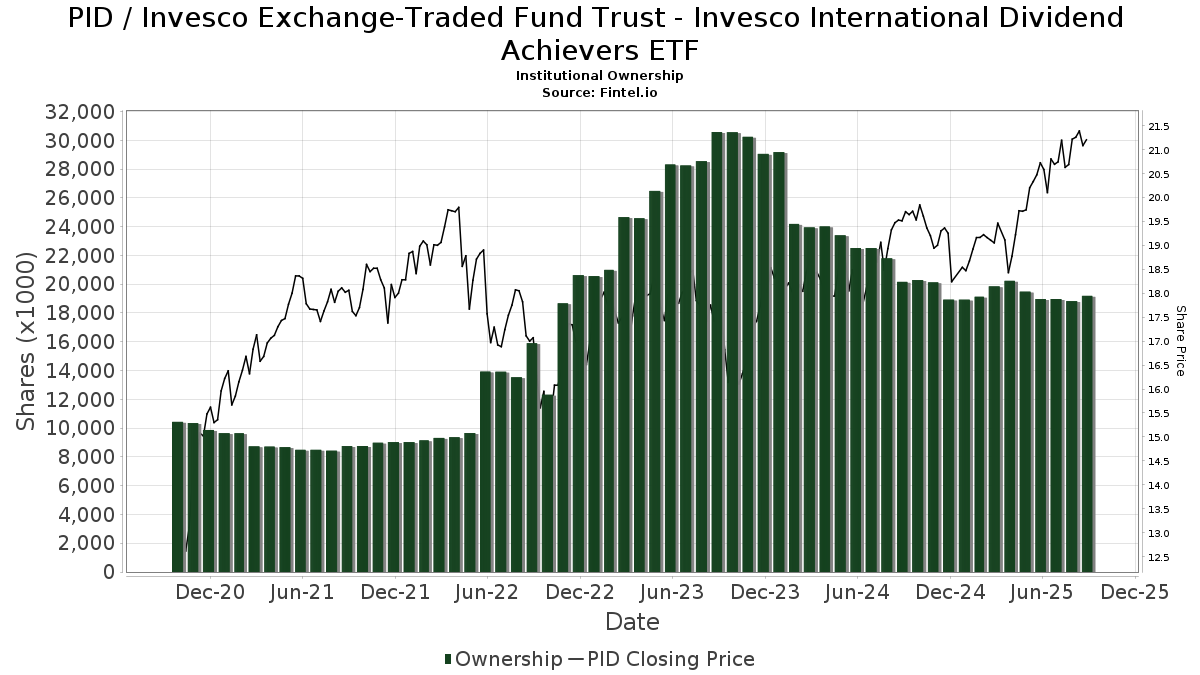
Invesco Exchange-Traded Fund Trust - Invesco International Dividend Achievers ETF (US:PID) has 154 institutional owners and shareholders that have filed 13D/G or 13F forms with the Securities Exchange Commission (SEC). These institutions hold a total of 19,188,172 shares. Largest shareholders include Morgan Stanley, Wells Fargo & Company/mn, LPL Financial LLC, Modern Wealth Management, LLC, Kaye Capital Management, Strategic Wealth Partners, Ltd., UBS Group AG, Bank Of America Corp /de/, Ameriprise Financial Inc, and Jones Financial Companies Lllp .
Invesco Exchange-Traded Fund Trust - Invesco International Dividend Achievers ETF (NasdaqGM:PID) institutional ownership structure shows current positions in the company by institutions and funds, as well as latest changes in position size. Major shareholders can include individual investors, mutual funds, hedge funds, or institutions. The Schedule 13D indicates that the investor holds (or held) more than 5% of the company and intends (or intended) to actively pursue a change in business strategy. Schedule 13G indicates a passive investment of over 5%.
The share price as of September 10, 2025 is 21.20 / share. Previously, on September 11, 2024, the share price was 19.51 / share. This represents an increase of 8.64% over that period.
Fund Sentiment Score
The Fund Sentiment Score (fka Ownership Accumulation Score) finds the stocks that are being most bought by funds. It is the result of a sophisticated, multi-factor quantitative model that identifies companies with the highest levels of institutional accumulation. The scoring model uses a combination of the total increase in disclosed owners, the changes in portfolio allocations in those owners and other metrics. The number ranges from 0 to 100, with higher numbers indicating a higher level of accumulation to its peers, and 50 being the average.
Update Frequency: Daily
See Ownership Explorer, which provides a list of highest-ranking companies.
Institutional Put/Call Ratio
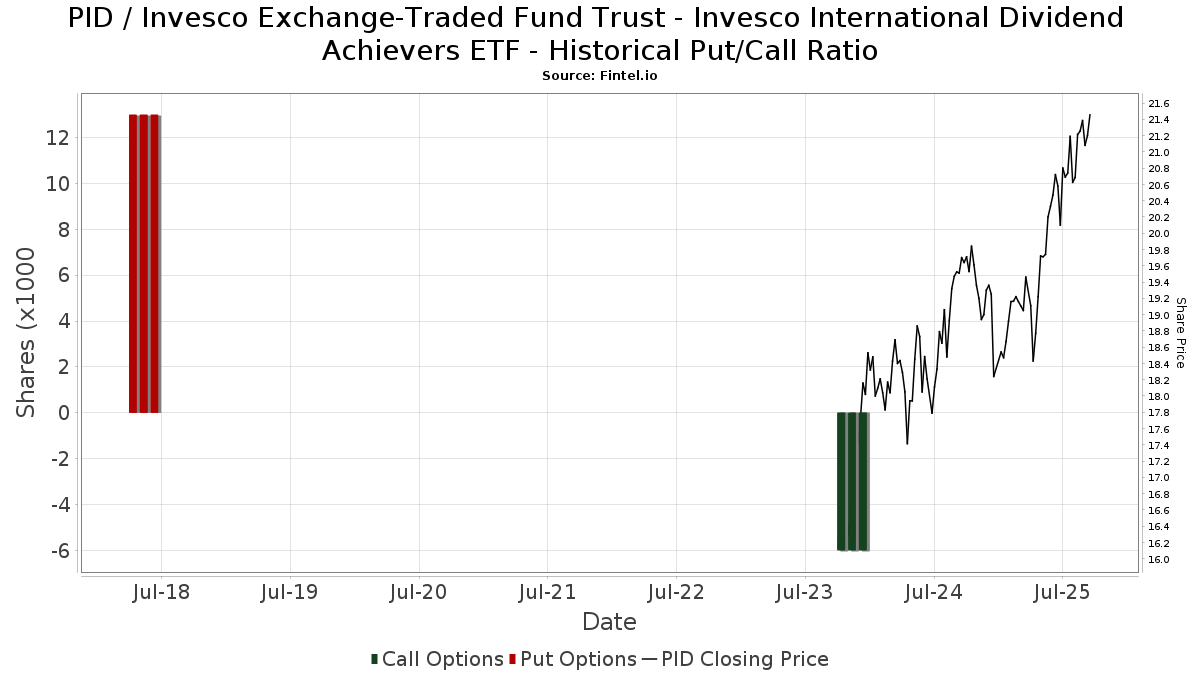
In addition to reporting standard equity and debt issues, institutions with more than 100MM assets under management must also disclose their put and call option holdings. Since put options generally indicate negative sentiment, and call options indicate positive sentiment, we can get a sense of the overall institutional sentiment by plotting the ratio of puts to calls. The chart to the right plots the historical put/call ratio for this instrument.
Using Put/Call Ratio as an indicator of investor sentiment overcomes one of the key deficiencies of using total institutional ownership, which is that a significant amount of assets under management are invested passively to track indices. Passively-managed funds do not typically buy options, so the put/call ratio indicator more closely tracks the sentiment of actively-managed funds.
13F and NPORT Filings
Detail on 13F filings are free. Detail on NP filings require a premium membership. Green rows indicate new positions. Red rows indicate closed positions. Click the link icon to see the full transaction history.
Upgrade
to unlock premium data and export to Excel ![]() .
.
| File Date | Source | Investor | Type | Avg Price (Est) |
Shares | Δ Shares (%) |
Reported Value ($1000) |
Δ Value (%) |
Port Alloc (%) |
|
|---|---|---|---|---|---|---|---|---|---|---|
| 2025-07-28 | 13F | Nestegg Advisors, Inc. | 55,957 | 1.56 | 1,147 | 9.24 | ||||
| 2025-08-14 | 13F | Jane Street Group, Llc | 0 | -100.00 | 0 | |||||
| 2025-08-04 | 13F | Center for Financial Planning, Inc. | 1,521 | 0.00 | 31 | 6.90 | ||||
| 2025-07-10 | 13F | Wealth Enhancement Advisory Services, Llc | 343,747 | -5.46 | 7,167 | 3.38 | ||||
| 2025-08-11 | 13F | Aptus Capital Advisors, LLC | 1,029 | 0.00 | 21 | 10.53 | ||||
| 2025-08-19 | 13F | National Asset Management, Inc. | 0 | -100.00 | 0 | |||||
| 2025-07-23 | 13F | Bellevue Asset Management, Llc | 359 | 1.41 | 7 | 16.67 | ||||
| 2025-08-08 | 13F | Capital Investment Advisory Services, LLC | 12,563 | 0.00 | 258 | 7.53 | ||||
| 2025-08-14 | 13F | Financial Advisory Service, Inc. | 996 | 1.32 | 20 | 11.11 | ||||
| 2025-08-18 | 13F/A | National Bank Of Canada /fi/ | 1,660 | -28.14 | 34 | -23.26 | ||||
| 2025-07-14 | 13F | GAMMA Investing LLC | 1,792 | 0.00 | 37 | 5.88 | ||||
| 2025-08-08 | 13F | Cetera Investment Advisers | 119,140 | -1.27 | 2,442 | 6.13 | ||||
| 2025-08-14 | 13F | Comerica Bank | 17,994 | 38.79 | 369 | 48.99 | ||||
| 2025-08-04 | 13F | Assetmark, Inc | 12 | 0 | ||||||
| 2025-08-07 | 13F | Addison Advisors LLC | 720 | -5.26 | 15 | 0.00 | ||||
| 2025-07-11 | 13F | Coastwise Capital Group, LLC | 10,408 | -0.14 | 213 | 7.58 | ||||
| 2025-08-15 | 13F | Kestra Advisory Services, LLC | 31,098 | 54.92 | 638 | 66.75 | ||||
| 2025-08-13 | 13F | Continuum Advisory, LLC | 76,691 | 21.96 | 1,572 | 31.11 | ||||
| 2025-08-14 | 13F | Modern Wealth Management, LLC | 1,008,078 | 20,666 | ||||||
| 2025-08-08 | 13F | Emerald Investment Partners, Llc | 40,425 | -1.62 | 829 | 5.75 | ||||
| 2025-07-18 | 13F | SimpliFi, Inc. | 22,238 | 1.29 | 456 | 8.85 | ||||
| 2025-05-12 | 13F | Sandy Spring Bank | 27,382 | 0.00 | 522 | 4.19 | ||||
| 2025-07-15 | 13F | North Star Investment Management Corp. | 0 | -100.00 | 0 | |||||
| 2025-08-14 | 13F | Visionary Wealth Advisors | 13,876 | 0.00 | 284 | 7.58 | ||||
| 2025-07-24 | 13F | Stonebridge Financial Group, LLC | 0 | -100.00 | 0 | |||||
| 2025-05-13 | 13F | Tocqueville Asset Management L.p. | 0 | -100.00 | 0 | -100.00 | ||||
| 2025-08-11 | 13F | HighTower Advisors, LLC | 193,351 | 1.17 | 3,964 | 8.75 | ||||
| 2025-08-13 | 13F | Cheviot Value Management, LLC | 131,064 | 3.92 | 2,733 | 10.47 | ||||
| 2025-07-23 | 13F | Eagle Strategies LLC | 44,024 | -13.32 | 902 | -6.82 | ||||
| 2025-08-11 | 13F | Western Wealth Management, LLC | 12,794 | 0.66 | 262 | 8.26 | ||||
| 2025-07-16 | 13F | Signature Resources Capital Management, LLC | 65 | 0.00 | 1 | 0.00 | ||||
| 2025-08-14 | 13F | Wiley Bros.-aintree Capital, Llc | 81,924 | -21.56 | 1,674 | -15.75 | ||||
| 2025-05-13 | 13F | High Falls Advisors, Inc | 0 | -100.00 | 0 | |||||
| 2025-07-31 | 13F | BIP Wealth, LLC | 21,800 | -11.02 | 447 | -4.50 | ||||
| 2025-04-29 | 13F | Element Wealth, LLC | 0 | -100.00 | 0 | |||||
| 2025-08-13 | 13F | VestGen Advisors, LLC | 112,166 | -1.19 | 2,302 | 6.38 | ||||
| 2025-05-05 | 13F | Riverchase Wealth Management, Llc | 0 | -100.00 | 0 | |||||
| 2025-08-05 | 13F | GHP Investment Advisors, Inc. | 1,710 | 1.30 | 35 | 9.38 | ||||
| 2025-08-05 | 13F | AAFCPAs Wealth Management, LLC | 79,195 | -5.02 | 1,624 | 2.08 | ||||
| 2025-04-21 | 13F | Nelson, Van Denburg & Campbell Wealth Management Group, LLC | 0 | -100.00 | 0 | |||||
| 2025-07-31 | 13F | GLOBALT Investments LLC / GA | 32,079 | -10.30 | 658 | -3.52 | ||||
| 2025-07-08 | 13F | Zrc Wealth Management, Llc | 380 | 0.00 | 8 | 0.00 | ||||
| 2025-08-15 | 13F | Equitable Holdings, Inc. | 452,396 | 11.56 | 9,274 | 19.94 | ||||
| 2025-08-04 | 13F | Flagship Harbor Advisors, Llc | 16,735 | 7.50 | 343 | 15.88 | ||||
| 2025-08-14 | 13F | Qube Research & Technologies Ltd | 21 | 0.00 | 0 | |||||
| 2025-08-07 | 13F | Atala Financial Inc | 11,095 | 227 | ||||||
| 2025-08-12 | 13F | Steward Partners Investment Advisory, Llc | 1,856 | 40.08 | 38 | 52.00 | ||||
| 2025-08-11 | 13F | Private Advisor Group, LLC | 37,794 | -30.99 | 775 | -25.86 | ||||
| 2025-07-28 | 13F | SFG Wealth Management, LLC. | 0 | -100.00 | 0 | |||||
| 2025-05-05 | 13F | Transce3nd, LLC | 0 | -100.00 | 0 | |||||
| 2025-07-18 | 13F | Bartlett & Co. Wealth Management Llc | 265 | 0.00 | 5 | 0.00 | ||||
| 2025-08-12 | 13F | LPL Financial LLC | 1,223,329 | -0.02 | 25,078 | 7.47 | ||||
| 2025-07-25 | 13F | Atria Wealth Solutions, Inc. | 10,836 | 4.33 | 222 | 12.12 | ||||
| 2025-08-11 | 13F | Strategic Wealth Partners, Ltd. | 958,671 | 0.73 | 19,653 | 6.93 | ||||
| 2025-04-23 | 13F | Silver Lake Advisory, LLC | 0 | -100.00 | 0 | |||||
| 2025-07-15 | 13F | BCS Wealth Management | 27,545 | -3.37 | 1 | |||||
| 2025-07-28 | 13F | Mutual Advisors, LLC | 19,440 | -29.28 | 409 | -22.98 | ||||
| 2025-08-07 | 13F | Legacy Financial Advisors, Inc. | 41,118 | 9.51 | 843 | 17.60 | ||||
| 2025-08-08 | 13F | Creative Planning | 112,265 | 4.58 | 2,301 | 12.41 | ||||
| 2025-08-12 | 13F | Proequities, Inc. | 0 | 0 | ||||||
| 2025-07-31 | 13F | Oak Harbor Wealth Partners, Llc | 187 | 4 | ||||||
| 2025-08-13 | 13F | Capital Analysts, Inc. | 42,898 | 0.44 | 1 | |||||
| 2025-07-17 | 13F | Wagner Wealth Management, Llc | 902 | -2.80 | 18 | 5.88 | ||||
| 2025-08-01 | 13F | Envestnet Asset Management Inc | 219,472 | -4.64 | 4,499 | 2.51 | ||||
| 2025-08-05 | 13F | Alexander Randolph Advisory Inc | 25,256 | 0.04 | 518 | 7.48 | ||||
| 2025-08-12 | 13F | Cynosure Management, Llc | 24,523 | 0.00 | 503 | 7.49 | ||||
| 2025-08-13 | 13F | Northwestern Mutual Wealth Management Co | 254,266 | 0.24 | 5,212 | 7.75 | ||||
| 2025-07-24 | 13F | IFP Advisors, Inc | 2,038 | 0.00 | 42 | 7.89 | ||||
| 2025-07-22 | 13F | Accel Wealth Management | 73,810 | -20.37 | 1,513 | -14.37 | ||||
| 2025-07-30 | 13F | Principle Wealth Partners Llc | 38,262 | 0.00 | 784 | 7.54 | ||||
| 2025-05-13 | 13F/A | Magnolia Capital Advisors Llc | 18,171 | 0.00 | 333 | 2.15 | ||||
| 2025-07-11 | 13F | Farther Finance Advisors, LLC | 1,424 | 29 | ||||||
| 2025-08-11 | 13F | Principal Securities, Inc. | 3,525 | 8.39 | 72 | 22.03 | ||||
| 2025-07-21 | 13F | Ameritas Advisory Services, LLC | 9,820 | 201 | ||||||
| 2025-07-24 | 13F | Blair William & Co/il | 4,560 | 0.00 | 93 | 8.14 | ||||
| 2025-08-13 | 13F | Flow Traders U.s. Llc | 96,869 | -46.50 | 2 | -66.67 | ||||
| 2025-07-23 | 13F | Nbt Bank N A /ny | 1,900 | 0.00 | 39 | 5.56 | ||||
| 2025-08-12 | 13F | Global Retirement Partners, LLC | 2,113 | -2.49 | 43 | 10.26 | ||||
| 2025-05-01 | 13F | Schechter Investment Advisors, LLC | 10,274 | 0.00 | 196 | 3.72 | ||||
| 2025-07-22 | 13F | Merit Financial Group, LLC | 36,785 | -4.26 | 754 | 3.01 | ||||
| 2025-07-25 | 13F | NorthRock Partners, LLC | 1,222 | 1.24 | 25 | 8.70 | ||||
| 2025-08-13 | 13F | Cerity Partners LLC | 45,028 | 0.36 | 923 | 7.95 | ||||
| 2025-07-16 | 13F | Strategic Investment Solutions, Inc. /IL | 83 | 1.22 | 2 | 0.00 | ||||
| 2025-08-14 | 13F/A | Rockefeller Capital Management L.P. | 15,959 | 0.15 | 327 | 7.92 | ||||
| 2025-08-15 | 13F | Lantern Wealth Advisors, LLC | 10,000 | 0.00 | 205 | 12.02 | ||||
| 2025-07-24 | 13F | Aurora Private Wealth, Inc. | 0 | -100.00 | 0 | |||||
| 2025-07-08 | 13F | Parallel Advisors, LLC | 1,530 | 0.00 | 31 | 6.90 | ||||
| 2025-05-07 | 13F | Richards, Merrill & Peterson, Inc. | 0 | -100.00 | 0 | |||||
| 2025-08-06 | 13F | Commonwealth Equity Services, Llc | 231,826 | -6.07 | 5 | 0.00 | ||||
| 2025-08-14 | 13F | Wells Fargo & Company/mn | 1,600,290 | -5.04 | 32,806 | 2.08 | ||||
| 2025-08-11 | 13F | First American Trust, Fsb | 117,955 | 2.72 | 2,418 | 10.46 | ||||
| 2025-07-31 | 13F | Cambridge Investment Research Advisors, Inc. | 239,626 | 3.98 | 5 | 0.00 | ||||
| 2025-08-14 | 13F | Federation des caisses Desjardins du Quebec | 15,029 | 0.00 | 308 | 7.69 | ||||
| 2025-08-14 | 13F | GWM Advisors LLC | 67,613 | 0.50 | 1,386 | 8.11 | ||||
| 2025-08-14 | 13F | Bank Of America Corp /de/ | 909,313 | 4.36 | 18,641 | 12.19 | ||||
| 2025-07-23 | 13F | Morton Capital Management LLC/CA | 256,253 | -2.24 | 5,253 | 5.10 | ||||
| 2025-08-14 | 13F | Two Sigma Investments, Lp | 0 | -100.00 | 0 | |||||
| 2025-05-02 | 13F | First Command Advisory Services, Inc. | 0 | -100.00 | 0 | -100.00 | ||||
| 2025-07-18 | 13F | Institute for Wealth Management, LLC. | 50,237 | -2.42 | 1,030 | 4.89 | ||||
| 2025-08-12 | 13F | Founders Financial Alliance, LLC | 9,671 | 0.76 | 198 | 8.20 | ||||
| 2025-07-15 | 13F | Genesis Wealth Advisors, LLC | 10,710 | 0.00 | 220 | 7.35 | ||||
| 2025-08-04 | 13F | Arkadios Wealth Advisors | 23,651 | 485 | ||||||
| 2025-08-12 | 13F | Wood Tarver Financial Group, LLC | 32,964 | -4.14 | 1 | -100.00 | ||||
| 2025-08-14 | 13F | Freedom Financial Partners LLC | 51,884 | 1.05 | 1,064 | 8.58 | ||||
| 2025-08-13 | 13F | Townsquare Capital Llc | 0 | -100.00 | 0 | |||||
| 2025-08-15 | 13F | Northeast Financial Consultants Inc | 61,943 | 0.00 | 1,270 | 7.45 | ||||
| 2025-08-05 | 13F | Bank Of Montreal /can/ | 5,289 | 3.58 | 108 | 11.34 | ||||
| 2025-08-06 | 13F | First Horizon Advisors, Inc. | 28,954 | -21.07 | 594 | -15.16 | ||||
| 2025-08-14 | 13F | Ameriprise Financial Inc | 847,494 | -1.90 | 16,908 | 2.63 | ||||
| 2025-08-14 | 13F | Citadel Advisors Llc | 15,810 | -7.84 | 324 | -0.92 | ||||
| 2025-07-29 | 13F | Private Trust Co Na | 713 | 0.00 | 15 | 7.69 | ||||
| 2025-08-14 | 13F | Guardian Wealth Advisors, Llc / Nc | 1,029 | 0.00 | 21 | 10.53 | ||||
| 2025-07-16 | 13F | Essex Financial Services, Inc. | 17,044 | 0.12 | 349 | 7.72 | ||||
| 2025-08-06 | 13F | AE Wealth Management LLC | 0 | -100.00 | 0 | |||||
| 2025-08-05 | 13F | GPS Wealth Strategies Group, LLC | 1,111 | 1.28 | 23 | 10.00 | ||||
| 2025-08-15 | 13F | Morgan Stanley | 3,131,687 | -9.79 | 64,200 | -3.02 | ||||
| 2025-08-08 | 13F | Gts Securities Llc | 0 | -100.00 | 0 | |||||
| 2025-08-04 | 13F | IFG Advisory, LLC | 30,579 | -0.98 | 627 | 6.46 | ||||
| 2025-08-05 | 13F | Integrity Financial Corp /WA | 273 | 6 | ||||||
| 2025-08-12 | 13F | Park Square Financial Group, LLC | 791 | 0.00 | 16 | 6.67 | ||||
| 2025-08-14 | 13F | Mercer Global Advisors Inc /adv | 0 | -100.00 | 0 | |||||
| 2025-08-05 | 13F | Flynn Zito Capital Management, Llc | 22,001 | 1.29 | 451 | 8.94 | ||||
| 2025-08-05 | 13F | Tsfg, Llc | 6,450 | 0.00 | 0 | |||||
| 2025-08-07 | 13F | Allworth Financial LP | 5,893 | 0.00 | 121 | 5.26 | ||||
| 2025-08-07 | 13F | Cahill Financial Advisors Inc | 227,036 | -2.49 | 4,654 | 4.82 | ||||
| 2025-08-14 | 13F | Mariner, LLC | 123,877 | -0.33 | 2,539 | 7.13 | ||||
| 2025-07-29 | 13F | Stephens Inc /ar/ | 19,800 | 8.79 | 406 | 16.71 | ||||
| 2025-07-31 | 13F | Brinker Capital Investments, LLC | 0 | -100.00 | 0 | -100.00 | ||||
| 2025-07-17 | 13F | Oakworth Capital, Inc. | 0 | -100.00 | 0 | |||||
| 2025-08-12 | 13F | Jpmorgan Chase & Co | 101,861 | 0.03 | 2,088 | 7.57 | ||||
| 2025-07-24 | 13F | Brandywine Oak Private Wealth Llc | 69,911 | 0.00 | 1,433 | 7.50 | ||||
| 2025-08-05 | 13F | Sigma Planning Corp | 14,011 | 20.69 | 287 | 29.86 | ||||
| 2025-08-12 | 13F | SRS Capital Advisors, Inc. | 9,636 | 198 | ||||||
| 2025-08-14 | 13F | UBS Group AG | 912,142 | 0.19 | 18,699 | 7.71 | ||||
| 2025-08-08 | 13F | Pnc Financial Services Group, Inc. | 2,390 | -3.59 | 49 | 2.13 | ||||
| 2025-09-04 | 13F/A | Advisor Group Holdings, Inc. | 322,602 | -6.80 | 6,615 | 0.18 | ||||
| 2025-08-14 | 13F | Fmr Llc | 8,125 | -9.25 | 167 | -2.35 | ||||
| 2025-08-15 | 13F | Captrust Financial Advisors | 12,864 | -2.38 | 264 | 4.78 | ||||
| 2025-08-14 | 13F | Royal Bank Of Canada | 259,480 | -1.19 | 5,320 | 6.25 | ||||
| 2025-07-30 | 13F | Parcion Private Wealth LLC | 63,232 | -1.62 | 1,296 | 5.80 | ||||
| 2025-07-17 | 13F | Sound Income Strategies, LLC | 191 | 0.00 | 4 | 0.00 | ||||
| 2025-07-31 | 13F | Brian Low Financial Group, Llc | 95,371 | 1,955 | ||||||
| 2025-08-01 | 13F | Winebrenner Capital Management Llc | 48,500 | 0.05 | 994 | 7.58 | ||||
| 2025-08-15 | 13F | Tower Research Capital LLC (TRC) | 36 | 1 | ||||||
| 2025-07-22 | 13F | Valley National Advisers Inc | 73 | 0.00 | 0 | |||||
| 2025-07-25 | 13F | Astoria Portfolio Advisors LLC. | 12,210 | 0.00 | 258 | 9.83 | ||||
| 2025-08-07 | 13F | CENTRAL TRUST Co | 733 | 15 | ||||||
| 2025-08-12 | 13F | MAI Capital Management | 1,582 | 0.00 | 32 | 6.67 | ||||
| 2025-03-18 | 13F/A | Bank Of America Corp /de/ | Call | 0 | -100.00 | 0 | -100.00 | |||
| 2025-05-14 | 13F | Susquehanna International Group, Llp | 0 | -100.00 | 0 | |||||
| 2025-08-12 | 13F | Calton & Associates, Inc. | 11,562 | 0.42 | 237 | 8.22 | ||||
| 2025-08-12 | 13F | PSI Advisors, LLC | 0 | -100.00 | 0 | |||||
| 2025-08-06 | 13F | Golden State Wealth Management, LLC | 29,451 | -21.64 | 604 | -15.78 | ||||
| 2025-08-14 | 13F | EP Wealth Advisors, Inc. | 7,560 | 155 | ||||||
| 2025-07-24 | 13F | Us Bancorp \de\ | 2,504 | -7.12 | 51 | 0.00 | ||||
| 2025-07-25 | 13F | Cwm, Llc | 127 | 49.41 | 0 | |||||
| 2025-08-12 | 13F | Kaye Capital Management | 1,008,078 | -6.70 | 20,666 | 0.30 | ||||
| 2025-08-18 | 13F | Geneos Wealth Management Inc. | 4,554 | 0.00 | 93 | 8.14 | ||||
| 2025-07-21 | 13F | DHJJ Financial Advisors, Ltd. | 36 | 0.00 | 1 | |||||
| 2025-08-13 | 13F | Jones Financial Companies Lllp | 551,873 | 54.56 | 11,220 | 64.77 | ||||
| 2025-07-14 | 13F | Southland Equity Partners LLC | 55,478 | -1.57 | 1,137 | 5.87 | ||||
| 2025-07-30 | 13F | Drive Wealth Management, Llc | 29,168 | 3.40 | 598 | 11.17 | ||||
| 2025-07-09 | 13F | Breakwater Capital Group | 40,011 | -2.21 | 820 | 5.13 | ||||
| 2025-07-24 | 13F | JNBA Financial Advisors | 1,025 | 0.00 | 21 | 10.53 | ||||
| 2025-08-21 | 13F | Aveo Capital Partners, LLC | 0 | -100.00 | 0 | |||||
| 2025-07-14 | 13F | Farmers & Merchants Investments Inc | 0 | -100.00 | 0 | |||||
| 2025-07-17 | 13F | Janney Montgomery Scott LLC | 16,447 | 28.37 | 0 | |||||
| 2025-07-29 | 13F | Signature Estate & Investment Advisors Llc | 10,204 | 1.29 | 209 | 8.85 | ||||
| 2025-08-08 | 13F | Kingsview Wealth Management, LLC | 24,685 | -0.02 | 506 | 7.66 | ||||
| 2025-08-08 | 13F | Avantax Advisory Services, Inc. | 36,089 | -9.04 | 740 | -2.25 | ||||
| 2025-07-29 | 13F | Salomon & Ludwin, LLC | 1,212 | 0.00 | 25 | 8.70 | ||||
| 2025-03-12 | 13F/A | Private Capital Management Llc | 0 | -100.00 | 0 | -100.00 | ||||
| 2025-07-24 | 13F | Capital Advisors, Ltd. LLC | 25,741 | -1.94 | 1 | |||||
| 2025-07-29 | 13F | Stratos Wealth Partners, LTD. | 43,934 | 8.41 | 901 | 16.58 | ||||
| 2025-07-21 | 13F | TFG Advisers LLC | 78,852 | 0.58 | 1,616 | 8.09 | ||||
| 2025-08-04 | 13F | Atria Investments Llc | 47,648 | -66.62 | 977 | -64.14 | ||||
| 2025-04-01 | 13F | Massmutual Trust Co Fsb/adv | 0 | -100.00 | 0 | |||||
| 2025-07-10 | 13F | Focus Financial Network, Inc. | 227,498 | 0.52 | 4,664 | 8.06 | ||||
| 2025-05-06 | 13F | Venturi Wealth Management, LLC | 0 | -100.00 | 0 | |||||
| 2025-08-14 | 13F | Raymond James Financial Inc | 205,621 | 6.37 | 4,215 | 14.35 | ||||
| 2025-07-23 | 13F | H&H Retirement Design & Management INC | 79,778 | 8.89 | 1,653 | 19.11 | ||||
| 2025-04-23 | 13F | Fourth Dimension Wealth, LLC | 0 | -100.00 | 0 | |||||
| 2025-07-17 | 13F/A | Capital Investment Advisors, LLC | 58,509 | 0.06 | 1,199 | 7.53 | ||||
| 2025-08-05 | 13F | Dunhill Financial, LLC | 321 | 1.26 | 7 | 0.00 | ||||
| 2025-08-14 | 13F | Mml Investors Services, Llc | 49,196 | -66.65 | 1 | -50.00 | ||||
| 2025-04-30 | 13F | Synergy Investment Management, LLC | 0 | -100.00 | 0 | |||||
| 2025-08-14 | 13F | Stifel Financial Corp | 88,783 | 186.05 | 1,820 | 207.95 |