Basic Stats
| Institutional Owners | 133 total, 131 long only, 1 short only, 1 long/short - change of -5.63% MRQ |
| Average Portfolio Allocation | 0.1609 % - change of -17.07% MRQ |
| Institutional Shares (Long) | 24,428,876 (ex 13D/G) - change of -3.84MM shares -13.54% MRQ |
| Institutional Value (Long) | $ 222,997 USD ($1000) |
Institutional Ownership and Shareholders
PennantPark Floating Rate Capital Ltd. (US:PFLT) has 133 institutional owners and shareholders that have filed 13D/G or 13F forms with the Securities Exchange Commission (SEC). These institutions hold a total of 24,428,876 shares. Largest shareholders include Sound Income Strategies, LLC, Van Eck Associates Corp, BIZD - VanEck Vectors BDC Income ETF, Altshuler Shaham Ltd, Marshall Wace, Llp, UBS Group AG, Invesco Ltd., KBWD - Invesco KBW High Dividend Yield Financial ETF, Two Sigma Investments, Lp, and Qube Research & Technologies Ltd .
PennantPark Floating Rate Capital Ltd. (NYSE:PFLT) institutional ownership structure shows current positions in the company by institutions and funds, as well as latest changes in position size. Major shareholders can include individual investors, mutual funds, hedge funds, or institutions. The Schedule 13D indicates that the investor holds (or held) more than 5% of the company and intends (or intended) to actively pursue a change in business strategy. Schedule 13G indicates a passive investment of over 5%.
The share price as of September 5, 2025 is 10.26 / share. Previously, on September 6, 2024, the share price was 11.44 / share. This represents a decline of 10.31% over that period.

Fund Sentiment Score
The Fund Sentiment Score (fka Ownership Accumulation Score) finds the stocks that are being most bought by funds. It is the result of a sophisticated, multi-factor quantitative model that identifies companies with the highest levels of institutional accumulation. The scoring model uses a combination of the total increase in disclosed owners, the changes in portfolio allocations in those owners and other metrics. The number ranges from 0 to 100, with higher numbers indicating a higher level of accumulation to its peers, and 50 being the average.
Update Frequency: Daily
See Ownership Explorer, which provides a list of highest-ranking companies.
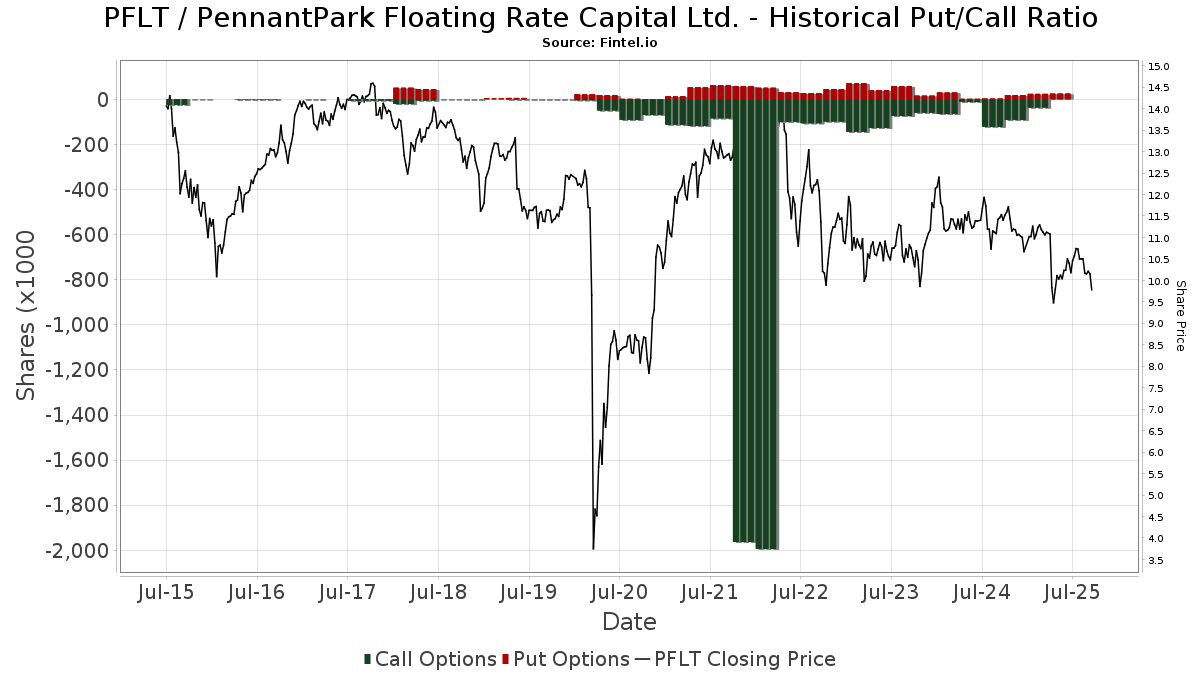
Institutional Put/Call Ratio
In addition to reporting standard equity and debt issues, institutions with more than 100MM assets under management must also disclose their put and call option holdings. Since put options generally indicate negative sentiment, and call options indicate positive sentiment, we can get a sense of the overall institutional sentiment by plotting the ratio of puts to calls. The chart to the right plots the historical put/call ratio for this instrument.
Using Put/Call Ratio as an indicator of investor sentiment overcomes one of the key deficiencies of using total institutional ownership, which is that a significant amount of assets under management are invested passively to track indices. Passively-managed funds do not typically buy options, so the put/call ratio indicator more closely tracks the sentiment of actively-managed funds.
13F and NPORT Filings
Detail on 13F filings are free. Detail on NP filings require a premium membership. Green rows indicate new positions. Red rows indicate closed positions. Click the link icon to see the full transaction history.
Upgrade
to unlock premium data and export to Excel ![]() .
.
| File Date | Source | Investor | Type | Avg Price (Est) |
Shares | Δ Shares (%) |
Reported Value ($1000) |
Δ Value (%) |
Port Alloc (%) |
|
|---|---|---|---|---|---|---|---|---|---|---|
| 2025-08-12 | 13F | Change Path, LLC | 12,006 | 124 | ||||||
| 2025-08-04 | 13F | Muzinich & Co., Inc. | 104,859 | 103.00 | 1,083 | 87.37 | ||||
| 2025-07-29 | 13F | Private Trust Co Na | 2,530 | 0.00 | 26 | -7.14 | ||||
| 2025-07-30 | 13F | FNY Investment Advisers, LLC | 1,200 | 0.00 | 0 | |||||
| 2025-05-15 | 13F | Gwn Securities Inc. | 0 | -100.00 | 0 | -100.00 | ||||
| 2025-08-14 | 13F | Two Sigma Securities, Llc | 0 | -100.00 | 0 | |||||
| 2025-05-14 | 13F | Group One Trading, L.p. | Call | 0 | -100.00 | 0 | -100.00 | |||
| 2025-08-14 | 13F | Van Eck Associates Corp | 2,358,575 | 20.52 | 24 | 14.29 | ||||
| 2025-07-23 | 13F | Fulton Breakefield Broenniman Llc | 11,798 | 0.00 | 122 | -8.33 | ||||
| 2025-08-12 | 13F | Cornerstone Wealth Management, LLC | 64,809 | -12.10 | 669 | -18.91 | ||||
| 2025-08-12 | 13F | LPL Financial LLC | 244,157 | -44.38 | 2,522 | -48.66 | ||||
| 2025-04-22 | 13F | Synergy Financial Management, LLC | 0 | -100.00 | 0 | -100.00 | ||||
| 2025-08-06 | 13F | Commonwealth Equity Services, Llc | 91,475 | 12.50 | 1 | |||||
| 2025-08-11 | 13F | Principal Securities, Inc. | 0 | -100.00 | 0 | |||||
| 2025-05-14 | 13F | Virtus ETF Advisers LLC | 0 | -100.00 | 0 | -100.00 | ||||
| 2025-08-12 | 13F | Trexquant Investment LP | 269,430 | -35.34 | 2,783 | -40.30 | ||||
| 2025-08-07 | 13F | PFG Advisors | 110,108 | 1.81 | 1,137 | -6.03 | ||||
| 2025-07-28 | 13F | BRYN MAWR TRUST Co | 3,363 | 0.00 | 35 | -8.11 | ||||
| 2025-08-05 | 13F | Strategic Financial Concepts, LLC | 63,200 | -1.50 | 648 | -9.76 | ||||
| 2025-08-14 | 13F | D. E. Shaw & Co., Inc. | 0 | -100.00 | 0 | |||||
| 2025-08-13 | 13F | Garner Asset Management Corp | 14,267 | -2.41 | 147 | -9.82 | ||||
| 2025-08-11 | 13F | Pin Oak Investment Advisors Inc | 0 | 0 | ||||||
| 2025-08-08 | 13F | Larson Financial Group LLC | 511 | 41.94 | 5 | 25.00 | ||||
| 2025-08-12 | 13F | Global Retirement Partners, LLC | 3,928 | -79.34 | 41 | -80.68 | ||||
| 2025-08-13 | 13F | Continuum Advisory, LLC | 0 | -100.00 | 0 | |||||
| 2025-04-24 | 13F | Allspring Global Investments Holdings, LLC | 0 | -100.00 | 0 | -100.00 | ||||
| 2025-07-08 | 13F | Parallel Advisors, LLC | 0 | -100.00 | 0 | |||||
| 2025-08-04 | 13F | Creekmur Asset Management LLC | 9 | 12.50 | 0 | |||||
| 2025-08-07 | 13F | Allworth Financial LP | 2,777 | 1,603.68 | 29 | 2,700.00 | ||||
| 2025-08-14 | 13F | Schonfeld Strategic Advisors LLC | 18,126 | 187 | ||||||
| 2025-08-11 | 13F | Empowered Funds, LLC | 10,193 | -8.33 | 105 | -15.32 | ||||
| 2025-07-28 | NP | FXED - Sound Enhanced Fixed Income ETF | 104,495 | 1.12 | 1,076 | -8.11 | ||||
| 2025-04-10 | 13F | Firethorn Wealth Partners, Llc | 0 | -100.00 | 0 | -100.00 | ||||
| 2025-04-23 | 13F | Walkner Condon Financial Advisors LLC | 0 | -100.00 | 0 | -100.00 | ||||
| 2025-07-17 | 13F | Vermillion Wealth Management, Inc. | 500 | 0.00 | 5 | 0.00 | ||||
| 2025-09-04 | 13F/A | Advisor Group Holdings, Inc. | 162,389 | 38.36 | 1,678 | 27.72 | ||||
| 2025-08-13 | 13F | Lido Advisors, LLC | 16,381 | 171 | ||||||
| 2025-08-07 | 13F | Resources Investment Advisors, LLC. | 12,543 | 0.00 | 130 | -7.86 | ||||
| 2025-08-14 | 13F | Aquatic Capital Management LLC | 0 | -100.00 | 0 | |||||
| 2025-08-13 | 13F | Virtus Investment Advisers, Inc. | 88,549 | -10.61 | 915 | -17.51 | ||||
| 2025-08-12 | 13F | BlackRock, Inc. | 500,758 | 30.73 | 5,173 | 20.67 | ||||
| 2025-08-21 | NP | BIZD - VanEck Vectors BDC Income ETF | 2,247,824 | 16.02 | 23,220 | 7.11 | ||||
| 2025-08-06 | 13F | Golden State Wealth Management, LLC | 9,756 | 101 | ||||||
| 2025-08-11 | 13F | Citigroup Inc | 34,398 | 218.56 | 355 | 195.83 | ||||
| 2025-07-10 | 13F | Sovran Advisors, LLC | 34,184 | 2.01 | 361 | 10.77 | ||||
| 2025-08-11 | 13F | Delta Asset Management Llc/tn | 943 | 0.00 | 10 | -10.00 | ||||
| 2025-08-14 | 13F | Mariner, LLC | 13,296 | 137 | ||||||
| 2025-08-13 | 13F | Marshall Wace, Llp | 1,439,742 | -16.75 | 14,873 | -23.15 | ||||
| 2025-08-14 | 13F | Mpwm Advisory Solutions, Llc | 5,000 | 0.00 | 52 | -7.27 | ||||
| 2025-08-14 | 13F | Sunbelt Securities, Inc. | 8,224 | -26.73 | 90 | -28.80 | ||||
| 2025-08-08 | 13F | Investment Partners, Ltd. | 10,000 | 0.00 | 103 | -7.21 | ||||
| 2025-08-14 | 13F | Royal Bank Of Canada | 19,604 | -32.18 | 202 | -37.46 | ||||
| 2025-07-18 | 13F | SOA Wealth Advisors, LLC. | 0 | -100.00 | 0 | |||||
| 2025-08-06 | 13F | AE Wealth Management LLC | 21,641 | 18.74 | 224 | 9.85 | ||||
| 2025-08-14 | 13F | Brevan Howard Capital Management LP | 141,985 | 118.14 | 1,467 | 101.37 | ||||
| 2025-05-08 | 13F | We Are One Seven, LLC | 0 | -100.00 | 0 | -100.00 | ||||
| 2025-08-13 | 13F | Guggenheim Capital Llc | 51,986 | 6.32 | 537 | -1.83 | ||||
| 2025-08-14 | 13F | Financial Network Wealth Advisors LLC | 1,426 | 0.00 | 15 | -6.67 | ||||
| 2025-08-14 | 13F | AllSquare Wealth Management LLC | 9,200 | 0.00 | 95 | -6.86 | ||||
| 2025-08-13 | 13F | Northern Trust Corp | 41,596 | 181.36 | 430 | 160.00 | ||||
| 2025-08-14 | 13F | Glenview Trust Co | 10,650 | 110 | ||||||
| 2025-05-12 | 13F | Simplex Trading, Llc | Call | 0 | -100.00 | 0 | ||||
| 2025-04-29 | 13F | Raleigh Capital Management Inc. | 0 | -100.00 | 0 | -100.00 | ||||
| 2025-08-13 | 13F | M&t Bank Corp | 21,899 | 0.00 | 226 | -7.76 | ||||
| 2025-05-12 | 13F | National Bank Of Canada /fi/ | 0 | -100.00 | 0 | |||||
| 2025-07-18 | 13F | PFG Investments, LLC | 118,908 | 5.61 | 1,228 | -2.46 | ||||
| 2025-05-29 | NP | JAFEX - Total Stock Market Index Trust NAV | 19 | -97.50 | 0 | -100.00 | ||||
| 2025-08-13 | 13F | Quadrature Capital Ltd | 0 | -100.00 | 0 | |||||
| 2025-08-12 | 13F | Entropy Technologies, LP | 12,594 | -80.06 | 130 | -81.59 | ||||
| 2025-06-27 | NP | LBO - WHITEWOLF Publicly Listed Private Equity ETF | 11,119 | 14.28 | 112 | 3.70 | ||||
| 2025-08-12 | 13F | Calton & Associates, Inc. | 10,938 | 113 | ||||||
| 2025-08-08 | 13F | Strategies Wealth Advisors, LLC | 12,921 | 2.96 | 133 | -5.00 | ||||
| 2025-05-08 | 13F | Arkadios Wealth Advisors | 0 | -100.00 | 0 | -100.00 | ||||
| 2025-08-12 | 13F | PSI Advisors, LLC | 0 | -100.00 | 0 | |||||
| 2025-08-13 | 13F | Quantbot Technologies LP | 21,234 | 219 | ||||||
| 2025-08-14 | 13F | Bnp Paribas Arbitrage, Sa | 5,284 | 55 | ||||||
| 2025-08-14 | 13F | Nebula Research & Development LLC | 56,045 | 31.09 | 579 | 20.92 | ||||
| 2025-08-06 | 13F | Yelin Lapidot Holdings Management Ltd. | 19,500 | 0.00 | 201 | -7.80 | ||||
| 2025-05-15 | 13F | Oxford Asset Management Llp | 12,186 | 136 | ||||||
| 2025-08-15 | 13F | Tower Research Capital LLC (TRC) | 358 | -92.84 | 4 | -94.55 | ||||
| 2025-08-14 | 13F | Altshuler Shaham Ltd | 1,730,086 | 9.98 | 17,872 | 1.52 | ||||
| 2025-07-30 | 13F | Mid-American Wealth Advisory Group, Inc. | 485 | 5 | ||||||
| 2025-07-28 | 13F | Harbour Investments, Inc. | 1,000 | 0.00 | 10 | -9.09 | ||||
| 2025-08-13 | 13F | EverSource Wealth Advisors, LLC | 1,452 | 1,257.01 | 15 | 1,300.00 | ||||
| 2025-05-12 | 13F | Fmr Llc | 0 | -100.00 | 0 | |||||
| 2025-08-12 | 13F | Magnetar Financial LLC | 0 | -100.00 | 0 | |||||
| 2025-08-12 | 13F | Advisors Asset Management, Inc. | 329,829 | -0.39 | 3,407 | -8.04 | ||||
| 2025-07-17 | 13F | Sound Income Strategies, LLC | 3,904,625 | 8.91 | 40,335 | 0.54 | ||||
| 2025-08-14 | 13F | Camden Capital, LLC | 26,658 | 0.00 | 275 | -7.72 | ||||
| 2025-07-29 | 13F | TrueMark Investments, LLC | 0 | -100.00 | 0 | -100.00 | ||||
| 2025-08-14 | 13F | Raymond James Financial Inc | 25,177 | -18.34 | 260 | -24.42 | ||||
| 2025-08-11 | 13F | HighTower Advisors, LLC | 95,188 | -1.24 | 983 | -8.81 | ||||
| 2025-08-14 | 13F | Murphy & Mullick Capital Management Corp | 1,038 | 2.67 | 11 | -9.09 | ||||
| 2025-08-14 | 13F | Ameriprise Financial Inc | 69,959 | 7.41 | 707 | -3.28 | ||||
| 2025-08-11 | 13F | NewEdge Wealth, LLC | 295,639 | 3.33 | 3,075 | -3.97 | ||||
| 2025-08-14 | 13F | Hrt Financial Lp | 0 | -100.00 | 0 | |||||
| 2025-08-26 | NP | MCTOX - Modern Capital Tactical Opportunities Fund Class A Shares | 0 | -100.00 | 0 | -100.00 | ||||
| 2025-08-13 | 13F | Russell Investments Group, Ltd. | 0 | -100.00 | 0 | |||||
| 2025-07-17 | 13F | Janney Montgomery Scott LLC | 41,874 | -4.21 | 0 | |||||
| 2025-08-14 | 13F | Balyasny Asset Management Llc | 243,615 | -58.07 | 2,517 | -61.30 | ||||
| 2025-08-14 | 13F | Citadel Advisors Llc | 0 | -100.00 | 0 | |||||
| 2025-04-21 | 13F | Ronald Blue Trust, Inc. | 0 | -100.00 | 0 | -100.00 | ||||
| 2025-08-14 | 13F | Bank Of America Corp /de/ | 14,429 | -3.74 | 149 | -10.78 | ||||
| 2025-08-11 | 13F | Private Advisor Group, LLC | 16,438 | 2.41 | 170 | -5.59 | ||||
| 2025-07-11 | 13F | Farther Finance Advisors, LLC | 1,594 | 5.15 | 16 | 0.00 | ||||
| 2025-08-13 | 13F | ExodusPoint Capital Management, LP | 32,900 | -54.18 | 0 | |||||
| 2025-08-14 | 13F | Group One Trading, L.p. | 95 | 0.00 | 1 | -100.00 | ||||
| 2025-07-18 | 13F | Truist Financial Corp | 15,795 | 5.12 | 163 | -2.98 | ||||
| 2025-08-12 | 13F | MAI Capital Management | 3,296 | -4.79 | 34 | -10.53 | ||||
| 2025-05-16 | 13F/A | Goldman Sachs Group Inc | 0 | -100.00 | 0 | -100.00 | ||||
| 2025-08-13 | 13F | Jump Financial, LLC | 20,995 | 217 | ||||||
| 2025-07-22 | 13F | Miracle Mile Advisors, LLC | 11,388 | 2.97 | 118 | -4.88 | ||||
| 2025-08-01 | 13F | Y-Intercept (Hong Kong) Ltd | 207,207 | 734.74 | 2,140 | 672.56 | ||||
| 2025-08-12 | 13F | Hillsdale Investment Management Inc. | 0 | -100.00 | 0 | |||||
| 2025-08-14 | 13F | Susquehanna International Group, Llp | 110,971 | 328.51 | 1,146 | 296.54 | ||||
| 2025-08-12 | 13F | Dynamic Technology Lab Private Ltd | 14,271 | 5.32 | 147 | -2.65 | ||||
| 2025-08-13 | 13F | PharVision Advisers, LLC | 0 | -100.00 | 0 | |||||
| 2025-08-14 | 13F | Scoggin Management Lp | 0 | -100.00 | 0 | |||||
| 2025-08-06 | 13F | First Horizon Advisors, Inc. | 566 | 6 | ||||||
| 2025-08-12 | 13F | Virtu Financial LLC | 0 | -100.00 | 0 | |||||
| 2025-08-14 | 13F | Wells Fargo & Company/mn | 94,376 | 245.17 | 975 | 219.34 | ||||
| 2025-08-14 | 13F | Stifel Financial Corp | 58,603 | -2.99 | 605 | -10.37 | ||||
| 2025-08-11 | 13F | Synergy Investment Management, LLC | 25,011 | 10.42 | 258 | 1.98 | ||||
| 2025-08-14 | 13F | GWM Advisors LLC | 4,714 | 0.00 | 49 | -7.69 | ||||
| 2025-08-12 | 13F | CIBC Private Wealth Group, LLC | 7,122 | 0.00 | 74 | 12.31 | ||||
| 2025-08-14 | 13F | Millennium Management Llc | 720,074 | -39.83 | 7,438 | -44.46 | ||||
| 2025-08-08 | 13F | Hartland & Co., LLC | 0 | -100.00 | 0 | |||||
| 2025-04-30 | 13F | POM Investment Strategies, LLC | 0 | -100.00 | 0 | -100.00 | ||||
| 2025-08-12 | 13F | Proequities, Inc. | Put | 0 | 0 | |||||
| 2025-08-14 | 13F | Citadel Advisors Llc | Put | 22,900 | 116.04 | 237 | 100.00 | |||
| 2025-08-12 | 13F | Proequities, Inc. | Call | 0 | 0 | |||||
| 2025-08-14 | 13F | Two Sigma Advisers, Lp | 653,075 | -48.63 | 6,746 | -52.58 | ||||
| 2025-08-12 | 13F | Proequities, Inc. | 0 | 0 | ||||||
| 2025-08-14 | 13F | First Foundation Advisors | 12,393 | 0.00 | 128 | -7.25 | ||||
| 2025-07-31 | 13F | Optimum Investment Advisors | 17,500 | 0.00 | 181 | -7.69 | ||||
| 2025-07-31 | 13F | Sumitomo Mitsui Trust Holdings, Inc. | 81,236 | 57.27 | 839 | 45.16 | ||||
| 2025-06-25 | NP | VPC - Virtus Private Credit Strategy ETF | 90,483 | 1.15 | 915 | -8.69 | ||||
| 2025-08-14 | 13F | Citadel Advisors Llc | Call | 0 | -100.00 | 0 | ||||
| 2025-08-05 | 13F | Huntington National Bank | 0 | -100.00 | 0 | |||||
| 2025-08-14 | 13F | UBS Group AG | 1,117,647 | 81.73 | 11,545 | 67.76 | ||||
| 2025-07-17 | 13F | GraniteShares Advisors LLC | 255,250 | 6.67 | 2,637 | -1.53 | ||||
| 2025-08-12 | 13F | XTX Topco Ltd | 0 | -100.00 | 0 | |||||
| 2025-08-26 | NP | FTKI - First Trust Small Cap BuyWrite Income ETF | 0 | -100.00 | 0 | -100.00 | ||||
| 2025-07-16 | 13F | ORG Partners LLC | 1,500 | 0.00 | 16 | -6.25 | ||||
| 2025-08-11 | 13F | Hexagon Capital Partners LLC | 0 | -100.00 | 0 | |||||
| 2025-07-28 | NP | KBWD - Invesco KBW High Dividend Yield Financial ETF This fund is a listed as child fund of Invesco Ltd. and if that institution has disclosed ownership in this security, then these positions will not be double counted when calculating total shares and total value | 1,032,944 | 5.54 | 10,639 | -4.14 | ||||
| 2025-08-14 | 13F | Beacon Investment Advisors Llc | 19,886 | 1.36 | 204 | -7.31 | ||||
| 2025-08-27 | 13F/A | Squarepoint Ops LLC | 0 | -100.00 | 0 | -100.00 | ||||
| 2025-07-15 | 13F | Graypoint LLC | 75,302 | 2.96 | 778 | -5.01 | ||||
| 2025-07-09 | 13F | Westbourne Investments, Inc. | 19,175 | -5.59 | 198 | -12.78 | ||||
| 2025-07-24 | 13F | Us Bancorp \de\ | 4,000 | -0.12 | 41 | -6.82 | ||||
| 2025-08-29 | NP | GraniteShares ETF Trust - GraniteShares HIPS US High Income ETF | 255,250 | 6.67 | 2,637 | -1.53 | ||||
| 2025-08-13 | 13F | Natixis | 44,576 | 0.00 | 460 | -7.63 | ||||
| 2025-08-14 | 13F | Qube Research & Technologies Ltd | 798,816 | -20.27 | 8,252 | -26.40 | ||||
| 2025-08-12 | 13F | Jpmorgan Chase & Co | 51,706 | -41.10 | 534 | -45.62 | ||||
| 2025-07-25 | 13F | Cwm, Llc | 4,771 | 0 | ||||||
| 2025-07-31 | 13F | Cambridge Investment Research Advisors, Inc. | 78,176 | 32.39 | 1 | |||||
| 2025-08-15 | 13F | Morgan Stanley | 388,070 | -30.43 | 4,009 | -35.78 | ||||
| 2025-04-22 | 13F | Jmac Enterprises Llc | 0 | -100.00 | 0 | -100.00 | ||||
| 2025-07-31 | 13F | Caitong International Asset Management Co., Ltd | 177 | 17,600.00 | 2 | |||||
| 2025-08-13 | 13F | Invesco Ltd. | 1,076,310 | 2.52 | 11,118 | -5.35 | ||||
| 2025-08-14 | 13F | Jane Street Group, Llc | 0 | -100.00 | 0 | |||||
| 2025-08-14 | 13F | State Street Corp | 84,170 | 257.74 | 878 | 231.32 | ||||
| 2025-07-30 | 13F | Denali Advisors Llc | 69,103 | -2.61 | 714 | -10.09 | ||||
| 2025-07-24 | 13F | IFP Advisors, Inc | 3,434 | 3.00 | 35 | -5.41 | ||||
| 2025-08-05 | 13F | Simplex Trading, Llc | 30,528 | 2,375.91 | 0 | |||||
| 2025-08-08 | 13F | Cetera Investment Advisers | 63,704 | 2.13 | 658 | -5.60 | ||||
| 2025-08-05 | 13F | Simplex Trading, Llc | Put | 2,400 | 200.00 | 0 | ||||
| 2025-05-30 | NP | ERNZ - TrueShares Active Yield ETF | 310,616 | 735.71 | 3,476 | 755.91 | ||||
| 2025-08-01 | 13F | Envestnet Asset Management Inc | 36,933 | -1.67 | 382 | -9.29 | ||||
| 2025-08-06 | 13F | Wedbush Securities Inc | 139,202 | 5.04 | 1 | 0.00 | ||||
| 2025-05-01 | 13F | MQS Management LLC | 0 | -100.00 | 0 | -100.00 | ||||
| 2025-07-29 | 13F | Harbor Asset Planning, Inc. | 526 | 5 | ||||||
| 2025-08-12 | 13F | Legal & General Group Plc | 578,019 | 4.20 | 5,974 | -3.55 | ||||
| 2025-08-15 | 13F | CI Private Wealth, LLC | 53,747 | 247.00 | 555 | 220.81 | ||||
| 2025-08-14 | 13F | Quarry LP | 0 | -100.00 | 0 | |||||
| 2025-05-16 | 13F | Coppell Advisory Solutions LLC | 0 | -100.00 | 0 | |||||
| 2025-08-08 | 13F | Foundations Investment Advisors, LLC | 16,652 | 172 | ||||||
| 2025-04-24 | 13F | Mirae Asset Global Investments Co., Ltd. | 0 | -100.00 | 0 | -100.00 | ||||
| 2025-08-13 | 13F | Northwestern Mutual Wealth Management Co | 4,000 | 41 | ||||||
| 2025-08-15 | 13F | Great West Life Assurance Co /can/ | 86,588 | 3.37 | 1 | |||||
| 2025-08-14 | 13F | Two Sigma Investments, Lp | 942,801 | -45.81 | 9,739 | -49.97 | ||||
| 2025-07-31 | 13F | Sage Mountain Advisors LLC | 10,000 | 0.00 | 103 | -7.21 | ||||
| 2025-08-14 | 13F | Susquehanna International Group, Llp | Call | 0 | -100.00 | 0 | ||||
| 2025-08-14 | 13F | DRW Securities, LLC | 33,593 | 347 | ||||||
| 2025-08-14 | 13F | Susquehanna International Group, Llp | Put | 0 | -100.00 | 0 | ||||
| 2025-08-14 | 13F | Toroso Investments, LLC | 105,656 | 2.25 | 1,091 | -5.62 | ||||
| 2025-08-05 | 13F | Sigma Planning Corp | 10,439 | 0.53 | 108 | -7.76 | ||||
| 2025-05-12 | 13F | Connor, Clark & Lunn Investment Management Ltd. | 0 | -100.00 | 0 | -100.00 |
Other Listings
| GB:0KH0 | $10.20 |