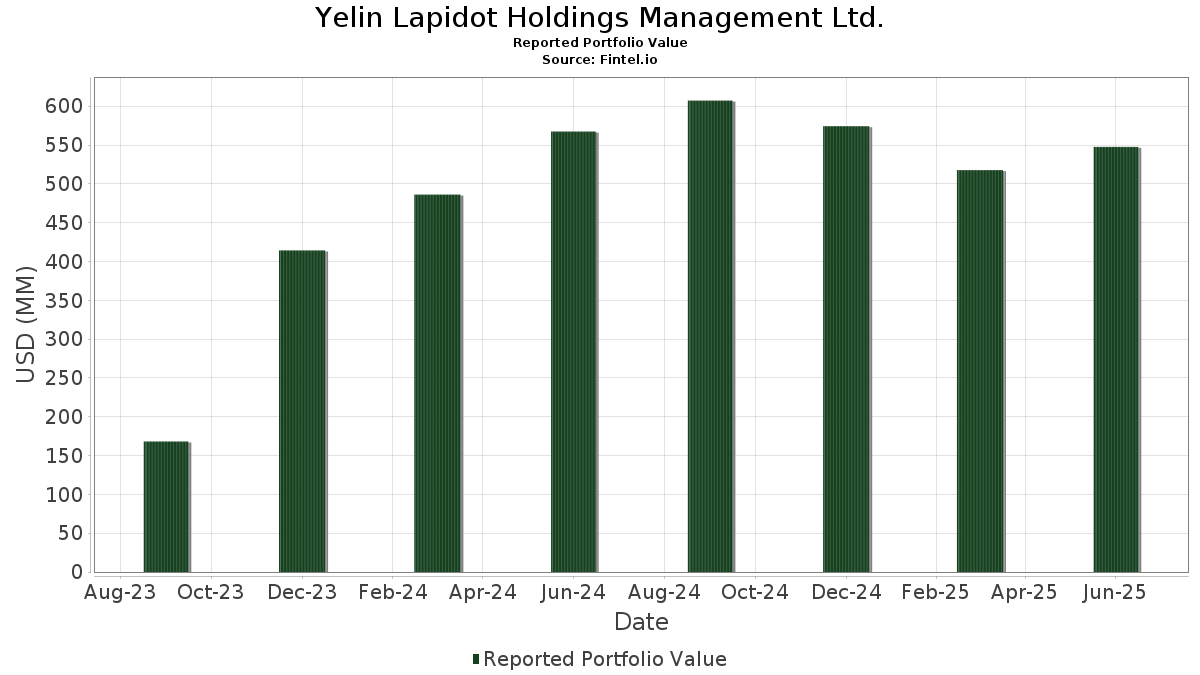
Basic Stats
| Portfolio Value | $ 547,600,498 |
| Current Positions | 96 |
Latest Holdings, Performance, AUM (from 13F, 13D)
Yelin Lapidot Holdings Management Ltd. has disclosed 96 total holdings in their latest SEC filings. Most recent portfolio value is calculated to be $ 547,600,498 USD. Actual Assets Under Management (AUM) is this value plus cash (which is not disclosed). Yelin Lapidot Holdings Management Ltd.’s top holdings are Invesco Exchange-Traded Fund Trust II - Invesco NASDAQ 100 ETF (US:QQQM) , The Select Sector SPDR Trust - The Financial Select Sector SPDR Fund (US:XLF) , SPDR S&P 500 ETF (US:SPY) , Global-E Online Ltd. (US:GLBE) , and Meta Platforms, Inc. (US:META) . Yelin Lapidot Holdings Management Ltd.’s new positions include GE Vernova Inc. (US:GEV) , New Fortress Energy Inc. (US:NFE) , . Yelin Lapidot Holdings Management Ltd.’s top industries are .
Top Increases This Quarter
We use the change in the portfolio allocation because this is the most meaningful metric. Changes can be due to trades or changes in share prices.
| Security | Shares (MM) |
Value (MM$) |
Portfolio % | ΔPortfolio % |
|---|---|---|---|---|
| 0.77 | 25.93 | 4.7357 | 2.0118 | |
| 0.04 | 21.05 | 3.8437 | 0.7762 | |
| 0.82 | 15.82 | 2.8890 | 0.3168 | |
| 0.08 | 17.84 | 3.2574 | 0.2693 | |
| 0.02 | 4.25 | 0.7760 | 0.2262 | |
| 0.77 | 2.81 | 0.4361 | 0.1364 | |
| 0.03 | 24.29 | 3.7660 | 0.1023 | |
| 0.51 | 6.89 | 1.2581 | 0.0851 | |
| 0.54 | 3.70 | 0.6753 | 0.0845 | |
| 0.20 | 4.52 | 0.7006 | 0.0799 |
Top Decreases This Quarter
We use the change in the portfolio allocation because this is the most meaningful metric. Changes can be due to trades or changes in share prices.
| Security | Shares (MM) |
Value (MM$) |
Portfolio % | ΔPortfolio % |
|---|---|---|---|---|
| 0.01 | 1.15 | 0.1784 | -4.7609 | |
| 0.77 | 40.10 | 6.2165 | -1.1513 | |
| 0.08 | 14.81 | 2.2963 | -0.9649 | |
| 0.25 | 6.67 | 1.0333 | -0.9626 | |
| 0.44 | 100.26 | 15.5419 | -0.8478 | |
| 0.07 | 7.86 | 1.2186 | -0.5519 | |
| 0.36 | 13.98 | 2.5529 | -0.4736 | |
| 0.13 | 9.43 | 1.4620 | -0.4604 | |
| 0.10 | 8.67 | 1.3438 | -0.2938 | |
| 0.02 | 12.45 | 1.9294 | -0.2889 |
13D/G Filings
This is a list of 13D and 13G filings made in the last year (if any). Click the link icon to see the full transaction history. Green rows indicate new positions. Red rows indicate closed positions.
| File Date | Form | Security | Prev Shares |
Current Shares |
ΔShares % | % Ownership |
% ΔOwnership | |
|---|---|---|---|---|---|---|---|---|
| 2025-07-17 | GILT / Gilat Satellite Networks Ltd. | 936,883 | 3,066,826 | 227.34 | 5.38 | 224.10 | ||
| 2025-02-11 | KEN / Kenon Holdings Ltd. | 2,647,519 | 5.05 | |||||
| 2024-11-04 | RDCM / RADCOM Ltd. | 1,286,669 | 803,497 | -37.55 | 5.19 | -39.23 | ||
| 2024-11-04 | TATT / TAT Technologies Ltd. | 704,406 | 422,967 | -39.95 | 4.17 | -40.17 | ||
| 2024-10-01 | MDWD / MediWound Ltd. | 381,968 | 750,743 | 96.55 | 6.96 | 393.62 |
13F and Fund Filings
This form was filed on 2025-08-06 for the reporting period 2025-06-30. Click the link icon to see the full transaction history.
Upgrade to unlock premium data and export to Excel ![]() .
.
| Security | Type | Avg Share Price | Shares (MM) |
ΔShares (%) |
ΔShares (%) |
Value ($MM) |
Portfolio (%) |
ΔPortfolio (%) |
|
|---|---|---|---|---|---|---|---|---|---|
| QQQM / Invesco Exchange-Traded Fund Trust II - Invesco NASDAQ 100 ETF | 0.44 | 0.43 | 100.26 | 18.17 | 15.5419 | -0.8478 | |||
| XLF / The Select Sector SPDR Trust - The Financial Select Sector SPDR Fund | 0.77 | 0.00 | 40.10 | 5.14 | 6.2165 | -1.1513 | |||
| SPY / SPDR S&P 500 ETF | 0.06 | 9.36 | 37.44 | 20.79 | 5.8035 | -0.1838 | |||
| GLBE / Global-E Online Ltd. | 0.77 | 95.47 | 25.93 | 83.90 | 4.7357 | 2.0118 | |||
| META / Meta Platforms, Inc. | 0.03 | 0.02 | 24.29 | 28.09 | 3.7660 | 0.1023 | |||
| MSFT / Microsoft Corporation | 0.04 | 0.03 | 21.05 | 32.54 | 3.8437 | 0.7762 | |||
| ZIM / ZIM Integrated Shipping Services Ltd. | 1.23 | -9.14 | 19.81 | 0.20 | 3.6185 | -0.2013 | |||
| AMZN / Amazon.com, Inc. | 0.08 | 0.00 | 17.84 | 15.31 | 3.2574 | 0.2693 | |||
| MDWD / MediWound Ltd. | 0.82 | -4.81 | 15.82 | 18.80 | 2.8890 | 0.3168 | |||
| PKB / Invesco Exchange-Traded Fund Trust - Invesco Building & Construction ETF | 0.08 | -16.37 | 14.81 | -12.26 | 2.2963 | -0.9649 | |||
| GSK / GSK plc - Depositary Receipt (Common Stock) | 0.36 | -9.98 | 13.98 | -10.77 | 2.5529 | -0.4736 | |||
| IVV / iShares Trust - iShares Core S&P 500 ETF | 0.02 | -1.92 | 12.45 | 8.38 | 1.9294 | -0.2889 | |||
| GOOGL / Alphabet Inc. | 0.07 | 0.03 | 11.70 | 14.00 | 1.8142 | -0.1690 | |||
| IFF / International Flavors & Fragrances Inc. | 0.13 | 0.00 | 9.43 | -5.24 | 1.4620 | -0.4604 | |||
| NICE / NICE Ltd. - Depositary Receipt (Common Stock) | 0.05 | 0.00 | 9.24 | 9.56 | 1.6871 | 0.0583 | |||
| ORA / Ormat Technologies, Inc. | 0.11 | 0.00 | 8.89 | 18.35 | 1.3786 | -0.0729 | |||
| XBI / SPDR Series Trust - SPDR S&P Biotech ETF | 0.10 | 0.00 | 8.67 | 2.25 | 1.3438 | -0.2938 | |||
| BABA / Alibaba Group Holding Limited - Depositary Receipt (Common Stock) | 0.07 | 0.00 | 7.86 | -14.24 | 1.2186 | -0.5519 | |||
| PFE / Pfizer Inc. | 0.30 | 0.00 | 7.22 | -4.35 | 1.3184 | -0.1394 | |||
| PRGO / Perrigo Company plc | 0.27 | -0.08 | 7.12 | -4.79 | 1.3006 | -0.1442 | |||
| RDCM / RADCOM Ltd. | 0.51 | -4.58 | 6.89 | 13.46 | 1.2581 | 0.0851 | |||
| SCHD / Schwab Strategic Trust - Schwab U.S. Dividend Equity ETF | 0.25 | -31.93 | 6.67 | -35.49 | 1.0333 | -0.9626 | |||
| TEVA / Teva Pharmaceutical Industries Limited - Depositary Receipt (Common Stock) | 0.40 | 0.00 | 6.63 | 9.05 | 1.2105 | 0.0363 | |||
| ESLT / Elbit Systems Ltd. | 0.01 | 0.00 | 5.77 | 17.17 | 0.8947 | -0.0569 | |||
| KRNT / Kornit Digital Ltd. | 0.23 | -11.61 | 4.59 | -7.77 | 0.8375 | -0.1230 | |||
| ENLT / Enlight Renewable Energy Ltd | 0.20 | 0.00 | 4.52 | 40.65 | 0.7006 | 0.0799 | |||
| RDWR / Radware Ltd. | 0.15 | -34.97 | 4.41 | -11.45 | 0.6843 | -0.2787 | |||
| VTRS / Viatris Inc. | 0.49 | 0.00 | 4.35 | 2.52 | 0.6747 | -0.1453 | |||
| INMD / InMode Ltd. | 0.30 | -1.80 | 4.32 | -20.08 | 0.7881 | -0.2548 | |||
| NVMI / Nova Ltd. | 0.02 | -0.01 | 4.25 | 49.30 | 0.7760 | 0.2262 | |||
| ANET / Arista Networks Inc | 0.04 | 0.04 | 3.96 | 32.12 | 0.6140 | 0.0348 | |||
| XLK / The Select Sector SPDR Trust - The Technology Select Sector SPDR Fund | 0.02 | 0.00 | 3.86 | 22.65 | 0.5978 | -0.0096 | |||
| ICL / ICL Group Ltd | 0.54 | 0.00 | 3.70 | 20.90 | 0.6753 | 0.0845 | |||
| SILC / Silicom Ltd. | 0.21 | -12.49 | 3.20 | -9.05 | 0.4955 | -0.1834 | |||
| CAMT / Camtek Ltd. | 0.04 | -0.01 | 3.01 | 44.27 | 0.4663 | 0.0634 | |||
| CHKP / Check Point Software Technologies Ltd. | 0.01 | 0.16 | 2.82 | -2.76 | 0.5141 | -0.0452 | |||
| TBLA / Taboola.com Ltd. | 0.77 | 46.14 | 2.81 | 81.37 | 0.4361 | 0.1364 | |||
| ELTK / Eltek Ltd. | 0.25 | -7.20 | 2.71 | 19.40 | 0.4947 | 0.0565 | |||
| XAR / SPDR Series Trust - SPDR S&P Aerospace & Defense ETF | 0.01 | 0.00 | 2.64 | 31.27 | 0.4087 | 0.0207 | |||
| QQQ / Invesco QQQ Trust, Series 1 | 0.00 | 0.00 | 2.61 | 17.65 | 0.4052 | -0.0240 | |||
| SN / SharkNinja, Inc. | 0.03 | 6.02 | 2.61 | 25.87 | 0.4051 | 0.0039 | |||
| NVDA / NVIDIA Corporation | 0.02 | 0.19 | 2.38 | 46.13 | 0.3683 | 0.0541 | |||
| WIX / Wix.com Ltd. | 0.01 | 4.85 | 2.22 | 1.69 | 0.3449 | -0.0777 | |||
| BRK.B / Berkshire Hathaway Inc. | 0.00 | 0.00 | 2.16 | -8.78 | 0.3351 | -0.1227 | |||
| ZM / Zoom Communications Inc. | 0.03 | 0.00 | 2.02 | 5.71 | 0.3688 | -0.0002 | |||
| KKR / KKR & Co. Inc. | 0.01 | 0.00 | 1.97 | 15.05 | 0.3058 | -0.0254 | |||
| ALLT / Allot Ltd. | 0.23 | 0.00 | 1.93 | 49.69 | 0.2995 | 0.0502 | |||
| MRVL / Marvell Technology, Inc. | 0.02 | -0.06 | 1.92 | 25.64 | 0.2978 | 0.0024 | |||
| ELLO / Ellomay Capital Ltd. | 0.11 | 0.00 | 1.90 | 13.25 | 0.3467 | 0.0230 | |||
| INTC / Intel Corporation | 0.08 | -0.07 | 1.76 | -1.45 | 0.3217 | -0.0235 | |||
| VUG / Vanguard Index Funds - Vanguard Growth ETF | 0.00 | 0.00 | 1.68 | 18.21 | 0.2606 | -0.0141 | |||
| SCHG / Schwab Strategic Trust - Schwab U.S. Large-Cap Growth ETF | 0.06 | 0.00 | 1.67 | 16.64 | 0.2586 | -0.0176 | |||
| VTWO / Vanguard Scottsdale Funds - Vanguard Russell 2000 ETF | 0.02 | 0.00 | 1.64 | 8.16 | 0.3002 | 0.0066 | |||
| LOW / Lowe's Companies, Inc. | 0.01 | 0.00 | 1.31 | -4.87 | 0.2390 | -0.0268 | |||
| GILT / Gilat Satellite Networks Ltd. | 0.18 | 0.00 | 1.29 | 11.72 | 0.1995 | -0.0232 | |||
| CSTE / Caesarstone Ltd. | 0.62 | 0.00 | 1.23 | -18.93 | 0.1899 | -0.1020 | |||
| MGIC / Magic Software Enterprises Ltd. | 0.06 | 0.00 | 1.19 | 47.15 | 0.1840 | 0.0282 | |||
| XLI / The Select Sector SPDR Trust - The Industrial Select Sector SPDR Fund | 0.01 | 0.00 | 1.18 | 12.60 | 0.1829 | -0.0196 | |||
| XLV / The Select Sector SPDR Trust - The Health Care Select Sector SPDR Fund | 0.01 | -95.12 | 1.15 | -95.50 | 0.1784 | -4.7609 | |||
| SPG / Simon Property Group, Inc. | 0.01 | 0.00 | 1.15 | -3.20 | 0.1782 | -0.0512 | |||
| HRMY / Harmony Biosciences Holdings, Inc. | 0.04 | 0.00 | 1.13 | -4.79 | 0.1758 | -0.0543 | |||
| ODYS / Odysight.ai Inc. | 0.21 | -8.42 | 1.08 | -33.48 | 0.1671 | -0.1459 | |||
| SNDX / Syndax Pharmaceuticals, Inc. | 0.11 | 0.00 | 1.01 | -23.82 | 0.1573 | -0.0999 | |||
| CSCO / Cisco Systems, Inc. | 0.01 | 0.43 | 0.91 | 12.95 | 0.1657 | 0.0105 | |||
| V / Visa Inc. | 0.00 | 0.69 | 0.78 | 1.96 | 0.1428 | -0.0053 | |||
| CMMB / Chemomab Therapeutics Ltd. - Depositary Receipt (Common Stock) | 0.58 | 0.00 | 0.67 | 6.35 | 0.1225 | 0.0007 | |||
| CGEN / Compugen Ltd. | 0.32 | 0.00 | 0.57 | 21.94 | 0.0880 | -0.0019 | |||
| GE / General Electric Company | 0.00 | 0.00 | 0.55 | 28.81 | 0.1004 | 0.0178 | |||
| AMT / American Tower Corporation | 0.00 | -1.48 | 0.50 | 0.00 | 0.0914 | -0.0052 | |||
| CPAY / Corpay, Inc. | 0.00 | 0.00 | 0.50 | -4.97 | 0.0772 | -0.0239 | |||
| MU / Micron Technology, Inc. | 0.00 | -0.36 | 0.48 | 41.42 | 0.0742 | 0.0088 | |||
| T / AT&T Inc. | 0.02 | 3.11 | 0.48 | 5.53 | 0.0871 | -0.0002 | |||
| JEF / Jefferies Financial Group Inc. | 0.01 | 0.00 | 0.47 | 2.16 | 0.0733 | -0.0162 | |||
| NVR / NVR, Inc. | 0.00 | 0.00 | 0.47 | 1.97 | 0.0850 | -0.0032 | |||
| VZ / Verizon Communications Inc. | 0.01 | 2.53 | 0.45 | -2.19 | 0.0693 | -0.0190 | |||
| TMUS / T-Mobile US, Inc. | 0.00 | 16.48 | 0.44 | 4.03 | 0.0803 | -0.0013 | |||
| PERI / Perion Network Ltd. | 0.04 | 0.00 | 0.43 | 24.85 | 0.0662 | 0.0000 | |||
| DLR / Digital Realty Trust, Inc. | 0.00 | 0.00 | 0.40 | 21.58 | 0.0622 | -0.0015 | |||
| ARVN / Arvinas, Inc. | 0.05 | 0.00 | 0.34 | 4.89 | 0.0532 | -0.0100 | |||
| WMB / The Williams Companies, Inc. | 0.01 | -1.47 | 0.34 | 3.65 | 0.0530 | -0.0108 | |||
| DIS / The Walt Disney Company | 0.00 | 0.00 | 0.31 | 26.02 | 0.0566 | 0.0090 | |||
| CEG / Constellation Energy Corporation | 0.00 | 0.30 | 0.0544 | 0.0544 | |||||
| NEE / NextEra Energy, Inc. | 0.00 | -0.59 | 0.29 | -2.68 | 0.0532 | -0.0046 | |||
| GEV / GE Vernova Inc. | 0.00 | 0.28 | 0.0516 | 0.0516 | |||||
| DUK / Duke Energy Corporation | 0.00 | -5.75 | 0.27 | -8.81 | 0.0417 | -0.0153 | |||
| PYPL / PayPal Holdings, Inc. | 0.00 | 0.00 | 0.24 | 13.68 | 0.0374 | -0.0035 | |||
| TEAD / Teads Holding Co. | 0.10 | 0.00 | 0.24 | -33.61 | 0.0372 | -0.0325 | |||
| OKE / ONEOK, Inc. | 0.00 | -1.58 | 0.24 | -18.98 | 0.0371 | -0.0200 | |||
| SEDG / SolarEdge Technologies, Inc. | 0.01 | 0.00 | 0.24 | 26.06 | 0.0434 | 0.0070 | |||
| CCI / Crown Castle Inc. | 0.00 | -1.41 | 0.21 | -2.82 | 0.0379 | -0.0034 | |||
| NGG / National Grid plc - Depositary Receipt (Common Stock) | 0.00 | 0.20 | 0.0369 | 0.0369 | |||||
| PFLT / PennantPark Floating Rate Capital Ltd. | 0.02 | 0.00 | 0.20 | -7.80 | 0.0312 | -0.0109 | |||
| UPS / United Parcel Service, Inc. | 0.00 | 0.00 | 0.20 | -8.22 | 0.0312 | -0.0112 | |||
| AUDC / AudioCodes Ltd. | 0.02 | 0.00 | 0.20 | 4.23 | 0.0306 | -0.0060 | |||
| SOL GEL TECHNOLOGIES / SHS (M8694L103) | 0.02 | 0.13 | 0.0000 | ||||||
| NFE / New Fortress Energy Inc. | 0.02 | 0.06 | 0.0104 | 0.0104 | |||||
| PYPD / PolyPid Ltd. | 0.00 | -100.00 | 0.00 | 0.0000 | |||||
| VLN / Valens Semiconductor Ltd. | 0.00 | -100.00 | 0.00 | 0.0000 | |||||
| SPNS / Sapiens International Corporation N.V. | 0.00 | -100.00 | 0.00 | -100.00 | -0.0485 | ||||
| CMCT / Creative Media & Community Trust Corporation | 0.00 | -100.00 | 0.00 | 0.0000 | |||||
| TRGP / Targa Resources Corp. | 0.00 | -100.00 | 0.00 | 0.0000 | |||||
| XLP / The Select Sector SPDR Trust - The Consumer Staples Select Sector SPDR Fund | 0.00 | -100.00 | 0.00 | 0.0000 |