Basic Stats
| Institutional Shares (Long) | 31,846,726 - 232.04% (ex 13D/G) - change of -1.52MM shares -4.55% MRQ |
| Institutional Value (Long) | $ 333,992 USD ($1000) |
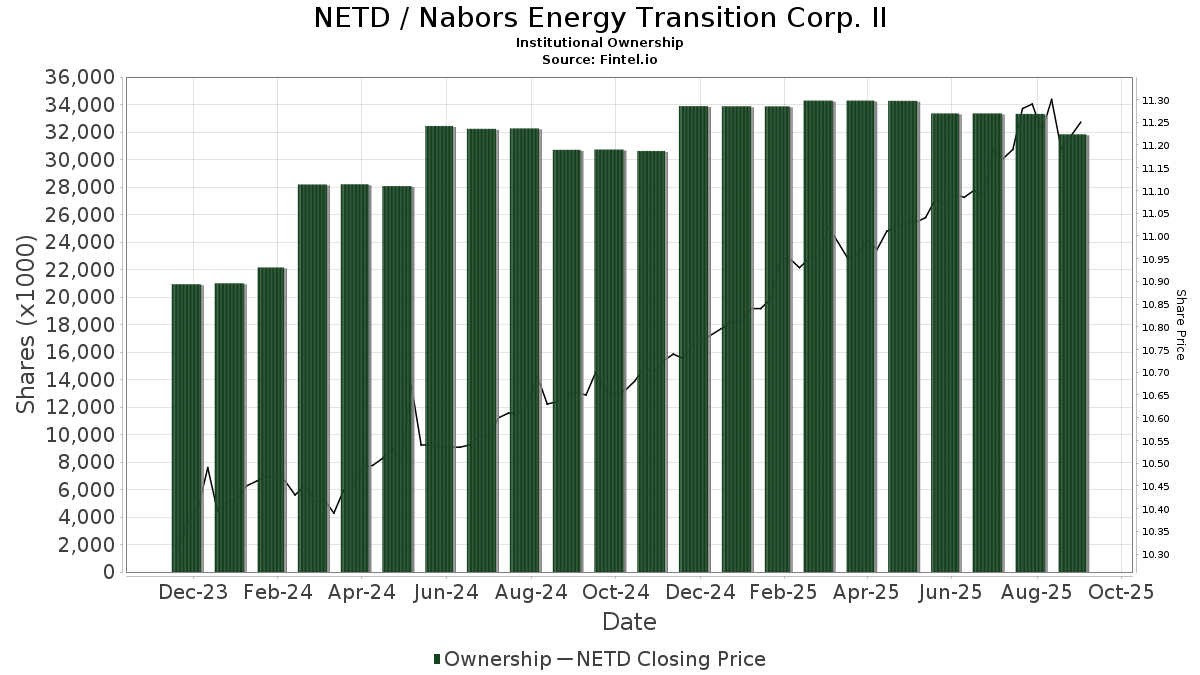
Institutional Ownership and Shareholders
Nabors Energy Transition Corp. II (US:NETD) has 68 institutional owners and shareholders that have filed 13D/G or 13F forms with the Securities Exchange Commission (SEC). These institutions hold a total of 31,846,726 shares. Largest shareholders include Vivaldi Asset Management, LLC, VARAX - Vivaldi Merger Arbitrage Fund Class A Shares, Schechter Investment Advisors, LLC, Wealthspring Capital LLC, Berkley W R Corp, Westchester Capital Management, LLC, Aristeia Capital Llc, D. E. Shaw & Co., Inc., MERFX - The Merger Fund - Investor Class Shares, and Wolverine Asset Management Llc .
Nabors Energy Transition Corp. II (NasdaqGM:NETD) institutional ownership structure shows current positions in the company by institutions and funds, as well as latest changes in position size. Major shareholders can include individual investors, mutual funds, hedge funds, or institutions. The Schedule 13D indicates that the investor holds (or held) more than 5% of the company and intends (or intended) to actively pursue a change in business strategy. Schedule 13G indicates a passive investment of over 5%.
The share price as of September 5, 2025 is 11.20 / share. Previously, on September 9, 2024, the share price was 10.62 / share. This represents an increase of 5.46% over that period.
Fund Sentiment Score
The Fund Sentiment Score (fka Ownership Accumulation Score) finds the stocks that are being most bought by funds. It is the result of a sophisticated, multi-factor quantitative model that identifies companies with the highest levels of institutional accumulation. The scoring model uses a combination of the total increase in disclosed owners, the changes in portfolio allocations in those owners and other metrics. The number ranges from 0 to 100, with higher numbers indicating a higher level of accumulation to its peers, and 50 being the average.
Update Frequency: Daily
See Ownership Explorer, which provides a list of highest-ranking companies.
Institutional Put/Call Ratio
In addition to reporting standard equity and debt issues, institutions with more than 100MM assets under management must also disclose their put and call option holdings. Since put options generally indicate negative sentiment, and call options indicate positive sentiment, we can get a sense of the overall institutional sentiment by plotting the ratio of puts to calls. The chart to the right plots the historical put/call ratio for this instrument.
Using Put/Call Ratio as an indicator of investor sentiment overcomes one of the key deficiencies of using total institutional ownership, which is that a significant amount of assets under management are invested passively to track indices. Passively-managed funds do not typically buy options, so the put/call ratio indicator more closely tracks the sentiment of actively-managed funds.
13D/G Filings
We present 13D/G filings separately from the 13F filings because of the different treatement by the SEC. 13D/G filings can be filed by groups of investors (with one leading), whereas 13F filings cannot. This results in situations where an investor may file a 13D/G reporting one value for the total shares (representing all the shares owned by the investor group), but then file a 13F reporting a different value for the total shares (representing strictly their own ownership). This means that share ownership of 13D/G filings and 13F filings are oftentimes not directly comparable, so we present them separately.
Note: As of May 16, 2021, we no longer show owners that have not filed a 13D/G within the last year. Previously, we were showing the full history of 13D/G filings. In general, entities that are required to file 13D/G filings must file at least annually before submitting a closing filing. However, funds sometimes exit positions without submitting a closing filing (ie, they wind down), so displaying the full history sometimes resulted in confusion about the current ownership. To prevent confusion, we now only show ’current’ owners - that is - owners that have filed within the last year.
Upgrade to unlock premium data.
| File Date | Form | Investor | Prev Shares |
Latest Shares |
Δ Shares (Percent) |
Ownership (Percent) |
Δ Ownership (Percent) |
|
|---|---|---|---|---|---|---|---|---|
| 2025-08-08 | BERKLEY W R CORP | 1,542,099 | 5.10 | |||||
| 2025-05-15 | AQR CAPITAL MANAGEMENT LLC | 2,339,997 | 471,798 | -79.84 | 1.55 | -79.79 | ||
| 2025-04-07 | Karpus Management, Inc. | 3,000,315 | 1,428,492 | -52.39 | 3.75 | -52.35 | ||
| 2025-03-21 | BARCLAYS PLC | 2,134,229 | 2,134,229 | 0.00 | 7.00 | 0.00 | ||
| 2024-11-15 | Vivaldi Asset Management, LLC | 1,659,314 | 2,790,622 | 68.18 | 9.15 | 68.20 |
13F and NPORT Filings
Detail on 13F filings are free. Detail on NP filings require a premium membership. Green rows indicate new positions. Red rows indicate closed positions. Click the link icon to see the full transaction history.
Upgrade
to unlock premium data and export to Excel ![]() .
.
| File Date | Source | Investor | Type | Avg Price (Est) |
Shares | Δ Shares (%) |
Reported Value ($1000) |
Δ Value (%) |
Port Alloc (%) |
|
|---|---|---|---|---|---|---|---|---|---|---|
| 2025-08-14 | 13F | Toronto Dominion Bank | 9,846 | -99.30 | 109 | -99.29 | ||||
| 2025-08-14 | 13F | K2 Principal Fund, L.p. | 300,000 | 0.00 | 3,330 | 1.37 | ||||
| 2025-08-06 | 13F | Wealthspring Capital LLC | 1,560,107 | 495.84 | 17,317 | 504.01 | ||||
| 2025-08-14 | 13F | Evercore Wealth Management, LLC | 13,693 | -41.68 | 152 | -41.25 | ||||
| 2025-08-14 | 13F | Bulldog Investors, LLP | 140,551 | -15.83 | 1,560 | -14.66 | ||||
| 2025-08-07 | 13F | Bck Capital Management Lp | 0 | -100.00 | 0 | |||||
| 2025-08-14 | 13F | Berkley W R Corp | 1,542,099 | 184.77 | 17,117 | 188.70 | ||||
| 2025-05-15 | 13F | Gritstone Asset Management Llc | 0 | -100.00 | 0 | -100.00 | ||||
| 2025-08-08 | 13F | Condor Capital Management | 14,585 | -53.27 | 162 | -52.79 | ||||
| 2025-08-14 | 13F | Verition Fund Management LLC | 300,000 | -52.38 | 3,330 | -51.73 | ||||
| 2025-08-04 | 13F | Wolverine Asset Management Llc | 1,337,286 | 67.21 | 14,844 | 69.50 | ||||
| 2025-08-14 | 13F | Periscope Capital Inc. | 300,000 | -10.45 | 3,330 | -9.21 | ||||
| 2025-05-15 | 13F | StoneX Group Inc. | 0 | -100.00 | 0 | -100.00 | ||||
| 2025-08-14 | 13F | Heights Capital Management, Inc | 49,195 | -1.20 | 546 | 0.18 | ||||
| 2025-08-14 | 13F | Karpus Management, Inc. | 537,778 | -62.35 | 5,969 | -61.84 | ||||
| 2025-08-28 | NP | Relative Value Fund | 45,622 | 0.00 | 506 | 1.40 | ||||
| 2025-08-20 | NP | FTMAX - Vivaldi Multi-Strategy Fund Class A Shares | 121,990 | -0.46 | 1,354 | 0.89 | ||||
| 2025-08-14 | 13F | ADAR1 Capital Management, LLC | 39,900 | 0.00 | 443 | 1.38 | ||||
| 2025-05-14 | 13F | Toroso Investments, LLC | 0 | -100.00 | 0 | |||||
| 2025-08-14 | 13F | Decagon Asset Management LLP | 0 | -100.00 | 0 | |||||
| 2025-08-14 | 13F | Aristeia Capital Llc | 1,462,530 | -2.50 | 16,234 | -1.16 | ||||
| 2025-08-14 | 13F | D. E. Shaw & Co., Inc. | 1,459,229 | 0.00 | 16,197 | 1.37 | ||||
| 2025-08-14 | 13F | Radcliffe Capital Management, L.P. | 250,000 | 2,775 | ||||||
| 2025-08-27 | NP | JNL SERIES TRUST - JNL Multi-Manager Alternative Fund (A) | 72,805 | 115.81 | 808 | 118.97 | ||||
| 2025-08-14 | 13F | Ubs Oconnor Llc | 233,912 | 0.00 | 2,596 | 1.37 | ||||
| 2025-08-14 | 13F | Sculptor Capital LP | 250,000 | 0.00 | 2,775 | 1.39 | ||||
| 2025-06-27 | NP | CVSIX - Calamos Market Neutral Income Fund Class A | 100,000 | 0.00 | 1,101 | 1.66 | ||||
| 2025-05-09 | 13F | Levin Capital Strategies, L.p. | 0 | -100.00 | 0 | |||||
| 2025-05-14 | 13F | Healthcare Of Ontario Pension Plan Trust Fund | 0 | -100.00 | 0 | |||||
| 2025-03-27 | NP | SPAX - Robinson Alternative Yield Pre-Merger SPAC ETF | 13,563 | -6.25 | 147 | -5.19 | ||||
| 2025-08-14 | 13F | Glazer Capital, Llc | 562,537 | -6.24 | 6 | 0.00 | ||||
| 2025-08-08 | 13F | Alberta Investment Management Corp | 450,000 | 0.00 | 4,995 | 1.38 | ||||
| 2025-08-11 | 13F | Mint Tower Capital Management B.V. | 100,000 | 0.00 | 1 | 0.00 | ||||
| 2025-08-14 | 13F | Quarry LP | 100,000 | 1,110 | ||||||
| 2025-08-14 | 13F | Harraden Circle Investments, LLC | 0 | -100.00 | 0 | |||||
| 2025-08-27 | NP | Special Opportunities Fund, Inc. | 21,561 | 0.00 | 239 | 1.27 | ||||
| 2025-08-12 | 13F | Deutsche Bank Ag\ | 520,072 | 0.00 | 5,773 | 1.37 | ||||
| 2025-08-14 | 13F | Lighthouse Investment Partners, LLC | 0 | -100.00 | 0 | |||||
| 2025-08-14 | 13F | Fort Baker Capital Management LP | 814,347 | 0.00 | 9,039 | 1.37 | ||||
| 2025-05-14 | 13F | Crossingbridge Advisors, LLC | 0 | -100.00 | 0 | |||||
| 2025-08-14 | 13F | Moore Capital Management, Lp | 600,000 | 0.00 | 6,660 | 1.37 | ||||
| 2025-08-14 | 13F | Millennium Management Llc | 550,000 | 0.00 | 6,105 | 1.38 | ||||
| 2025-08-28 | NP | Rivernorth Opportunities Fund, Inc. | 66,944 | 0.00 | 743 | 1.36 | ||||
| 2025-08-20 | NP | VARAX - Vivaldi Merger Arbitrage Fund Class A Shares | 2,463,270 | -0.12 | 27,342 | 1.25 | ||||
| 2025-05-13 | 13F | Robinson Capital Management, Llc | 0 | -100.00 | 0 | |||||
| 2025-05-01 | 13F | Schechter Investment Advisors, LLC | 2,396,492 | -4.32 | 26,242 | -2.99 | ||||
| 2025-08-14 | 13F | Hrt Financial Lp | 72,124 | 1 | ||||||
| 2025-07-29 | NP | Putnam High Income Securities Fund | 39,885 | 0.00 | 441 | 0.92 | ||||
| 2025-08-14 | 13F | Ghisallo Capital Management LLC | 599,800 | 0.00 | 6,658 | 1.37 | ||||
| 2025-08-12 | 13F | Longfellow Investment Management Co Llc | 0 | -100.00 | 0 | |||||
| 2025-08-14 | 13F | Alpine Global Management, LLC | 0 | -100.00 | 0 | |||||
| 2025-08-14 | 13F | Linden Advisors Lp | 1,000,000 | 0.00 | 11,100 | 1.37 | ||||
| 2025-08-12 | 13F | Proequities, Inc. | 0 | 0 | ||||||
| 2025-08-14 | 13F | Two Sigma Investments, Lp | 0 | -100.00 | 0 | |||||
| 2025-08-14 | 13F | UBS Group AG | 197,836 | -8.24 | 2,196 | -6.99 | ||||
| 2025-08-14 | 13F | Westchester Capital Management, LLC | 1,484,265 | 102.14 | 16,475 | 104.91 | ||||
| 2025-08-14 | 13F | Angelo Gordon & Co., L.p. | 100,000 | 0.00 | 1,110 | 1.37 | ||||
| 2025-08-14 | 13F | HGC Investment Management Inc. | 0 | -100.00 | 0 | |||||
| 2025-08-12 | 13F | Jpmorgan Chase & Co | 49,662 | -94.14 | 551 | -94.06 | ||||
| 2025-08-14 | 13F | TENOR CAPITAL MANAGEMENT Co., L.P. | 100,000 | 0.00 | 1,110 | 1.37 | ||||
| 2025-08-12 | 13F | Picton Mahoney Asset Management | 900,000 | 0.00 | 10 | 0.00 | ||||
| 2025-08-14 | 13F | Shaolin Capital Management LLC | 200,000 | 100.00 | 2,220 | 102.74 | ||||
| 2025-08-14 | 13F | Vivaldi Asset Management, LLC | 2,591,412 | -0.14 | 28,765 | 1.23 | ||||
| 2025-08-08 | 13F | Calamos Advisors LLC | 100,000 | 0.00 | 1,110 | 1.37 | ||||
| 2025-08-13 | 13F | Clear Street Llc | 98,281 | 116,901.19 | 1,091 | |||||
| 2025-08-08 | 13F | Commonwealth Of Pennsylvania Public School Empls Retrmt Sys | 0 | -100.00 | 0 | |||||
| 2025-08-14 | 13F | Susquehanna International Group, Llp | 54,880 | -13.99 | 609 | -12.75 | ||||
| 2025-08-15 | 13F | Morgan Stanley | 117 | 317.86 | 1 | |||||
| 2025-08-08 | 13F | Geode Capital Management, Llc | 46,748 | 0.41 | 519 | 1.77 | ||||
| 2025-08-14 | 13F | Polar Asset Management Partners Inc. | 777,604 | 55.52 | 8,631 | 57.64 | ||||
| 2025-08-26 | NP | MERVX - The Merger Fund VL | 16,335 | 79.78 | 181 | 82.83 | ||||
| 2025-08-14 | 13F | Citadel Advisors Llc | 12,547 | 139 | ||||||
| 2025-08-12 | 13F | Virtu Financial LLC | 80,765 | 83.66 | 1 | |||||
| 2025-08-14 | 13F | Prelude Capital Management, Llc | 0 | -100.00 | 0 | |||||
| 2025-08-14 | 13F | Cnh Partners Llc | 471,798 | 0.00 | 5,237 | 1.36 | ||||
| 2025-08-14 | 13F | Rivernorth Capital Management, Llc | 118,992 | 0.00 | 1,321 | 1.38 | ||||
| 2025-05-12 | 13F | Mizuho Securities Usa Llc | 408,804 | 49.03 | 4,456 | 50.81 | ||||
| 2025-08-28 | NP | SPAQ - Horizon Kinetics SPAC Active ETF | 40,216 | -11.27 | 446 | -10.08 | ||||
| 2025-07-16 | 13F | Dakota Wealth Management | 0 | -100.00 | 0 | |||||
| 2025-07-24 | NP | FNCMX - Fidelity Nasdaq Composite Index Fund This fund is a listed as child fund of Fmr Llc and if that institution has disclosed ownership in this security, then these positions will not be double counted when calculating total shares and total value | 46,557 | 54.28 | 514 | 55.76 | ||||
| 2025-05-15 | 13F | Fir Tree Capital Management Lp | 0 | -100.00 | 0 | |||||
| 2025-08-14 | 13F | Goldman Sachs Group Inc | 86,088 | 0.12 | 956 | 1.49 | ||||
| 2025-08-26 | NP | MERFX - The Merger Fund - Investor Class Shares | 1,395,125 | 101.77 | 15,486 | 104.53 | ||||
| 2025-05-15 | 13F | Centiva Capital, LP | 0 | -100.00 | 0 | |||||
| 2025-08-14 | 13F | Cantor Fitzgerald, L. P. | 137,700 | 1,528 | ||||||
| 2025-08-13 | 13F/A | DLD Asset Management, LP | 812,271 | 9,016 | ||||||
| 2025-08-18 | 13F/A | Hudson Bay Capital Management LP | 1,007,000 | -0.30 | 11,178 | 1.07 |