Basic Stats
| Institutional Owners | 70 total, 70 long only, 0 short only, 0 long/short - change of -7.79% MRQ |
| Average Portfolio Allocation | 0.1876 % - change of -3.51% MRQ |
| Institutional Shares (Long) | 9,770,150 (ex 13D/G) - change of 0.12MM shares 1.20% MRQ |
| Institutional Value (Long) | $ 67,151 USD ($1000) |
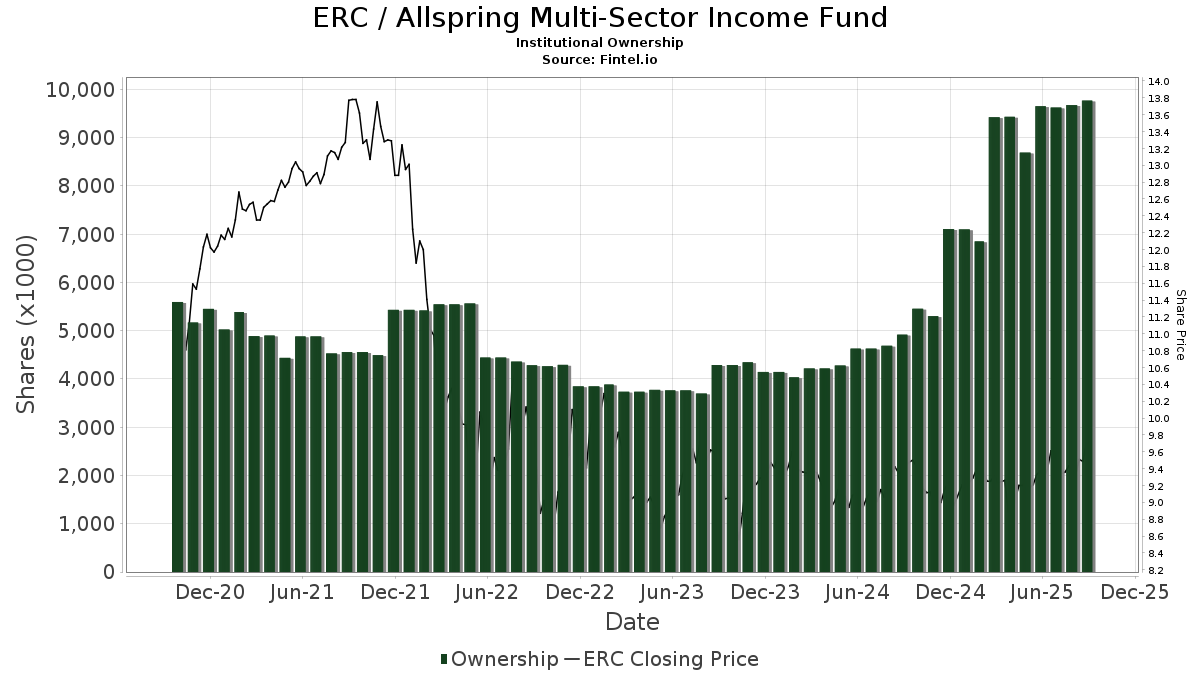
Institutional Ownership and Shareholders
Allspring Multi-Sector Income Fund (US:ERC) has 70 institutional owners and shareholders that have filed 13D/G or 13F forms with the Securities Exchange Commission (SEC). These institutions hold a total of 9,770,150 shares. Largest shareholders include Sit Investment Associates Inc, Raymond James Financial Inc, 1607 Capital Partners, LLC, Royal Bank Of Canada, Morgan Stanley, Invesco Ltd., Pathstone Holdings, LLC, PCEF - Invesco CEF Income Composite ETF, Guggenheim Capital Llc, and Shaker Financial Services, LLC .
Allspring Multi-Sector Income Fund (NYSEAM:ERC) institutional ownership structure shows current positions in the company by institutions and funds, as well as latest changes in position size. Major shareholders can include individual investors, mutual funds, hedge funds, or institutions. The Schedule 13D indicates that the investor holds (or held) more than 5% of the company and intends (or intended) to actively pursue a change in business strategy. Schedule 13G indicates a passive investment of over 5%.
The share price as of September 9, 2025 is 9.66 / share. Previously, on September 10, 2024, the share price was 9.35 / share. This represents an increase of 3.32% over that period.
Fund Sentiment Score
The Fund Sentiment Score (fka Ownership Accumulation Score) finds the stocks that are being most bought by funds. It is the result of a sophisticated, multi-factor quantitative model that identifies companies with the highest levels of institutional accumulation. The scoring model uses a combination of the total increase in disclosed owners, the changes in portfolio allocations in those owners and other metrics. The number ranges from 0 to 100, with higher numbers indicating a higher level of accumulation to its peers, and 50 being the average.
Update Frequency: Daily
See Ownership Explorer, which provides a list of highest-ranking companies.
Institutional Put/Call Ratio
In addition to reporting standard equity and debt issues, institutions with more than 100MM assets under management must also disclose their put and call option holdings. Since put options generally indicate negative sentiment, and call options indicate positive sentiment, we can get a sense of the overall institutional sentiment by plotting the ratio of puts to calls. The chart to the right plots the historical put/call ratio for this instrument.
Using Put/Call Ratio as an indicator of investor sentiment overcomes one of the key deficiencies of using total institutional ownership, which is that a significant amount of assets under management are invested passively to track indices. Passively-managed funds do not typically buy options, so the put/call ratio indicator more closely tracks the sentiment of actively-managed funds.
13D/G Filings
We present 13D/G filings separately from the 13F filings because of the different treatement by the SEC. 13D/G filings can be filed by groups of investors (with one leading), whereas 13F filings cannot. This results in situations where an investor may file a 13D/G reporting one value for the total shares (representing all the shares owned by the investor group), but then file a 13F reporting a different value for the total shares (representing strictly their own ownership). This means that share ownership of 13D/G filings and 13F filings are oftentimes not directly comparable, so we present them separately.
Note: As of May 16, 2021, we no longer show owners that have not filed a 13D/G within the last year. Previously, we were showing the full history of 13D/G filings. In general, entities that are required to file 13D/G filings must file at least annually before submitting a closing filing. However, funds sometimes exit positions without submitting a closing filing (ie, they wind down), so displaying the full history sometimes resulted in confusion about the current ownership. To prevent confusion, we now only show ’current’ owners - that is - owners that have filed within the last year.
Upgrade to unlock premium data.
| File Date | Form | Investor | Prev Shares |
Latest Shares |
Δ Shares (Percent) |
Ownership (Percent) |
Δ Ownership (Percent) |
|
|---|---|---|---|---|---|---|---|---|
| 2025-04-02 | SIT INVESTMENT ASSOCIATES INC | 1,503,246 | 2,232,680 | 48.52 | 8.00 | 86.05 | ||
| 2025-01-17 | FIRST TRUST PORTFOLIOS LP | 3,231,043 | 2,529,661 | -21.71 | 9.02 | -21.70 |
13F and NPORT Filings
Detail on 13F filings are free. Detail on NP filings require a premium membership. Green rows indicate new positions. Red rows indicate closed positions. Click the link icon to see the full transaction history.
Upgrade
to unlock premium data and export to Excel ![]() .
.
| File Date | Source | Investor | Type | Avg Price (Est) |
Shares | Δ Shares (%) |
Reported Value ($1000) |
Δ Value (%) |
Port Alloc (%) |
|
|---|---|---|---|---|---|---|---|---|---|---|
| 2025-08-08 | 13F | Calamos Advisors LLC | 0 | -100.00 | 0 | |||||
| 2025-08-05 | 13F | Rareview Capital LLC | 121,778 | -28.26 | 1,151 | -26.52 | ||||
| 2025-08-07 | 13F | Allworth Financial LP | 11,073 | 105 | ||||||
| 2025-08-15 | 13F | Equitable Holdings, Inc. | 55,958 | 0.97 | 529 | 3.53 | ||||
| 2025-07-17 | 13F | Nelson, Van Denburg & Campbell Wealth Management Group, LLC | 0 | -100.00 | 0 | |||||
| 2025-07-17 | 13F/A | Capital Investment Advisors, LLC | 44,717 | 6.53 | 423 | 9.04 | ||||
| 2025-07-29 | 13F | Private Trust Co Na | 2,000 | 0.00 | 19 | 0.00 | ||||
| 2025-08-08 | 13F | City Of London Investment Management Co Ltd | 33,304 | -7.50 | 315 | -5.14 | ||||
| 2025-08-12 | 13F | Landscape Capital Management, L.l.c. | 0 | -100.00 | 0 | |||||
| 2025-08-07 | 13F | Encompass More Asset Management | 13,711 | 0.65 | 130 | 3.20 | ||||
| 2025-07-10 | 13F | Wealth Enhancement Advisory Services, Llc | 21,717 | 207 | ||||||
| 2025-08-14 | 13F | Cnh Partners Llc | 0 | -100.00 | 0 | |||||
| 2025-08-14 | 13F | Stifel Financial Corp | 66,514 | -3.70 | 629 | -1.26 | ||||
| 2025-08-15 | 13F | Morgan Stanley | 579,671 | -3.65 | 5,478 | -1.26 | ||||
| 2025-07-17 | 13F | Uncommon Cents Investing LLC | 33,425 | -4.25 | 316 | -1.87 | ||||
| 2025-08-27 | NP | RYDEX VARIABLE TRUST - Multi-Hedge Strategies Fund Variable Annuity | 333 | -21.09 | 3 | 0.00 | ||||
| 2025-08-14 | 13F | 1607 Capital Partners, LLC | 783,634 | 3.27 | 7,405 | 5.85 | ||||
| 2025-08-01 | 13F | Envestnet Asset Management Inc | 31,028 | 23.37 | 293 | 26.84 | ||||
| 2025-08-11 | 13F | Private Advisor Group, LLC | 18,570 | 36.85 | 175 | 40.00 | ||||
| 2025-07-14 | 13F | Sowell Financial Services LLC | 164,342 | -0.26 | 1,553 | 2.24 | ||||
| 2025-08-20 | NP | ADANX - AQR Diversified Arbitrage Fund Class N | 7,693 | -73.70 | 73 | -73.23 | ||||
| 2025-08-11 | 13F | WPG Advisers, LLC | 150 | -22.68 | 1 | 0.00 | ||||
| 2025-08-14 | 13F | Sit Investment Associates Inc | 2,455,899 | 10.00 | 23 | 15.00 | ||||
| 2025-08-14 | 13F | Bank Of America Corp /de/ | 74,002 | -9.30 | 699 | -7.05 | ||||
| 2025-08-15 | 13F | Provenance Wealth Advisors, LLC | 0 | -100.00 | 0 | -100.00 | ||||
| 2025-08-07 | 13F | Nwam Llc | 12,859 | 0.00 | 120 | 1.69 | ||||
| 2025-08-12 | 13F | Pathstone Holdings, LLC | 479,293 | -27.19 | 4,529 | -25.53 | ||||
| 2025-07-28 | NP | PCEF - Invesco CEF Income Composite ETF This fund is a listed as child fund of Invesco Ltd. and if that institution has disclosed ownership in this security, then these positions will not be double counted when calculating total shares and total value | 349,353 | -10.18 | 3,249 | -9.90 | ||||
| 2025-08-07 | 13F | Readystate Asset Management Lp | 14,800 | 140 | ||||||
| 2025-05-12 | 13F | Independent Advisor Alliance | 0 | -100.00 | 0 | |||||
| 2025-05-13 | 13F | HighTower Advisors, LLC | 0 | -100.00 | 0 | |||||
| 2025-07-25 | 13F | Apollon Wealth Management, LLC | 18,365 | 0.00 | 174 | 2.37 | ||||
| 2025-07-29 | 13F | International Assets Investment Management, Llc | 34,402 | 6.17 | 325 | 9.06 | ||||
| 2025-04-23 | 13F | Bessemer Group Inc | 0 | -100.00 | 0 | |||||
| 2025-05-16 | 13F | Coppell Advisory Solutions LLC | 0 | -100.00 | 0 | |||||
| 2025-08-13 | 13F | Northwestern Mutual Wealth Management Co | 134,484 | -0.59 | 1,271 | 1.84 | ||||
| 2025-08-08 | 13F | Kingsview Wealth Management, LLC | 15,150 | 0.00 | 143 | 2.88 | ||||
| 2025-06-27 | NP | Calamos ETF Trust - Calamos CEF Income & Arbitrage ETF | 33,781 | -42.18 | 311 | -42.80 | ||||
| 2025-05-15 | 13F | Citadel Advisors Llc | 0 | -100.00 | 0 | |||||
| 2025-05-07 | 13F | Sheaff Brock Investment Advisors, LLC | 11,063 | 0.20 | 102 | 0.99 | ||||
| 2025-07-25 | 13F | Concurrent Investment Advisors, LLC | 22,534 | 2.58 | 213 | 4.95 | ||||
| 2025-08-12 | 13F | Steward Partners Investment Advisory, Llc | 13,830 | -1.14 | 131 | 1.56 | ||||
| 2025-08-27 | NP | RYMSX - Guggenheim Multi-Hedge Strategies Fund Class P | 199 | -38.39 | 2 | -50.00 | ||||
| 2025-08-13 | 13F | Guggenheim Capital Llc | 334,994 | 94.56 | 3,166 | 99.43 | ||||
| 2025-08-12 | 13F | Coldstream Capital Management Inc | 0 | -100.00 | 0 | |||||
| 2025-08-08 | 13F | Fiera Capital Corp | 112,946 | -0.95 | 1,067 | 1.52 | ||||
| 2025-08-14 | 13F | CoreCap Advisors, LLC | 2,437 | -22.31 | 23 | -17.86 | ||||
| 2025-08-14 | 13F | Peapack Gladstone Financial Corp | 10,132 | -46.91 | 0 | |||||
| 2025-08-06 | 13F | Moors & Cabot, Inc. | 0 | -100.00 | 0 | |||||
| 2025-08-12 | 13F | LPL Financial LLC | 67,756 | 9.91 | 640 | 12.68 | ||||
| 2025-08-08 | 13F | Cetera Investment Advisers | 20,800 | -0.11 | 197 | 2.62 | ||||
| 2025-08-18 | 13F | Geneos Wealth Management Inc. | 2,034 | 39.60 | 19 | 46.15 | ||||
| 2025-08-18 | 13F | Hollencrest Capital Management | 4,964 | 0.00 | 47 | 2.22 | ||||
| 2025-08-14 | 13F | Mariner, LLC | 22,189 | -3.48 | 210 | -0.95 | ||||
| 2025-08-05 | 13F | Shaker Financial Services, LLC | 315,553 | -5.40 | 3,005 | -3.10 | ||||
| 2025-05-06 | 13F | Rsm Us Wealth Management Llc | 0 | -100.00 | 0 | |||||
| 2025-07-31 | 13F | Cambridge Investment Research Advisors, Inc. | 42,469 | 52.54 | 0 | |||||
| 2025-08-11 | 13F | VSM Wealth Advisory, LLC | 6,187 | 4.85 | 58 | 7.41 | ||||
| 2025-08-14 | 13F | Benjamin Edwards Inc | 85,854 | -25.94 | 811 | -24.06 | ||||
| 2025-08-14 | 13F | Ameriprise Financial Inc | 193,427 | 10.77 | 1,828 | 13.48 | ||||
| 2025-08-12 | 13F | Proequities, Inc. | 0 | 0 | ||||||
| 2025-08-14 | 13F | Hrt Financial Lp | 0 | -100.00 | 0 | |||||
| 2025-07-23 | 13F | Morey & Quinn Wealth Partners, LLC | 63,451 | 0.00 | 600 | 2.39 | ||||
| 2025-08-08 | 13F | Pnc Financial Services Group, Inc. | 602 | 0.00 | 6 | 0.00 | ||||
| 2025-08-14 | 13F | Cohen & Steers, Inc. | 143,767 | 0.00 | 1 | 0.00 | ||||
| 2025-07-17 | 13F | GraniteShares Advisors LLC | 305,503 | 6.67 | 2,887 | 9.36 | ||||
| 2025-05-14 | 13F | Thomas J. Herzfeld Advisors, Inc. | 0 | -100.00 | 0 | |||||
| 2025-08-28 | NP | RDFI - RAREVIEW DYNAMIC FIXED INCOME ETF | 120,256 | -28.53 | 1,136 | -26.76 | ||||
| 2025-08-11 | 13F | Elequin Capital Lp | 5,490 | 258.36 | 52 | 264.29 | ||||
| 2025-08-14 | 13F | Raymond James Financial Inc | 803,542 | 10.23 | 7,593 | 12.99 | ||||
| 2025-08-12 | 13F | Global Retirement Partners, LLC | 1,000 | 9 | ||||||
| 2025-07-30 | 13F | FNY Investment Advisers, LLC | 1,600 | 0.00 | 0 | |||||
| 2025-07-09 | 13F | Dynamic Advisor Solutions LLC | 12,505 | -8.21 | 118 | -5.60 | ||||
| 2025-08-06 | 13F | Commonwealth Equity Services, Llc | 10,440 | 1.23 | 0 | |||||
| 2025-08-13 | 13F | Invesco Ltd. | 522,545 | 3.84 | 4,938 | 6.45 | ||||
| 2025-08-14 | 13F | Comerica Bank | 5,341 | 6.08 | 50 | 8.70 | ||||
| 2025-07-21 | 13F | Catalina Capital Group, LLC | 10,864 | -0.26 | 103 | 2.00 | ||||
| 2025-08-29 | NP | GraniteShares ETF Trust - GraniteShares HIPS US High Income ETF | 305,503 | 6.67 | 2,887 | 9.36 | ||||
| 2025-08-14 | 13F | Wells Fargo & Company/mn | 0 | -100.00 | 0 | |||||
| 2025-08-14 | 13F | McIlrath & Eck, LLC | 1,510 | 0.00 | 14 | 7.69 | ||||
| 2025-08-14 | 13F | Royal Bank Of Canada | 668,724 | 20.34 | 6,319 | 23.32 | ||||
| 2025-04-09 | 13F | Selway Asset Management | 28,129 | -1.42 | 259 | -1.15 | ||||
| 2025-09-04 | 13F/A | Advisor Group Holdings, Inc. | 75,808 | 7.98 | 716 | 10.66 | ||||
| 2025-08-14 | 13F | Susquehanna International Group, Llp | 0 | -100.00 | 0 | |||||
| 2025-08-14 | 13F | GWM Advisors LLC | 23,900 | -12.77 | 226 | -10.71 | ||||
| 2025-08-12 | 13F | AlphaCore Capital LLC | 30,000 | 0.00 | 286 | 2.52 | ||||
| 2025-08-14 | 13F | UBS Group AG | 97,649 | -28.81 | 923 | -27.06 |