Basic Stats
| Portfolio Value | $ 242,440,737 |
| Current Positions | 75 |
Latest Holdings, Performance, AUM (from 13F, 13D)
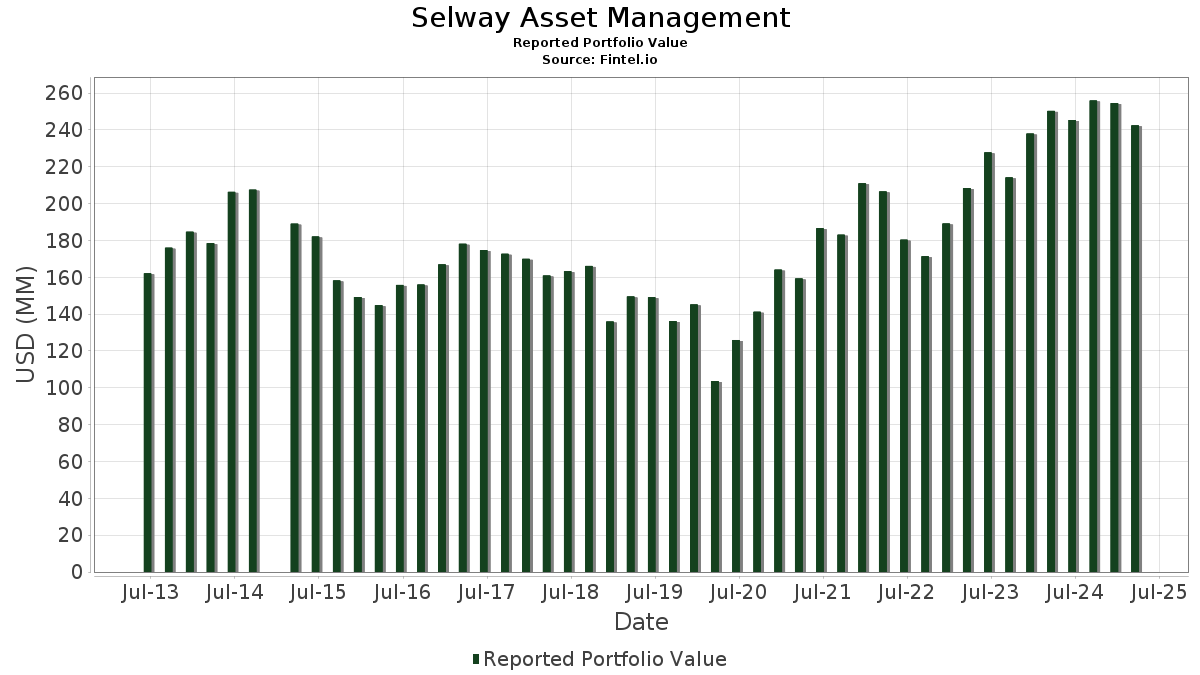
Selway Asset Management has disclosed 75 total holdings in their latest SEC filings. Most recent portfolio value is calculated to be $ 242,440,737 USD. Actual Assets Under Management (AUM) is this value plus cash (which is not disclosed). Selway Asset Management’s top holdings are Apple Inc. (US:AAPL) , iShares Trust - iShares Short Treasury Bond ETF (US:SHV) , Microsoft Corporation (US:MSFT) , JPMorgan Chase & Co. (US:JPM) , and Alphabet Inc. (US:GOOGL) . Selway Asset Management’s new positions include J.P. Morgan Exchange-Traded Fund Trust - JPMorgan Nasdaq Equity Premium Income ETF (US:JEPQ) , .
Top Increases This Quarter
We use the change in the portfolio allocation because this is the most meaningful metric. Changes can be due to trades or changes in share prices.
| Security | Shares (MM) |
Value (MM$) |
Portfolio % | ΔPortfolio % |
|---|---|---|---|---|
| 0.01 | 4.85 | 2.0012 | 2.0012 | |
| 0.18 | 19.97 | 8.2362 | 0.7558 | |
| 0.02 | 7.32 | 3.0191 | 0.5839 | |
| 0.05 | 3.45 | 1.4217 | 0.4103 | |
| 0.01 | 4.47 | 1.8450 | 0.3841 | |
| 0.03 | 5.17 | 2.1339 | 0.3694 | |
| 0.02 | 6.62 | 2.7313 | 0.3593 | |
| 0.01 | 4.63 | 1.9088 | 0.2676 | |
| 0.03 | 3.61 | 1.4887 | 0.2591 | |
| 0.11 | 7.07 | 2.9161 | 0.2379 |
Top Decreases This Quarter
We use the change in the portfolio allocation because this is the most meaningful metric. Changes can be due to trades or changes in share prices.
| Security | Shares (MM) |
Value (MM$) |
Portfolio % | ΔPortfolio % |
|---|---|---|---|---|
| 0.11 | 23.64 | 9.7513 | -1.7264 | |
| 0.00 | 0.57 | 0.2355 | -1.0814 | |
| 0.06 | 9.07 | 3.7409 | -0.5062 | |
| 0.04 | 13.72 | 5.6599 | -0.4134 | |
| 0.06 | 1.31 | 0.5395 | -0.2828 | |
| 0.04 | 2.32 | 0.9572 | -0.2689 | |
| 0.03 | 3.82 | 1.5755 | -0.2677 | |
| 0.02 | 2.68 | 1.1044 | -0.2504 | |
| 0.02 | 5.55 | 2.2886 | -0.2387 | |
| 0.03 | 1.95 | 0.8054 | -0.2376 |
13F and Fund Filings
This form was filed on 2025-04-09 for the reporting period 2025-03-31. Click the link icon to see the full transaction history.
Upgrade to unlock premium data and export to Excel ![]() .
.
| Security | Type | Avg Share Price | Shares (MM) |
ΔShares (%) |
ΔShares (%) |
Value ($MM) |
Portfolio (%) |
ΔPortfolio (%) |
|
|---|---|---|---|---|---|---|---|---|---|
| AAPL / Apple Inc. | 0.11 | -8.77 | 23.64 | -19.08 | 9.7513 | -1.7264 | |||
| SHV / iShares Trust - iShares Short Treasury Bond ETF | 0.18 | 4.54 | 19.97 | 4.87 | 8.2362 | 0.7558 | |||
| MSFT / Microsoft Corporation | 0.04 | -0.34 | 13.72 | -11.24 | 5.6599 | -0.4134 | |||
| JPM / JPMorgan Chase & Co. | 0.04 | -2.58 | 9.68 | -0.30 | 3.9927 | 0.1781 | |||
| GOOGL / Alphabet Inc. | 0.06 | 2.70 | 9.07 | -16.11 | 3.7409 | -0.5062 | |||
| HD / The Home Depot, Inc. | 0.02 | 0.36 | 7.68 | -5.44 | 3.1695 | -0.0232 | |||
| CI / The Cigna Group | 0.02 | -0.89 | 7.32 | 18.09 | 3.0191 | 0.5839 | |||
| QCOM / QUALCOMM Incorporated | 0.05 | -0.62 | 7.11 | -0.63 | 2.9341 | 0.1218 | |||
| CSCO / Cisco Systems, Inc. | 0.11 | -0.51 | 7.07 | 3.70 | 2.9161 | 0.2379 | |||
| FI / Fiserv, Inc. | 0.03 | -9.23 | 6.95 | -2.42 | 2.8651 | 0.0684 | |||
| CB / Chubb Limited | 0.02 | 0.34 | 6.62 | 9.67 | 2.7313 | 0.3593 | |||
| ORCL / Oracle Corporation | 0.05 | 18.44 | 6.42 | -0.63 | 2.6484 | 0.1099 | |||
| FDX / FedEx Corporation | 0.02 | -0.46 | 5.55 | -13.74 | 2.2886 | -0.2387 | |||
| CMI / Cummins Inc. | 0.02 | -0.17 | 5.51 | -10.23 | 2.2732 | -0.1389 | |||
| CVX / Chevron Corporation | 0.03 | -0.27 | 5.17 | 15.19 | 2.1339 | 0.3694 | |||
| AXP / American Express Company | 0.02 | 0.41 | 4.94 | -8.96 | 2.0361 | -0.0944 | |||
| ADBE / Adobe Inc. | 0.01 | 4.85 | 2.0012 | 2.0012 | |||||
| DE / Deere & Company | 0.01 | 0.00 | 4.63 | 10.77 | 1.9088 | 0.2676 | |||
| AMGN / Amgen Inc. | 0.01 | 0.63 | 4.47 | 20.28 | 1.8450 | 0.3841 | |||
| AMZN / Amazon.com, Inc. | 0.02 | -2.54 | 4.19 | -15.49 | 1.7281 | -0.2194 | |||
| BDX / Becton, Dickinson and Company | 0.02 | 0.00 | 3.93 | 0.98 | 1.6211 | 0.0918 | |||
| GNRC / Generac Holdings Inc. | 0.03 | -0.33 | 3.82 | -18.59 | 1.5755 | -0.2677 | |||
| RTX / RTX Corporation | 0.03 | 0.74 | 3.61 | 15.34 | 1.4887 | 0.2591 | |||
| PEP / PepsiCo, Inc. | 0.02 | 0.19 | 3.54 | -1.20 | 1.4606 | 0.0525 | |||
| CARR / Carrier Global Corporation | 0.05 | 44.14 | 3.45 | 33.88 | 1.4217 | 0.4103 | |||
| META / Meta Platforms, Inc. | 0.01 | -5.26 | 3.11 | -6.74 | 1.2838 | -0.0274 | |||
| PMF / PIMCO Municipal Income Fund | 0.34 | -6.58 | 3.01 | -8.03 | 1.2430 | -0.0443 | |||
| MPC / Marathon Petroleum Corporation | 0.02 | 1.53 | 2.90 | 6.03 | 1.1968 | 0.1218 | |||
| ET / Energy Transfer LP - Limited Partnership | 0.15 | -9.15 | 2.77 | -13.79 | 1.1425 | -0.1197 | |||
| ZBH / Zimmer Biomet Holdings, Inc. | 0.02 | -5.16 | 2.70 | 1.62 | 1.1148 | 0.0699 | |||
| TFX / Teleflex Incorporated | 0.02 | 0.00 | 2.68 | -22.36 | 1.1044 | -0.2504 | |||
| SPY / SPDR S&P 500 ETF | 0.00 | -6.90 | 2.45 | -11.13 | 1.0115 | -0.0727 | |||
| PYPL / PayPal Holdings, Inc. | 0.04 | -2.73 | 2.32 | -25.64 | 0.9572 | -0.2689 | |||
| CTSH / Cognizant Technology Solutions Corporation | 0.03 | -0.66 | 2.32 | -1.19 | 0.9569 | 0.0347 | |||
| SVXY / ProShares Trust II - ProShares Short VIX Short-Term Futures ETF | 0.05 | -4.02 | 2.30 | -12.26 | 0.9475 | -0.0811 | |||
| OTIS / Otis Worldwide Corporation | 0.02 | 1.00 | 2.09 | 12.51 | 0.8607 | 0.1323 | |||
| C / Citigroup Inc. | 0.03 | -9.93 | 1.96 | -9.16 | 0.8101 | -0.0393 | |||
| WFC / Wells Fargo & Company | 0.03 | -28.04 | 1.95 | -26.48 | 0.8054 | -0.2376 | |||
| V / Visa Inc. | 0.01 | 0.00 | 1.87 | 10.91 | 0.7719 | 0.1089 | |||
| GS / The Goldman Sachs Group, Inc. | 0.00 | 23.28 | 1.66 | 17.61 | 0.6861 | 0.1305 | |||
| XLV / The Select Sector SPDR Trust - The Health Care Select Sector SPDR Fund | 0.01 | -2.00 | 1.43 | 4.01 | 0.5890 | 0.0496 | |||
| DIS / The Walt Disney Company | 0.01 | -6.52 | 1.41 | -17.12 | 0.5833 | -0.0872 | |||
| SVIX / Vs Trust - Volatility Shares Short Vix Futures ETF | 0.06 | -22.06 | 1.31 | -37.55 | 0.5395 | -0.2828 | |||
| STT / State Street Corporation | 0.01 | -4.17 | 1.24 | -12.60 | 0.5096 | -0.0456 | |||
| COF / Capital One Financial Corporation | 0.01 | 0.00 | 1.21 | 0.58 | 0.4979 | 0.0263 | |||
| BRK.B / Berkshire Hathaway Inc. | 0.00 | -1.53 | 1.20 | 15.75 | 0.4943 | 0.0874 | |||
| PII / Polaris Inc. | 0.03 | -0.89 | 1.14 | -29.63 | 0.4685 | -0.1652 | |||
| SYY / Sysco Corporation | 0.01 | 0.00 | 1.12 | -1.84 | 0.4616 | 0.0136 | |||
| BHK / BlackRock Core Bond Trust | 0.09 | -10.81 | 1.02 | -7.50 | 0.4228 | -0.0125 | |||
| GME / GameStop Corp. | 0.04 | 57.89 | 1.00 | 12.43 | 0.4143 | 0.0634 | |||
| VGT / Vanguard World Fund - Vanguard Information Technology ETF | 0.00 | 2.94 | 0.95 | -10.22 | 0.3915 | -0.0238 | |||
| BMY / Bristol-Myers Squibb Company | 0.01 | 0.00 | 0.87 | 7.90 | 0.3605 | 0.0421 | |||
| COR / Cencora, Inc. | 0.00 | 0.00 | 0.77 | 23.76 | 0.3183 | 0.0734 | |||
| MLPB / ETRACS Alerian MLP Infrastructure Index ETN - Corporate Bond/Note | 0.03 | 0.00 | 0.72 | 10.31 | 0.2958 | 0.0402 | |||
| EVV / Eaton Vance Limited Duration Income Fund | 0.06 | -2.42 | 0.59 | -0.34 | 0.2445 | 0.0109 | |||
| AVGO / Broadcom Inc. | 0.00 | -23.08 | 0.59 | -44.40 | 0.2417 | -0.1727 | |||
| ETN / Eaton Corporation plc | 0.00 | -79.21 | 0.57 | -82.99 | 0.2355 | -1.0814 | |||
| BGB / Blackstone Strategic Credit 2027 Term Fund | 0.05 | -9.44 | 0.57 | -10.57 | 0.2342 | -0.0152 | |||
| RSP / Invesco Exchange-Traded Fund Trust - Invesco S&P 500 Equal Weight ETF | 0.00 | -18.48 | 0.53 | -19.46 | 0.2206 | -0.0401 | |||
| PML / PIMCO Municipal Income Fund II | 0.06 | 300.00 | 0.49 | 301.65 | 0.2005 | 0.1528 | |||
| HPI / John Hancock Preferred Income Fund | 0.03 | 52.49 | 0.45 | 51.84 | 0.1877 | 0.0702 | |||
| IBM / International Business Machines Corporation | 0.00 | -49.30 | 0.45 | -42.69 | 0.1846 | -0.1220 | |||
| IJH / iShares Trust - iShares Core S&P Mid-Cap ETF | 0.01 | 0.00 | 0.41 | -6.42 | 0.1685 | -0.0029 | |||
| HPS / John Hancock Preferred Income Fund III | 0.03 | -2.47 | 0.40 | -2.66 | 0.1660 | 0.0036 | |||
| EAD / Wells Fargo Advantage Funds - Allspring Income Opportunities Fund | 0.06 | -15.94 | 0.40 | -16.63 | 0.1637 | -0.0231 | |||
| LRCX / Lam Research Corporation | 0.01 | 0.00 | 0.36 | 0.55 | 0.1499 | 0.0081 | |||
| IJR / iShares Trust - iShares Core S&P Small-Cap ETF | 0.00 | 0.00 | 0.31 | -9.28 | 0.1294 | -0.0064 | |||
| JNJ / Johnson & Johnson | 0.00 | -5.86 | 0.29 | 8.12 | 0.1209 | 0.0142 | |||
| XOM / Exxon Mobil Corporation | 0.00 | -20.66 | 0.29 | -12.31 | 0.1177 | -0.0101 | |||
| ERC / Allspring Multi-Sector Income Fund | 0.03 | -1.42 | 0.26 | -1.15 | 0.1070 | 0.0040 | |||
| GOOG / Alphabet Inc. | 0.00 | 0.00 | 0.25 | -18.09 | 0.1031 | -0.0166 | |||
| BITF / Bitfarms Ltd. | 0.30 | 0.00 | 0.24 | -47.11 | 0.0982 | -0.0786 | |||
| VTI / Vanguard Index Funds - Vanguard Total Stock Market ETF | 0.00 | 0.00 | 0.22 | -5.19 | 0.0907 | -0.0004 | |||
| JEPQ / J.P. Morgan Exchange-Traded Fund Trust - JPMorgan Nasdaq Equity Premium Income ETF | 0.00 | 0.21 | 0.0854 | 0.0854 | |||||
| FRA / BlackRock Floating Rate Income Strategies Fund, Inc. | 0.01 | -9.16 | 0.15 | -15.00 | 0.0634 | -0.0073 | |||
| NVDA / NVIDIA Corporation | 0.00 | -100.00 | 0.00 | -100.00 | -0.1055 | ||||
| CVNA / Carvana Co. | 0.00 | -100.00 | 0.00 | -100.00 | -0.0799 | ||||
| MSTR / Strategy Inc | 0.00 | -100.00 | 0.00 | 0.0000 | |||||
| JACK / Jack in the Box Inc. | 0.00 | -100.00 | 0.00 | 0.0000 | |||||
| BITF / Bitfarms Ltd. | Call | 0.00 | -100.00 | 0.00 | -100.00 | -0.0234 |