Basic Stats
| Institutional Owners | 81 total, 68 long only, 3 short only, 10 long/short - change of % MRQ |
| Average Portfolio Allocation | 0.9866 % - change of % MRQ |
| Shares Outstanding | shares (source: Capital IQ) |
| Institutional Shares (Long) | 125,352,593 - 31.25% (ex 13D/G) |
| Institutional Value (Long) | $ 1,468,401 USD ($1000) |
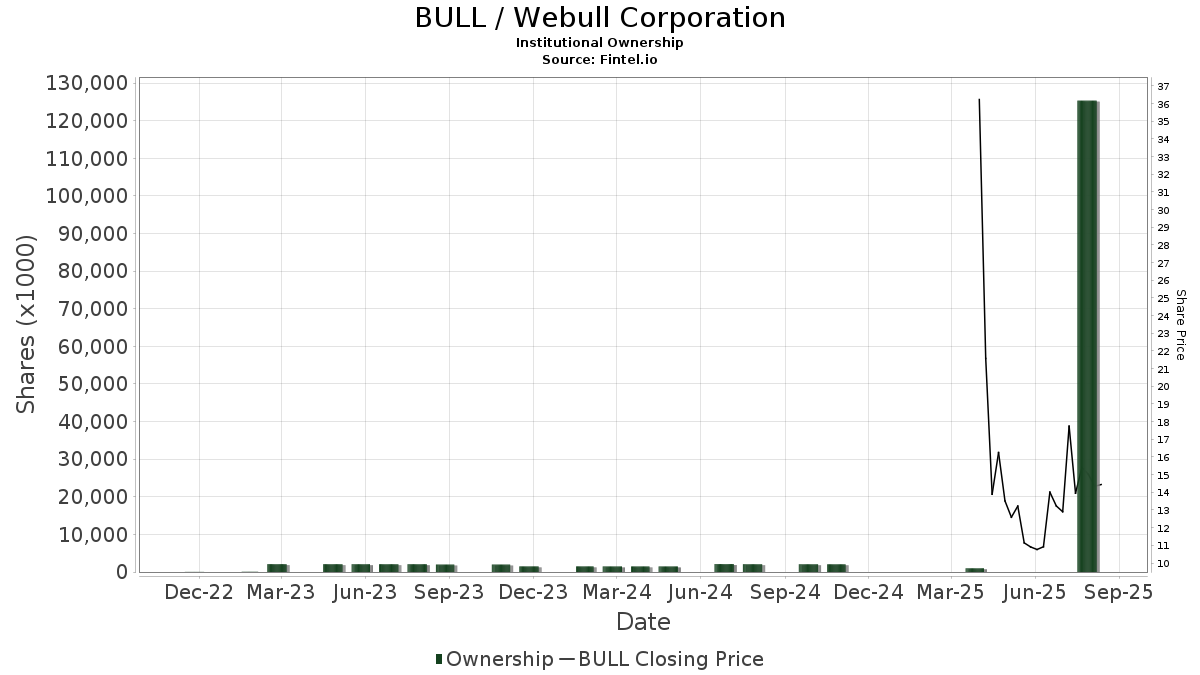
Institutional Ownership and Shareholders
Webull Corporation (US:BULL) has 81 institutional owners and shareholders that have filed 13D/G or 13F forms with the Securities Exchange Commission (SEC). These institutions hold a total of 125,352,593 shares. Largest shareholders include Hillhouse Capital Advisors, Ltd., Peak6 Llc, Tiger Global Management Llc, Coatue Management Llc, Rit Capital Partners Plc, SC CHINA HOLDING Ltd, Lightspeed Management Company, L.L.C., General Atlantic Llc, Susquehanna International Group, Llp, and Susquehanna International Group, Llp .
Webull Corporation (NasdaqCM:BULL) institutional ownership structure shows current positions in the company by institutions and funds, as well as latest changes in position size. Major shareholders can include individual investors, mutual funds, hedge funds, or institutions. The Schedule 13D indicates that the investor holds (or held) more than 5% of the company and intends (or intended) to actively pursue a change in business strategy. Schedule 13G indicates a passive investment of over 5%.
The share price as of September 5, 2025 is 12.93 / share. Previously, on April 11, 2025, the share price was 13.25 / share. This represents a decline of 2.42% over that period.
Fund Sentiment Score
The Fund Sentiment Score (fka Ownership Accumulation Score) finds the stocks that are being most bought by funds. It is the result of a sophisticated, multi-factor quantitative model that identifies companies with the highest levels of institutional accumulation. The scoring model uses a combination of the total increase in disclosed owners, the changes in portfolio allocations in those owners and other metrics. The number ranges from 0 to 100, with higher numbers indicating a higher level of accumulation to its peers, and 50 being the average.
Update Frequency: Daily
See Ownership Explorer, which provides a list of highest-ranking companies.
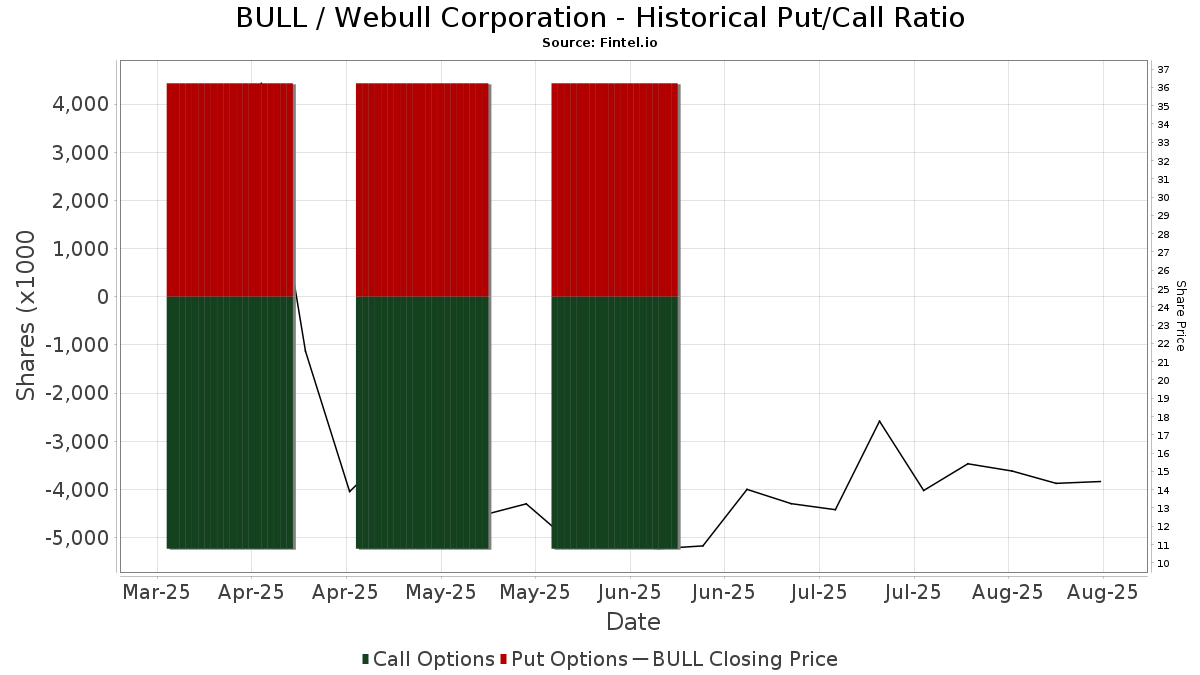
Institutional Put/Call Ratio
In addition to reporting standard equity and debt issues, institutions with more than 100MM assets under management must also disclose their put and call option holdings. Since put options generally indicate negative sentiment, and call options indicate positive sentiment, we can get a sense of the overall institutional sentiment by plotting the ratio of puts to calls. The chart to the right plots the historical put/call ratio for this instrument.
Using Put/Call Ratio as an indicator of investor sentiment overcomes one of the key deficiencies of using total institutional ownership, which is that a significant amount of assets under management are invested passively to track indices. Passively-managed funds do not typically buy options, so the put/call ratio indicator more closely tracks the sentiment of actively-managed funds.
13D/G Filings
We present 13D/G filings separately from the 13F filings because of the different treatement by the SEC. 13D/G filings can be filed by groups of investors (with one leading), whereas 13F filings cannot. This results in situations where an investor may file a 13D/G reporting one value for the total shares (representing all the shares owned by the investor group), but then file a 13F reporting a different value for the total shares (representing strictly their own ownership). This means that share ownership of 13D/G filings and 13F filings are oftentimes not directly comparable, so we present them separately.
Note: As of May 16, 2021, we no longer show owners that have not filed a 13D/G within the last year. Previously, we were showing the full history of 13D/G filings. In general, entities that are required to file 13D/G filings must file at least annually before submitting a closing filing. However, funds sometimes exit positions without submitting a closing filing (ie, they wind down), so displaying the full history sometimes resulted in confusion about the current ownership. To prevent confusion, we now only show ’current’ owners - that is - owners that have filed within the last year.
Upgrade to unlock premium data.
| File Date | Form | Investor | Prev Shares |
Latest Shares |
Δ Shares (Percent) |
Ownership (Percent) |
Δ Ownership (Percent) |
|
|---|---|---|---|---|---|---|---|---|
| 2025-08-18 | Yuan Jun | 29,758,301 | 7.40 | |||||
| 2025-08-14 | Wang Anquan | 93,251,500 | 19.20 | |||||
| 2025-08-14 | PEAK6 LLC | 26,567,832 | 5.50 | |||||
| 2025-08-14 | SIG Asia Investment, LLLP | 24,152,813 | 6.40 | |||||
| 2025-08-12 | Lishui Bojiang Chuangfu 2nd Equity Investment Partnership (Limited Partnership) | 29,151,428 | 7.30 | |||||
| 2025-08-12 | Tianjin Nuofeng Enterprise Management Consulting Partnership (Limited Partnership) | 37,594,146 | 9.40 | |||||
| 2025-08-12 | HS Investments IV Ltd | 28,592,200 | 7.12 |
13F and NPORT Filings
Detail on 13F filings are free. Detail on NP filings require a premium membership. Green rows indicate new positions. Red rows indicate closed positions. Click the link icon to see the full transaction history.
Upgrade
to unlock premium data and export to Excel ![]() .
.
| File Date | Source | Investor | Type | Avg Price (Est) |
Shares | Δ Shares (%) |
Reported Value ($1000) |
Δ Value (%) |
Port Alloc (%) |
|
|---|---|---|---|---|---|---|---|---|---|---|
| 2025-08-14 | 13F | UBS Group AG | 1,102,023 | 13,180 | ||||||
| 2025-08-14 | 13F | Millennium Management Llc | 102,558 | 1,227 | ||||||
| 2025-08-29 | 13F | Total Investment Management Inc | 5 | 0 | ||||||
| 2025-08-14 | 13F | Jain Global LLC | 303,625 | 3,631 | ||||||
| 2025-08-13 | 13F | Marshall Wace, Llp | 1,235,033 | 14,771 | ||||||
| 2025-07-24 | 13F | IFP Advisors, Inc | 2,000 | 24 | ||||||
| 2025-08-14 | 13F | Css Llc/il | Put | 2,000 | 24 | |||||
| 2025-08-14 | 13F | Css Llc/il | 101,439 | 1,213 | ||||||
| 2025-08-14 | 13F | Engineers Gate Manager LP | 133,667 | 1,599 | ||||||
| 2025-08-12 | 13F | Warberg Asset Management LLC | 30,000 | 359 | ||||||
| 2025-08-11 | 13F | Private Advisor Group, LLC | 17,450 | 209 | ||||||
| 2025-08-14 | 13F | Jane Street Group, Llc | Put | 266,600 | 3,189 | |||||
| 2025-08-11 | 13F | Rit Capital Partners Plc | 10,007,267 | 95,509 | ||||||
| 2025-08-15 | 13F | Morgan Stanley | 329,479 | 3,941 | ||||||
| 2025-08-14 | 13F | Sandia Investment Management LP | 64,497 | 771 | ||||||
| 2025-08-14 | 13F | Lightspeed Management Company, L.L.C. | 7,148,051 | 85,491 | ||||||
| 2025-08-19 | 13F | Marex Group plc | 56,251 | 673 | ||||||
| 2025-08-14 | 13F | Jane Street Group, Llc | Call | 1,241,300 | 14,846 | |||||
| 2025-08-14 | 13F | Mariner, LLC | 21,000 | 251 | ||||||
| 2025-08-14 | 13F | Jane Street Group, Llc | 250,677 | 2,998 | ||||||
| 2025-08-14 | 13F | LMR Partners LLP | 21,577 | 258 | ||||||
| 2025-08-14 | 13F | LMR Partners LLP | Put | 53,300 | 637 | |||||
| 2025-08-13 | 13F | HAP Trading, LLC | Call | 12,700 | 11 | |||||
| 2025-08-14 | 13F | Bank Of America Corp /de/ | 252,199 | 3,016 | ||||||
| 2025-08-14 | 13F | Blackstone Group Inc | Put | 1,000,000 | 11,960 | |||||
| 2025-08-14 | 13F | Federation des caisses Desjardins du Quebec | 600 | 7 | ||||||
| 2025-08-14 | 13F | Goldman Sachs Group Inc | 11,532 | 138 | ||||||
| 2025-08-14 | 13F | Bank Of America Corp /de/ | Put | 250,000 | 2,990 | |||||
| 2025-08-14 | 13F | Tiger Global Management Llc | 11,724,137 | 140,221 | ||||||
| 2025-08-14 | 13F | Caption Management, LLC | Put | 10,000 | 120 | |||||
| 2025-08-11 | 13F | Greenland Capital Management LP | Call | 253,100 | 3,027 | |||||
| 2025-08-12 | 13F | LPL Financial LLC | 17,130 | 205 | ||||||
| 2025-08-04 | 13F | Wolverine Asset Management Llc | 29,433 | 352 | ||||||
| 2025-07-25 | 13F | Sequoia Financial Advisors, LLC | 10,000 | 120 | ||||||
| 2025-08-14 | 13F | Schonfeld Strategic Advisors LLC | 22,484 | 269 | ||||||
| 2025-08-14 | 13F | Peak6 Llc | 26,567,829 | 317,751 | ||||||
| 2025-08-14 | 13F | Peak6 Llc | Put | 20,900 | 250 | |||||
| 2025-08-15 | 13F/A | Cable Car Capital LLC | 87,500 | 1,046 | ||||||
| 2025-08-14 | 13F | Bnp Paribas Arbitrage, Sa | 323,671 | 3,871 | ||||||
| 2025-08-07 | 13F | Marathon Trading Investment Management LLC | 50,041 | 598 | ||||||
| 2025-08-14 | 13F | Peak6 Llc | Call | 566,600 | 6,777 | |||||
| 2025-08-14 | 13F | Two Sigma Investments, Lp | 83,858 | 1,003 | ||||||
| 2025-08-08 | 13F | Skaana Management L.P. | Put | 508,100 | 6,077 | |||||
| 2025-08-08 | 13F | Skaana Management L.P. | Call | 359,000 | 4,294 | |||||
| 2025-09-04 | 13F/A | Advisor Group Holdings, Inc. | 2,535 | 30 | ||||||
| 2025-08-08 | 13F | Skaana Management L.P. | 334,277 | 3,998 | ||||||
| 2025-08-08 | 13F | Geode Capital Management, Llc | 318,549 | 3,810 | ||||||
| 2025-08-14 | 13F | Citadel Advisors Llc | 203,132 | 2,429 | ||||||
| 2025-08-14 | 13F | General Atlantic Llc | 7,148,051 | 85,491 | ||||||
| 2025-08-14 | 13F/A | Barclays Plc | 79,565 | 1 | ||||||
| 2025-08-14 | 13F | SC CHINA HOLDING Ltd | 9,457,280 | 113,109 | ||||||
| 2025-08-14 | 13F | Balyasny Asset Management Llc | 219,486 | 2,625 | ||||||
| 2025-08-13 | 13F | Sassicaia Capital Advisers Llc | 148,000 | 1,770 | ||||||
| 2025-08-13 | 13F | Quadrature Capital Ltd | 43,453 | 520 | ||||||
| 2025-07-30 | 13F | FNY Investment Advisers, LLC | Call | 262 | 0 | |||||
| 2025-08-04 | 13F | Wolverine Asset Management Llc | Put | 500 | 6 | |||||
| 2025-08-14 | 13F | Atlas Merchant Capital LLC | 87,000 | 1,041 | ||||||
| 2025-08-08 | 13F | Larson Financial Group LLC | 1 | 0 | ||||||
| 2025-08-18 | 13F/A | National Bank Of Canada /fi/ | 2,800 | 33 | ||||||
| 2025-08-14 | 13F | Polar Asset Management Partners Inc. | 150,000 | 0 | ||||||
| 2025-08-14 | 13F | Susquehanna International Group, Llp | 948,489 | 11,344 | ||||||
| 2025-08-14 | 13F | Susquehanna International Group, Llp | Call | 1,355,600 | 16,213 | |||||
| 2025-08-14 | 13F | Susquehanna International Group, Llp | Put | 1,450,900 | 17,353 | |||||
| 2025-08-13 | 13F | Jones Financial Companies Lllp | 308 | 3 | ||||||
| 2025-08-14 | 13F | Citadel Advisors Llc | Put | 530,400 | 6,344 | |||||
| 2025-08-14 | 13F | Royal Bank Of Canada | 40,950 | 489 | ||||||
| 2025-08-14 | 13F | Hillhouse Capital Advisors, Ltd. | 33,080,846 | 395,647 | ||||||
| 2025-08-14 | 13F | Citadel Advisors Llc | Call | 941,900 | 11,265 | |||||
| 2025-08-14 | 13F | Cnh Partners Llc | 146,070 | 1,747 | ||||||
| 2025-07-31 | 13F | Caitong International Asset Management Co., Ltd | 36,715 | 439 | ||||||
| 2025-08-18 | 13F | Wolverine Trading, Llc | Put | 215,700 | 2,336 | |||||
| 2025-08-05 | 13F | Simplex Trading, Llc | 44,488 | 1 | ||||||
| 2025-08-14 | 13F | Raymond James Financial Inc | 100 | 1 | ||||||
| 2025-08-18 | 13F | Wolverine Trading, Llc | 118,171 | 1,280 | ||||||
| 2025-08-18 | 13F | Wolverine Trading, Llc | Call | 422,200 | 4,572 | |||||
| 2025-08-13 | 13F | Quantbot Technologies LP | 5,945 | 71 | ||||||
| 2025-08-14 | 13F | Azora Capital LP | 770,575 | 9,216 | ||||||
| 2025-08-14 | 13F | Toronto Dominion Bank | Call | 50,000 | 598 | |||||
| 2025-08-14 | 13F | Militia Capital Partners, LP | 8,000 | 96 | ||||||
| 2025-08-11 | 13F | Independent Advisor Alliance | 14,570 | 174 | ||||||
| 2025-08-13 | 13F | Walleye Capital LLC | Put | 125,200 | 1,497 | |||||
| 2025-08-14 | 13F | SummitTX Capital, L.P. | 19,983 | 239 | ||||||
| 2025-07-30 | 13F | FNY Investment Advisers, LLC | 31,857 | 0 | ||||||
| 2025-08-14 | 13F | Wells Fargo & Company/mn | 100 | 1 | ||||||
| 2025-08-14 | 13F | Coatue Management Llc | 11,448,149 | 136,920 | ||||||
| 2025-08-14 | 13F | Wells Fargo & Company/mn | Call | 30,100 | 360 | |||||
| 2025-08-27 | 13F/A | Squarepoint Ops LLC | 23,046 | 276 | ||||||
| 2025-08-14 | 13F | Toronto Dominion Bank | 1,567 | 19 | ||||||
| 2025-08-14 | 13F | Moore Capital Management, Lp | 60,000 | 718 | ||||||
| 2025-08-08 | 13F | SBI Securities Co., Ltd. | 340 | 4 | ||||||
| 2025-08-12 | 13F | Proequities, Inc. | 0 | 0 | ||||||
| 2025-08-14 | 13F | Shay Capital LLC | 10,000 | 120 | ||||||
| 2025-08-14 | 13F | Hrt Financial Lp | 235,423 | 3 | ||||||
| 2025-08-15 | 13F | Tower Research Capital LLC (TRC) | 5,759 | 69 |
Other Listings
| DE:4HU |