Basic Stats
| Institutional Owners | 212 total, 212 long only, 0 short only, 0 long/short - change of 3.92% MRQ |
| Average Portfolio Allocation | 0.3177 % - change of -1.72% MRQ |
| Institutional Shares (Long) | 7,309,441 (ex 13D/G) - change of 0.74MM shares 11.30% MRQ |
| Institutional Value (Long) | $ 391,963 USD ($1000) |
Institutional Ownership and Shareholders
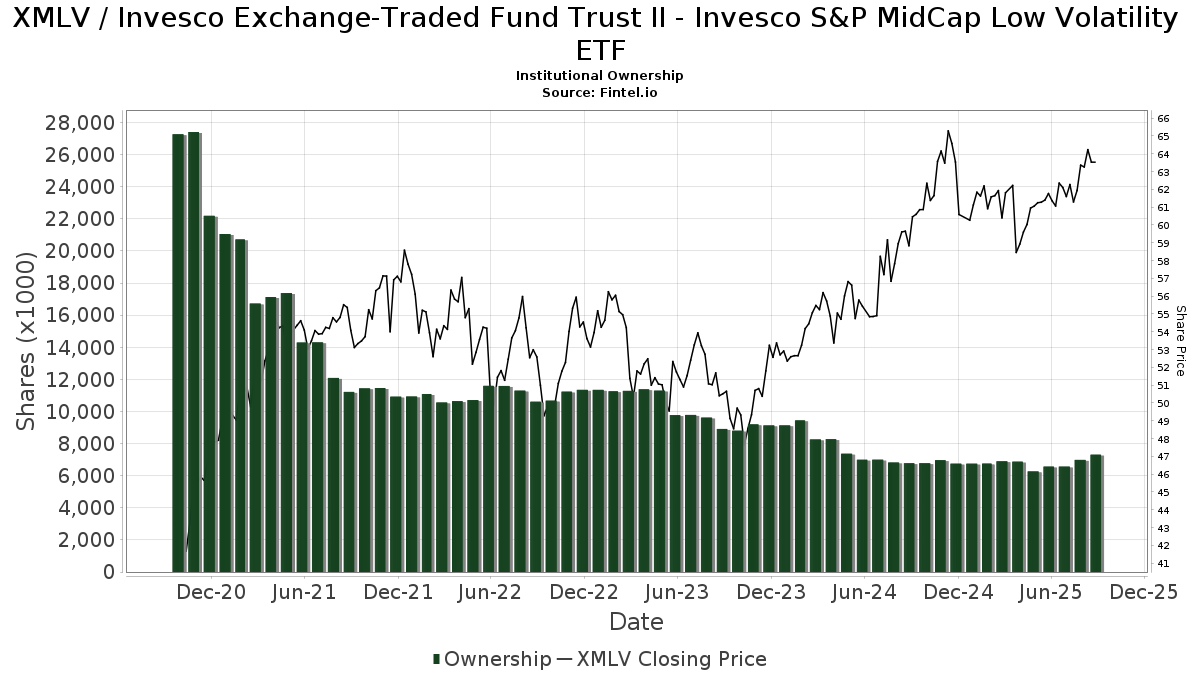
Invesco Exchange-Traded Fund Trust II - Invesco S&P MidCap Low Volatility ETF (US:XMLV) has 212 institutional owners and shareholders that have filed 13D/G or 13F forms with the Securities Exchange Commission (SEC). These institutions hold a total of 7,309,441 shares. Largest shareholders include LPL Financial LLC, Morgan Stanley, Cambridge Investment Research Advisors, Inc., Brookstone Capital Management, UBS Group AG, Envestnet Asset Management Inc, DORVAL Corp, Ameriprise Financial Inc, Commonwealth Equity Services, Llc, and Pnc Financial Services Group, Inc. .
Invesco Exchange-Traded Fund Trust II - Invesco S&P MidCap Low Volatility ETF (ARCA:XMLV) institutional ownership structure shows current positions in the company by institutions and funds, as well as latest changes in position size. Major shareholders can include individual investors, mutual funds, hedge funds, or institutions. The Schedule 13D indicates that the investor holds (or held) more than 5% of the company and intends (or intended) to actively pursue a change in business strategy. Schedule 13G indicates a passive investment of over 5%.
The share price as of September 5, 2025 is 64.10 / share. Previously, on September 9, 2024, the share price was 59.00 / share. This represents an increase of 8.64% over that period.
Fund Sentiment Score
The Fund Sentiment Score (fka Ownership Accumulation Score) finds the stocks that are being most bought by funds. It is the result of a sophisticated, multi-factor quantitative model that identifies companies with the highest levels of institutional accumulation. The scoring model uses a combination of the total increase in disclosed owners, the changes in portfolio allocations in those owners and other metrics. The number ranges from 0 to 100, with higher numbers indicating a higher level of accumulation to its peers, and 50 being the average.
Update Frequency: Daily
See Ownership Explorer, which provides a list of highest-ranking companies.
Institutional Put/Call Ratio
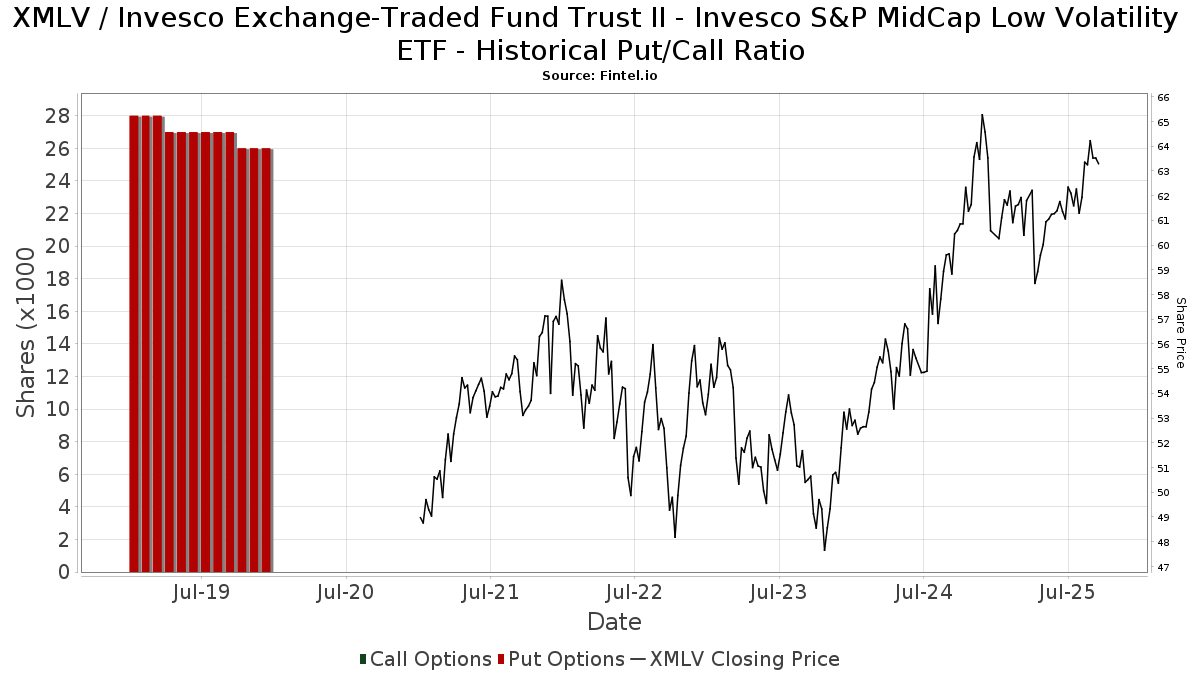
In addition to reporting standard equity and debt issues, institutions with more than 100MM assets under management must also disclose their put and call option holdings. Since put options generally indicate negative sentiment, and call options indicate positive sentiment, we can get a sense of the overall institutional sentiment by plotting the ratio of puts to calls. The chart to the right plots the historical put/call ratio for this instrument.
Using Put/Call Ratio as an indicator of investor sentiment overcomes one of the key deficiencies of using total institutional ownership, which is that a significant amount of assets under management are invested passively to track indices. Passively-managed funds do not typically buy options, so the put/call ratio indicator more closely tracks the sentiment of actively-managed funds.
13F and NPORT Filings
Detail on 13F filings are free. Detail on NP filings require a premium membership. Green rows indicate new positions. Red rows indicate closed positions. Click the link icon to see the full transaction history.
Upgrade
to unlock premium data and export to Excel ![]() .
.
| File Date | Source | Investor | Type | Avg Price (Est) |
Shares | Δ Shares (%) |
Reported Value ($1000) |
Δ Value (%) |
Port Alloc (%) |
|
|---|---|---|---|---|---|---|---|---|---|---|
| 2025-07-23 | 13F | Prime Capital Investment Advisors, LLC | 37,584 | -0.93 | 2,318 | -1.03 | ||||
| 2025-08-14 | 13F | Avid Wealth Partners LLC | 140,478 | 24.77 | 8,663 | 24.68 | ||||
| 2025-08-12 | 13F | Jpmorgan Chase & Co | 140,226 | 25.51 | 8,648 | 25.41 | ||||
| 2025-07-29 | 13F | Portland Financial Advisors Inc | 11,809 | 0.00 | 728 | 0.00 | ||||
| 2025-07-24 | 13F | Blair William & Co/il | 1,395 | -5.74 | 86 | -5.49 | ||||
| 2025-08-14 | 13F | Wiley Bros.-aintree Capital, Llc | 5,553 | 4.22 | 342 | 4.91 | ||||
| 2025-08-14 | 13F | Warren Averett Asset Management, LLC | 11,460 | 707 | ||||||
| 2025-07-22 | 13F | Legacy Trust | 0 | -100.00 | 0 | |||||
| 2025-08-12 | 13F | Change Path, LLC | 16,488 | -0.13 | 1,017 | -0.20 | ||||
| 2025-05-01 | 13F | Quest 10 Wealth Builders, Inc. | 0 | -100.00 | 0 | |||||
| 2025-07-17 | 13F | Janney Montgomery Scott LLC | 14,826 | 5.04 | 1 | |||||
| 2025-07-24 | 13F | Jfs Wealth Advisors, Llc | 21,391 | 2.40 | 1,319 | 2.33 | ||||
| 2025-08-07 | 13F | Runnymede Capital Advisors, Inc. | 0 | -100.00 | 0 | |||||
| 2025-07-22 | 13F | Merit Financial Group, LLC | 3,590 | 0.34 | 221 | 0.45 | ||||
| 2025-08-14 | 13F | EP Wealth Advisors, Inc. | 3,160 | 0.00 | 195 | -0.51 | ||||
| 2025-07-09 | 13F | Dynamic Advisor Solutions LLC | 6,495 | 1.09 | 401 | 1.01 | ||||
| 2025-07-14 | 13F | Ridgewood Investments LLC | 2,925 | 0.00 | 180 | 0.00 | ||||
| 2025-08-14 | 13F | Royal Bank Of Canada | 87,488 | -4.28 | 5,395 | -4.36 | ||||
| 2025-08-19 | 13F | Asset Dedication, LLC | 4,275 | 0.00 | 264 | 0.00 | ||||
| 2025-07-21 | 13F | Ameritas Advisory Services, LLC | 10,110 | -24.34 | 623 | -23.56 | ||||
| 2025-07-22 | 13F | CPR Investments Inc. | 3,420 | 211 | ||||||
| 2025-08-14 | 13F | Ambassador Advisors, LLC | 4,118 | 0.00 | 254 | -0.39 | ||||
| 2025-07-24 | 13F | Lmcg Investments, Llc | 37,591 | 12.97 | 2,318 | 12.91 | ||||
| 2025-08-07 | 13F | Kestra Private Wealth Services, Llc | 4,650 | -7.00 | 287 | -7.14 | ||||
| 2025-08-11 | 13F | Principal Securities, Inc. | 298 | -83.74 | 18 | -83.78 | ||||
| 2025-08-08 | 13F | Thoroughbred Financial Services, Llc | 3,285 | 0.00 | 0 | |||||
| 2025-08-29 | 13F | Total Investment Management Inc | 162 | 10 | ||||||
| 2025-07-10 | 13F | Marshall Financial Group LLC | 3,794 | -13.75 | 236 | -13.28 | ||||
| 2025-05-13 | 13F | Aptus Capital Advisors, LLC | 0 | -100.00 | 0 | |||||
| 2025-08-14 | 13F | Comerica Bank | 1,358 | 0.00 | 84 | 0.00 | ||||
| 2025-08-13 | 13F | Capital Analysts, Inc. | 21,997 | -1.34 | 1 | 0.00 | ||||
| 2025-08-14 | 13F | Money Concepts Capital Corp | 3,843 | 237 | ||||||
| 2025-08-13 | 13F | Congress Wealth Management LLC / DE / | 3,336 | 0.54 | 206 | 0.49 | ||||
| 2025-09-04 | 13F/A | Advisor Group Holdings, Inc. | 76,091 | -14.77 | 4,695 | -14.81 | ||||
| 2025-07-11 | 13F | SILVER OAK SECURITIES, Inc | 27,460 | -5.90 | 1,693 | -5.15 | ||||
| 2025-08-14 | 13F | Gen-Wealth Partners Inc | 1,833 | 0.00 | 113 | 0.00 | ||||
| 2025-06-24 | NP | TNWIX - 1290 Retirement 2050 Fund Class I | 3,374 | 0.00 | 203 | -3.35 | ||||
| 2025-07-25 | 13F | Atria Wealth Solutions, Inc. | 8,879 | 3.05 | 548 | 3.01 | ||||
| 2025-07-11 | 13F | Farther Finance Advisors, LLC | 338 | 9.39 | 21 | 5.26 | ||||
| 2025-04-29 | 13F | Bank of New York Mellon Corp | 0 | -100.00 | 0 | |||||
| 2025-07-10 | 13F | Sovran Advisors, LLC | 4,046 | 251 | ||||||
| 2025-07-15 | 13F | Well Done, LLC | 11,926 | -1.91 | 735 | -0.54 | ||||
| 2025-08-12 | 13F | J.w. Cole Advisors, Inc. | 9,403 | 152.36 | 580 | 152.84 | ||||
| 2025-08-29 | 13F | Evolution Wealth Management Inc. | 940 | 58 | ||||||
| 2025-07-25 | 13F | Commonwealth Financial Services, LLC | 6,525 | -0.91 | 402 | -0.99 | ||||
| 2025-07-24 | 13F | IFP Advisors, Inc | 470 | -11.82 | 29 | -12.50 | ||||
| 2025-08-08 | 13F | Financial Gravity Companies, Inc. | 0 | -100.00 | 0 | |||||
| 2025-08-14 | 13F | Avant Capital LLC | 8,248 | -10.47 | 509 | -10.56 | ||||
| 2025-08-13 | 13F | Jones Financial Companies Lllp | 112,625 | 24.93 | 6,934 | 25.68 | ||||
| 2025-06-24 | NP | TNIIX - 1290 Retirement 2020 Fund Class I | 593 | 0.00 | 36 | -2.78 | ||||
| 2025-07-15 | 13F | ACT Advisors, LLC. | 4,070 | -17.38 | 251 | -17.43 | ||||
| 2025-08-12 | 13F | Proequities, Inc. | 0 | 0 | ||||||
| 2025-07-10 | 13F | High Net Worth Advisory Group LLC | 4,450 | 0.00 | 274 | 0.00 | ||||
| 2025-08-08 | 13F | Avantax Advisory Services, Inc. | 10,902 | 14.84 | 672 | 14.87 | ||||
| 2025-05-15 | 13F | Old Mission Capital Llc | 0 | -100.00 | 0 | |||||
| 2025-08-14 | 13F | Jane Street Group, Llc | 10,835 | 668 | ||||||
| 2025-07-16 | 13F | Brown, Lisle/cummings, Inc. | 2,911 | 0.21 | 180 | 0.00 | ||||
| 2025-08-14 | 13F | Wells Fargo & Company/mn | 114,559 | 9.47 | 7,065 | 9.38 | ||||
| 2025-08-14 | 13F | Harvest Investment Services, LLC | 6,082 | 0.91 | 375 | 1.08 | ||||
| 2025-08-12 | 13F | Insigneo Advisory Services, Llc | 6,412 | 0.64 | 395 | 0.51 | ||||
| 2025-08-06 | 13F | Destiny Capital Corp/CO | 11,433 | -2.77 | 705 | -2.76 | ||||
| 2025-07-22 | 13F | Global Assets Advisory, LLC | 888 | 234 | ||||||
| 2025-06-24 | NP | TNLIX - 1290 Retirement 2035 Fund Class I | 1,286 | -1.53 | 77 | -3.75 | ||||
| 2025-08-08 | 13F | Pnc Financial Services Group, Inc. | 205,206 | -12.27 | 12,655 | -12.34 | ||||
| 2025-08-12 | 13F | Virtu Financial LLC | 8,373 | 1 | ||||||
| 2025-07-17 | 13F | Sound Income Strategies, LLC | 165 | -25.34 | 10 | -23.08 | ||||
| 2025-08-14 | 13F | Win Advisors, Inc | 14,934 | -1.20 | 921 | -1.29 | ||||
| 2025-07-22 | 13F | Rocky Mountain Advisers, Llc | 4,075 | 0.00 | 251 | 0.00 | ||||
| 2025-08-13 | 13F | Dana Investment Advisors, Inc. | 6,107 | 0.00 | 377 | 0.00 | ||||
| 2025-08-14 | 13F | Citadel Advisors Llc | 9,756 | 602 | ||||||
| 2025-08-08 | 13F | Comprehensive Financial Planning, Inc./PA | 460 | 0.88 | 28 | 0.00 | ||||
| 2025-08-05 | 13F | Tsfg, Llc | 150 | 0.00 | 0 | |||||
| 2025-08-12 | 13F | Bravias Capital Group, LLC | 3,318 | 205 | ||||||
| 2025-08-13 | 13F | Milestone Investment Advisors LLC | 318 | 0.00 | 20 | 0.00 | ||||
| 2025-08-12 | 13F | CIBC Private Wealth Group, LLC | 3,590 | 0.00 | 221 | 11.06 | ||||
| 2025-08-14 | 13F | Daiwa Securities Group Inc. | 7,800 | -3.70 | 0 | |||||
| 2025-08-11 | 13F | Citigroup Inc | 11,971 | -33.80 | 738 | -33.87 | ||||
| 2025-08-08 | 13F | Sculati Wealth Management, LLC | 46,068 | -67.64 | 2,841 | -67.66 | ||||
| 2025-08-12 | 13F | Jacobi Capital Management LLC | 6,957 | 0.56 | 429 | 0.70 | ||||
| 2025-07-21 | 13F | Monticello Wealth Management, Llc | 15,551 | -5.34 | 959 | -5.33 | ||||
| 2025-07-15 | 13F | LVZ Advisors, Inc. | 3,421 | 0.00 | 211 | -0.47 | ||||
| 2025-05-12 | 13F | Berger Financial Group, Inc | 0 | -100.00 | 0 | -100.00 | ||||
| 2025-07-18 | 13F | Trilogy Capital Inc. | 3,369 | 0.00 | 208 | 0.00 | ||||
| 2025-08-08 | 13F | Capital Investment Advisory Services, LLC | 316 | 0.00 | 20 | 0.00 | ||||
| 2025-08-27 | 13F/A | Brinker Capital Investments, LLC | 12,442 | -26.52 | 767 | -26.60 | ||||
| 2025-08-13 | 13F | Cerity Partners LLC | 0 | -100.00 | 0 | |||||
| 2025-06-24 | NP | TNJIX - 1290 Retirement 2025 Fund Class I | 75 | -12.79 | 5 | -20.00 | ||||
| 2025-06-24 | NP | TNKIX - 1290 Retirement 2030 Fund Class I | 1,016 | 0.00 | 61 | -3.23 | ||||
| 2025-08-14 | 13F | Visionary Wealth Advisors | 14,271 | -2.23 | 880 | -2.22 | ||||
| 2025-06-24 | NP | TNOIX - 1290 Retirement 2045 Fund Class I | 3,053 | 0.00 | 183 | -3.17 | ||||
| 2025-07-16 | 13F | Meridian Financial, LLC | 4,511 | 0.00 | 278 | 0.00 | ||||
| 2025-08-08 | 13F | Ogorek Anthony Joseph /ny/ /adv | 100 | 0.00 | 0 | |||||
| 2025-07-21 | 13F | DHJJ Financial Advisors, Ltd. | 515 | 32 | ||||||
| 2025-07-21 | 13F | Creative Capital Management Investments LLC | 589 | 0.00 | 36 | 0.00 | ||||
| 2025-08-12 | 13F | Calton & Associates, Inc. | 30,619 | 1,888 | ||||||
| 2025-08-15 | 13F | Equitable Holdings, Inc. | 46,004 | -25.01 | 2,837 | -25.07 | ||||
| 2025-08-11 | 13F | Private Advisor Group, LLC | 14,762 | 34.03 | 910 | 34.02 | ||||
| 2025-08-14 | 13F | UBS Group AG | 315,912 | 5.67 | 19,482 | 5.58 | ||||
| 2025-07-31 | 13F | Briaud Financial Planning, Inc | 23 | 0 | ||||||
| 2025-08-08 | 13F | Petix & Botte Co | 7,726 | 0.00 | 476 | 0.00 | ||||
| 2025-08-13 | 13F | Baird Financial Group, Inc. | 147,427 | 3.21 | 9,092 | 3.12 | ||||
| 2025-07-25 | 13F | Cwm, Llc | 8,417 | 134.26 | 1 | |||||
| 2025-07-29 | 13F | Signature Estate & Investment Advisors Llc | 36,785 | 2,269 | ||||||
| 2025-07-30 | 13F | Syntegra Private Wealth Group, LLC | 8,281 | 0.00 | 511 | -0.20 | ||||
| 2025-07-14 | 13F | IronOak Wealth LLC. | 0 | -100.00 | 0 | |||||
| 2025-05-12 | 13F | Independent Advisor Alliance | 0 | -100.00 | 0 | |||||
| 2025-08-04 | 13F | Arkadios Wealth Advisors | 19,262 | -2.38 | 1,188 | -2.47 | ||||
| 2025-07-07 | 13F | Nova Wealth Management, Inc. | 6,335 | 4,849.22 | 391 | 5,471.43 | ||||
| 2025-07-31 | 13F | City State Bank | 427 | 0.00 | 26 | 0.00 | ||||
| 2025-08-12 | 13F | Laurel Wealth Advisors LLC | 39,346 | 6,067.08 | 1 | -100.00 | ||||
| 2025-07-11 | 13F | Pinnacle Bancorp, Inc. | 4,200 | 0.00 | 259 | 0.00 | ||||
| 2025-08-08 | 13F | Creative Planning | 5,634 | 6.34 | 347 | 6.44 | ||||
| 2025-08-12 | 13F | Financial Advocates Investment Management | 12,978 | -10.61 | 800 | -10.71 | ||||
| 2025-07-16 | 13F | PFS Partners, LLC | 128,846 | 0.28 | 7,946 | 0.19 | ||||
| 2025-07-18 | 13F | Truist Financial Corp | 3,702 | -0.59 | 228 | -0.44 | ||||
| 2025-06-24 | NP | TNNIX - 1290 Retirement 2040 Fund Class I | 2,713 | 0.00 | 163 | -3.57 | ||||
| 2025-04-21 | 13F | PSI Advisors, LLC | 0 | -100.00 | 0 | |||||
| 2025-05-15 | 13F/A | Orion Portfolio Solutions, LLC | 16,932 | 30.34 | 1,045 | 32.28 | ||||
| 2025-08-06 | 13F | AE Wealth Management LLC | 622 | 18.70 | 38 | 18.75 | ||||
| 2025-08-14 | 13F | Harwood Advisory Group, LLC | 51 | -75.24 | 3 | -75.00 | ||||
| 2025-07-23 | 13F | Clear Creek Financial Management, LLC | 16,795 | -19.50 | 1,036 | -19.58 | ||||
| 2025-08-12 | 13F | Steward Partners Investment Advisory, Llc | 3,322 | -2.49 | 205 | -2.86 | ||||
| 2025-08-05 | 13F | EPG Wealth Management LLC | 0 | -100.00 | 0 | |||||
| 2025-08-14 | 13F | Goldman Sachs Group Inc | 9,456 | -67.70 | 583 | -67.74 | ||||
| 2025-05-15 | 13F | Integrated Wealth Concepts LLC | 0 | -100.00 | 0 | |||||
| 2025-08-11 | 13F | Synergy Investment Management, LLC | 0 | -100.00 | 0 | |||||
| 2025-04-15 | 13F | Chris Bulman Inc | 0 | -100.00 | 0 | |||||
| 2025-07-24 | 13F | Ronald Blue Trust, Inc. | 30 | 0.00 | 2 | 0.00 | ||||
| 2025-07-25 | 13F | Alpha Financial Partners, LLC | 0 | -100.00 | 0 | |||||
| 2025-07-25 | 13F | Hazlett, Burt & Watson, Inc. | 1,945 | -34.02 | 0 | |||||
| 2025-08-04 | 13F | Assetmark, Inc | 84 | -98.46 | 5 | -98.51 | ||||
| 2025-08-14 | 13F | Mml Investors Services, Llc | 53,289 | -2.59 | 3 | 0.00 | ||||
| 2025-08-11 | 13F | Rothschild Investment Llc | 2,000 | 0.00 | 123 | 0.00 | ||||
| 2025-08-14 | 13F | Raymond James Financial Inc | 193,541 | 9.94 | 11,936 | 9.85 | ||||
| 2025-07-22 | 13F | Accel Wealth Management | 6,198 | 4.94 | 382 | 4.95 | ||||
| 2025-08-06 | 13F | Commonwealth Equity Services, Llc | 217,510 | -15.55 | 13 | -13.33 | ||||
| 2025-07-10 | 13F | Wealth Enhancement Advisory Services, Llc | 11,712 | -18.18 | 734 | -16.99 | ||||
| 2025-07-30 | 13F | Pacific Sun Financial Corp | 21,200 | -0.38 | 1,307 | -0.46 | ||||
| 2025-08-14 | 13F | Fmr Llc | 7,294 | -9.30 | 450 | -9.48 | ||||
| 2025-08-12 | 13F | Global Retirement Partners, LLC | 864 | 234.88 | 53 | 253.33 | ||||
| 2025-08-14 | 13F | Aqr Capital Management Llc | 8,853 | 0.00 | 546 | -0.18 | ||||
| 2025-08-14 | 13F | Redwood Financial Network Corp | 3,273 | -5.30 | 202 | -5.63 | ||||
| 2025-07-23 | 13F | REAP Financial Group, LLC | 444 | 0.45 | 27 | 0.00 | ||||
| 2025-08-01 | 13F | Gwn Securities Inc. | 0 | -100.00 | 0 | |||||
| 2025-08-07 | 13F | Allworth Financial LP | 4,305 | 1.97 | 266 | 4.74 | ||||
| 2025-08-11 | 13F | CFS Investment Advisory Services, LLC | 4,595 | -2.03 | 0 | |||||
| 2025-08-14 | 13F | GWM Advisors LLC | 96,201 | 35.10 | 5,937 | 58.36 | ||||
| 2025-06-24 | NP | TNQIX - 1290 Retirement 2055 Fund Class I | 3,447 | 0.00 | 207 | -3.29 | ||||
| 2025-08-06 | 13F | Adviser Investments LLC | 0 | -100.00 | 0 | |||||
| 2025-07-18 | 13F | Provident Wealth Management, LLC | 2 | 0.00 | 0 | |||||
| 2025-07-31 | 13F | Cambridge Investment Research Advisors, Inc. | 535,542 | 18.17 | 33 | 22.22 | ||||
| 2025-08-05 | 13F | Sensible Money, LLC | 4,275 | 0.00 | 264 | 0.00 | ||||
| 2025-08-04 | 13F | Creative Financial Designs Inc /adv | 178 | 0.00 | 11 | 0.00 | ||||
| 2025-05-15 | 13F | Two Sigma Securities, Llc | 0 | -100.00 | 0 | |||||
| 2025-08-12 | 13F | Richmond Investment Services, LLC | 6,543 | 56.87 | 404 | 56.81 | ||||
| 2025-08-15 | 13F | Morgan Stanley | 597,901 | 1.36 | 36,873 | 1.27 | ||||
| 2025-07-29 | 13F | International Assets Investment Management, Llc | 4,382 | -6.25 | 270 | -6.25 | ||||
| 2025-07-17 | 13F | ERn Financial, LLC | 8,377 | 0.00 | 517 | -0.19 | ||||
| 2025-08-14 | 13F | Sunbelt Securities, Inc. | 23 | 0.00 | 1 | 0.00 | ||||
| 2025-07-30 | 13F | Liberty One Investment Management, Llc | 40,328 | -2.89 | 2,487 | -2.97 | ||||
| 2025-07-07 | 13F | Roxbury Financial LLC | 303 | 0.33 | 19 | 0.00 | ||||
| 2025-07-16 | 13F | Investment Partners Asset Management, Inc. | 16,553 | 2.76 | 1,021 | 2.62 | ||||
| 2025-08-11 | 13F | Wbi Investments, Inc. | 51,249 | -0.63 | 3,161 | -0.72 | ||||
| 2025-08-07 | 13F | Resources Investment Advisors, LLC. | 10,448 | -2.12 | 644 | -2.13 | ||||
| 2025-07-22 | 13F | Wealthcare Advisory Partners LLC | 8,037 | 64.52 | 496 | 64.45 | ||||
| 2025-08-14 | 13F | CoreCap Advisors, LLC | 76 | 0.00 | 5 | 0.00 | ||||
| 2025-08-14 | 13F | Snowden Capital Advisors LLC | 18,406 | 0.17 | 1,135 | 0.09 | ||||
| 2025-08-13 | 13F | Rsm Us Wealth Management Llc | 9,618 | 0.00 | 593 | 0.00 | ||||
| 2025-08-14 | 13F | Great Valley Advisor Group, Inc. | 6,593 | 0.66 | 407 | 0.74 | ||||
| 2025-08-13 | 13F | Avestar Capital, LLC | 15,176 | 25.48 | 936 | 25.34 | ||||
| 2025-07-17 | 13F | Johnson & White Wealth Management, LLC | 32,992 | 3.04 | 2 | 100.00 | ||||
| 2025-07-17 | 13F | Wagner Wealth Management, Llc | 25 | 4.17 | 2 | 0.00 | ||||
| 2025-08-13 | 13F | EverSource Wealth Advisors, LLC | 860 | 53 | ||||||
| 2025-08-14 | 13F | Qube Research & Technologies Ltd | 102 | 0.00 | 6 | 0.00 | ||||
| 2025-07-30 | 13F | Brookstone Capital Management | 322,262 | -6.19 | 19,874 | -6.26 | ||||
| 2025-07-15 | 13F | Sheets Smith Wealth Management | 12,331 | -7.50 | 760 | -7.54 | ||||
| 2025-08-06 | 13F | Atlas Legacy Advisors, LLC | 5,664 | -1.34 | 349 | -0.29 | ||||
| 2025-08-18 | 13F | Pacific Center for Financial Services | 4,379 | -3.01 | 270 | -2.88 | ||||
| 2025-07-30 | 13F | D.a. Davidson & Co. | 5,033 | -3.90 | 310 | -4.02 | ||||
| 2025-08-05 | 13F | Carolinas Wealth Consulting Llc | 0 | -100.00 | 0 | -100.00 | ||||
| 2025-08-12 | 13F | Marshall & Sterling Wealth Advisors Inc. | 695 | 0.87 | 43 | 0.00 | ||||
| 2025-08-14 | 13F | Hrt Financial Lp | 4,556 | 0 | ||||||
| 2025-08-14 | 13F | Stifel Financial Corp | 180,580 | 397.66 | 11,137 | 397.36 | ||||
| 2025-07-07 | 13F | Whitaker-Myers Wealth Managers, LTD. | 7,775 | 0.80 | 479 | 0.63 | ||||
| 2025-07-24 | 13F | Mainstay Capital Management Llc /adv | 0 | -100.00 | 0 | |||||
| 2025-08-05 | 13F | GPS Wealth Strategies Group, LLC | 393 | -63.61 | 24 | -63.64 | ||||
| 2025-07-16 | 13F | Moneywise, Inc. | 13,599 | -4.39 | 839 | -4.45 | ||||
| 2025-04-30 | 13F | Sofos Investments, Inc. | 0 | -100.00 | 0 | |||||
| 2025-07-16 | 13F/A | CX Institutional | 399 | 0.00 | 0 | |||||
| 2025-08-11 | 13F | FineMark National Bank & Trust | 21,003 | -5.69 | 1,295 | -5.75 | ||||
| 2025-08-13 | 13F | Russell Investments Group, Ltd. | 37 | 0.00 | 2 | 0.00 | ||||
| 2025-08-13 | 13F | Transce3nd, LLC | 1,373 | -4.98 | 85 | -5.62 | ||||
| 2025-08-08 | 13F | Larson Financial Group LLC | 228 | 0.44 | 14 | 7.69 | ||||
| 2025-08-14 | 13F | Mariner, LLC | 34,672 | -6.70 | 2,138 | -6.76 | ||||
| 2025-08-12 | 13F | LPL Financial LLC | 622,659 | 51.96 | 38,399 | 51.84 | ||||
| 2025-07-16 | 13F | Essex Financial Services, Inc. | 10,613 | 0.06 | 655 | 0.00 | ||||
| 2025-07-15 | 13F | Fifth Third Bancorp | 4,492 | 0.00 | 277 | 0.00 | ||||
| 2025-08-13 | 13F | Northwestern Mutual Wealth Management Co | 81,746 | 6.45 | 5,041 | 6.37 | ||||
| 2025-08-14 | 13F | Susquehanna International Group, Llp | 4,417 | -59.42 | 272 | -59.46 | ||||
| 2025-08-14 | 13F | Ameriprise Financial Inc | 225,465 | 1.26 | 13,903 | 1.13 | ||||
| 2025-08-11 | 13F | Inspire Advisors, LLC | 3,942 | 243 | ||||||
| 2025-07-07 | 13F | Thurston, Springer, Miller, Herd & Titak, Inc. | 658 | 0.61 | 41 | 0.00 | ||||
| 2025-08-11 | 13F | United Capital Financial Advisers, Llc | 15,323 | 0.00 | 945 | -0.11 | ||||
| 2025-08-15 | 13F | Kestra Advisory Services, LLC | 11,061 | 22.61 | 682 | 22.66 | ||||
| 2025-08-01 | 13F | Ashton Thomas Private Wealth, LLC | 6,714 | -8.49 | 414 | -8.41 | ||||
| 2025-07-28 | 13F | DORVAL Corp | 234,236 | 14,445 | ||||||
| 2025-04-16 | 13F | Ipswich Investment Management Co., Inc. | 0 | -100.00 | 0 | |||||
| 2025-08-08 | 13F | ProVise Management Group, LLC | 59,435 | -0.71 | 3,665 | -0.79 | ||||
| 2025-08-12 | 13F | Spectrum Wealth Advisory Group, LLC | 8,344 | 0.06 | 515 | 0.00 | ||||
| 2025-08-04 | 13F | Spire Wealth Management | 70 | 0.00 | 4 | 0.00 | ||||
| 2025-08-08 | 13F | Cetera Investment Advisers | 64,683 | 0.90 | 3,989 | 0.83 | ||||
| 2025-08-13 | 13F | Invesco Ltd. | 7,012 | 5.32 | 432 | 5.37 | ||||
| 2025-05-16 | 13F | Laidlaw Wealth Management LLC | 0 | -100.00 | 0 | |||||
| 2025-05-02 | 13F | Transcendent Capital Group LLC | 0 | -100.00 | 0 | |||||
| 2025-08-12 | 13F | SRS Capital Advisors, Inc. | 2,439 | 0.62 | 150 | 0.67 | ||||
| 2025-08-01 | 13F | Biltmore Family Office, LLC | 100 | -50.00 | 6 | -50.00 | ||||
| 2025-08-06 | 13F | Golden State Wealth Management, LLC | 22,078 | 0.35 | 1,362 | 0.29 | ||||
| 2025-08-15 | 13F | Tower Research Capital LLC (TRC) | 1 | 0.00 | 0 | |||||
| 2025-08-06 | 13F | North Capital, Inc. | 100 | 0.00 | 6 | 0.00 | ||||
| 2025-07-24 | 13F | Us Bancorp \de\ | 1,374 | 12.25 | 85 | 12.00 | ||||
| 2025-08-18 | 13F | Front Row Advisors LLC | 935 | 0.00 | 58 | 0.00 | ||||
| 2025-08-11 | 13F | HighTower Advisors, LLC | 43,690 | 5.04 | 2,694 | 4.95 | ||||
| 2025-08-18 | 13F | Geneos Wealth Management Inc. | 531 | -15.45 | 33 | -15.79 | ||||
| 2025-08-14 | 13F | Two Sigma Investments, Lp | 33,000 | -17.09 | 2,035 | -17.14 | ||||
| 2025-08-11 | 13F | Strategic Equity Management | 12,260 | 14.40 | 756 | 14.37 | ||||
| 2025-07-28 | 13F | Harbour Investments, Inc. | 33,061 | 1.12 | 2,039 | 0.99 | ||||
| 2025-08-12 | 13F | O'shaughnessy Asset Management, Llc | 60 | 0.00 | 4 | 0.00 | ||||
| 2025-08-01 | 13F | Envestnet Asset Management Inc | 310,516 | 2.26 | 19,150 | 2.18 | ||||
| 2025-08-14 | 13F | Obsidian Personal Planning Solutions LLC | 124,851 | 2.21 | 7,700 | 5.02 | ||||
| 2025-07-14 | 13F | U.S. Capital Wealth Advisors, LLC | 38,144 | 23.94 | 2,352 | 23.85 | ||||
| 2025-08-01 | 13F | Petra Financial Advisors Inc | 6,192 | 0.21 | 382 | 0.00 | ||||
| 2025-08-14 | 13F | Bank Of America Corp /de/ | 112,925 | 3.10 | 6,964 | 3.02 | ||||
| 2025-07-09 | 13F | Massmutual Trust Co Fsb/adv | 17,385 | 5.40 | 1,072 | 5.30 | ||||
| 2025-08-14 | 13F | Mercer Global Advisors Inc /adv | 128,227 | -3.73 | 7,908 | -3.82 | ||||
| 2025-08-12 | 13F | MAI Capital Management | 4,620 | 0.00 | 285 | -0.35 | ||||
| 2025-08-01 | 13F | MorganRosel Wealth Management, LLC | 97,900 | 655.46 | 6,037 | 655.57 | ||||
| 2025-08-14 | 13F | IHT Wealth Management, LLC | 3,587 | 0.11 | 221 | 0.00 | ||||
| 2025-07-24 | 13F | Capital Advisors, Ltd. LLC | 525 | 0.00 | 0 | |||||
| 2025-08-08 | 13F | Kingsview Wealth Management, LLC | 5,579 | -9.23 | 344 | -9.23 |