Basic Stats
| Institutional Owners | 239 total, 238 long only, 0 short only, 1 long/short - change of 3.91% MRQ |
| Average Portfolio Allocation | 0.0870 % - change of 33.49% MRQ |
| Institutional Shares (Long) | 85,156,549 (ex 13D/G) - change of -18.50MM shares -17.85% MRQ |
| Institutional Value (Long) | $ 897,707 USD ($1000) |
Institutional Ownership and Shareholders
Telefônica Brasil S.A. - Depositary Receipt (Common Stock) (US:VIV) has 239 institutional owners and shareholders that have filed 13D/G or 13F forms with the Securities Exchange Commission (SEC). These institutions hold a total of 85,156,549 shares. Largest shareholders include ARTKX - Artisan International Value Fund Investor Shares, Robeco Institutional Asset Management B.V., Arrowstreet Capital, Limited Partnership, BlackRock, Inc., Brandes Investment Partners, Lp, Macquarie Group Ltd, Standard Life Aberdeen plc, DEMAX - Delaware Emerging Markets Fund Class A, Renaissance Technologies Llc, and ILF - iShares Latin America 40 ETF .
Telefônica Brasil S.A. - Depositary Receipt (Common Stock) (NYSE:VIV) institutional ownership structure shows current positions in the company by institutions and funds, as well as latest changes in position size. Major shareholders can include individual investors, mutual funds, hedge funds, or institutions. The Schedule 13D indicates that the investor holds (or held) more than 5% of the company and intends (or intended) to actively pursue a change in business strategy. Schedule 13G indicates a passive investment of over 5%.
The share price as of September 5, 2025 is 12.47 / share. Previously, on September 6, 2024, the share price was 9.79 / share. This represents an increase of 27.37% over that period.

Fund Sentiment Score
The Fund Sentiment Score (fka Ownership Accumulation Score) finds the stocks that are being most bought by funds. It is the result of a sophisticated, multi-factor quantitative model that identifies companies with the highest levels of institutional accumulation. The scoring model uses a combination of the total increase in disclosed owners, the changes in portfolio allocations in those owners and other metrics. The number ranges from 0 to 100, with higher numbers indicating a higher level of accumulation to its peers, and 50 being the average.
Update Frequency: Daily
See Ownership Explorer, which provides a list of highest-ranking companies.
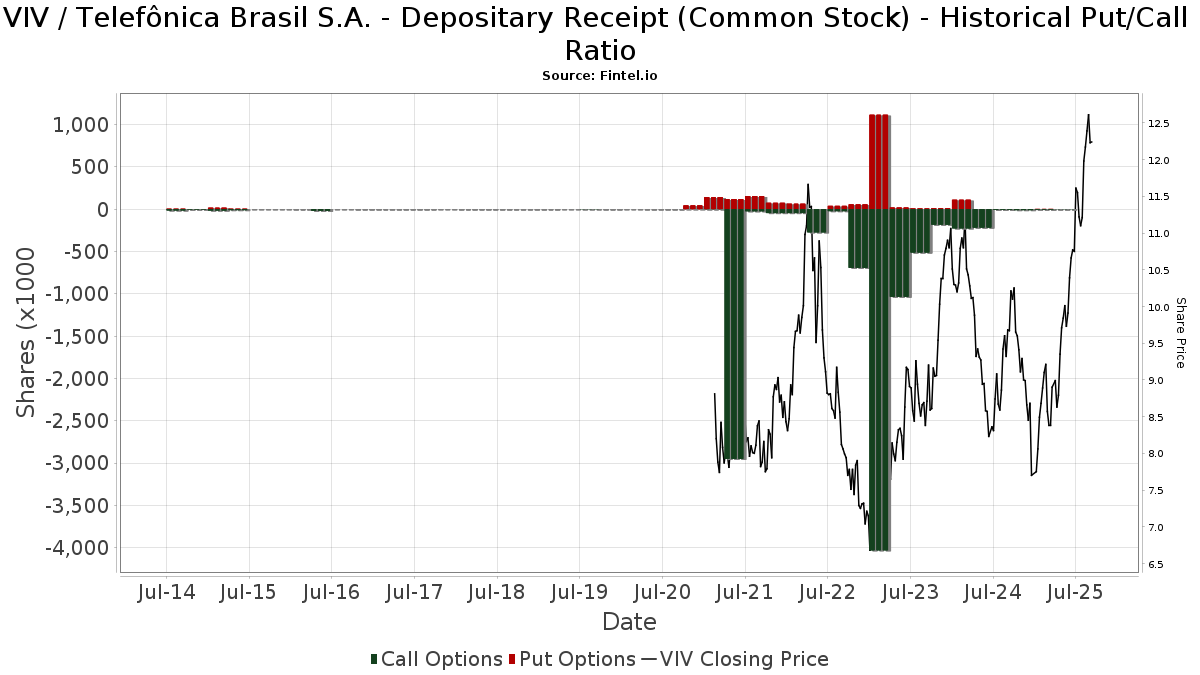
Institutional Put/Call Ratio
In addition to reporting standard equity and debt issues, institutions with more than 100MM assets under management must also disclose their put and call option holdings. Since put options generally indicate negative sentiment, and call options indicate positive sentiment, we can get a sense of the overall institutional sentiment by plotting the ratio of puts to calls. The chart to the right plots the historical put/call ratio for this instrument.
Using Put/Call Ratio as an indicator of investor sentiment overcomes one of the key deficiencies of using total institutional ownership, which is that a significant amount of assets under management are invested passively to track indices. Passively-managed funds do not typically buy options, so the put/call ratio indicator more closely tracks the sentiment of actively-managed funds.
13F and NPORT Filings
Detail on 13F filings are free. Detail on NP filings require a premium membership. Green rows indicate new positions. Red rows indicate closed positions. Click the link icon to see the full transaction history.
Upgrade
to unlock premium data and export to Excel ![]() .
.
| File Date | Source | Investor | Type | Avg Price (Est) |
Shares | Δ Shares (%) |
Reported Value ($1000) |
Δ Value (%) |
Port Alloc (%) |
|
|---|---|---|---|---|---|---|---|---|---|---|
| 2025-05-08 | 13F | Plante Moran Financial Advisors, LLC | 0 | -100.00 | 0 | |||||
| 2025-05-15 | 13F | CAPROCK Group, Inc. | 145,704 | 64.42 | 1,289 | 92.68 | ||||
| 2025-08-14 | 13F | CIBC World Markets Inc. | 204,832 | 0.17 | 2,335 | 30.96 | ||||
| 2025-05-21 | 13F/A | Geneos Wealth Management Inc. | 0 | -100.00 | 0 | |||||
| 2025-08-14 | 13F | Optiver Holding B.V. | 17,765 | 0.00 | 203 | 31.17 | ||||
| 2025-08-14 | 13F | Wetherby Asset Management Inc | 81,497 | -0.68 | 929 | 50.08 | ||||
| 2025-08-26 | NP | ILF - iShares Latin America 40 ETF | 1,377,807 | 10.05 | 15,707 | 43.87 | ||||
| 2025-07-25 | 13F | JustInvest LLC | 54,279 | 10.57 | 619 | 44.39 | ||||
| 2025-08-14 | 13F | State Of Wisconsin Investment Board | 81,791 | 27.78 | 932 | 67.03 | ||||
| 2025-09-04 | 13F/A | Advisor Group Holdings, Inc. | 6,562 | 6.94 | 75 | 39.62 | ||||
| 2025-08-12 | 13F | Legal & General Group Plc | 84,000 | 0.00 | 957 | 30.74 | ||||
| 2025-08-13 | 13F | EverSource Wealth Advisors, LLC | 4,766 | 213.97 | 54 | 315.38 | ||||
| 2025-08-13 | 13F | Federated Hermes, Inc. | 713,677 | 16.44 | 8,136 | 52.23 | ||||
| 2025-08-12 | 13F | BlackRock, Inc. | 5,749,593 | -2.11 | 65,545 | 27.97 | ||||
| 2025-08-14 | 13F | Aquatic Capital Management LLC | 153,486 | 32.28 | 1,750 | 73.00 | ||||
| 2025-07-08 | 13F | Arlington Trust Co LLC | 65 | 1 | ||||||
| 2025-07-30 | 13F | Legacy Wealth Asset Management, LLC | 62,060 | -17.39 | 707 | 7.94 | ||||
| 2025-08-29 | NP | LIVR - Intelligent Livermore ETF | 19,803 | 226 | ||||||
| 2025-08-13 | 13F | Cerity Partners LLC | 106,166 | 2.60 | 1,210 | 34.15 | ||||
| 2025-08-14 | 13F | Vident Advisory, LLC | 46,299 | 36.08 | 528 | 78.04 | ||||
| 2025-08-04 | 13F | Assetmark, Inc | 40 | 0 | ||||||
| 2025-08-11 | 13F | Bell Investment Advisors, Inc | 183 | 200.00 | 2 | |||||
| 2025-08-14 | 13F | Citadel Advisors Llc | Call | 0 | -100.00 | 0 | ||||
| 2025-06-26 | NP | DFA INVESTMENT DIMENSIONS GROUP INC - Emerging Markets Sustainability Core 1 Portfolio Institutional Class This fund is a listed as child fund of Dimensional Fund Advisors Lp and if that institution has disclosed ownership in this security, then these positions will not be double counted when calculating total shares and total value | 18,532 | 0.00 | 180 | 9.82 | ||||
| 2025-07-08 | 13F | Nbc Securities, Inc. | 42,455 | 1.28 | 0 | |||||
| 2025-08-05 | 13F | Bank of New York Mellon Corp | 11,255 | -28.32 | 128 | -5.88 | ||||
| 2025-08-15 | 13F | Tower Research Capital LLC (TRC) | 893 | -86.36 | 10 | -82.46 | ||||
| 2025-07-10 | 13F | Umb Bank N A/mo | 488 | 0.00 | 4 | 0.00 | ||||
| 2025-05-15 | 13F | American Trust Investment Advisors, LLC | 0 | -100.00 | 0 | -100.00 | ||||
| 2025-05-14 | 13F | Itau Unibanco Holding S.A. | 0 | -100.00 | 0 | |||||
| 2025-07-25 | NP | DEMAX - Delaware Emerging Markets Fund Class A | 2,050,000 | 0.00 | 20,356 | 21.54 | ||||
| 2025-08-14 | 13F | Schonfeld Strategic Advisors LLC | 0 | -100.00 | 0 | |||||
| 2025-07-31 | 13F | Oppenheimer Asset Management Inc. | 40,454 | 2.82 | 461 | 34.40 | ||||
| 2025-08-14 | 13F | Toroso Investments, LLC | 54,714 | 624 | ||||||
| 2025-08-14 | 13F | Engineers Gate Manager LP | 65,468 | 63.30 | 746 | 113.75 | ||||
| 2025-08-14 | 13F | Fmr Llc | 6,863 | 6.88 | 78 | 41.82 | ||||
| 2025-08-14 | 13F | Aprio Wealth Management, LLC | 38,549 | 43.66 | 439 | 88.41 | ||||
| 2025-07-29 | 13F | Lesa Sroufe & Co | 225,286 | 4.85 | 3 | 100.00 | ||||
| 2025-08-14 | 13F | Lazard Asset Management Llc | 27,383 | 0.00 | 0 | |||||
| 2025-08-12 | 13F | Handelsbanken Fonder AB | 91,125 | 0.00 | 1 | |||||
| 2025-05-06 | 13F | Venturi Wealth Management, LLC | 0 | -100.00 | 0 | |||||
| 2025-08-14 | 13F | Boston Private Wealth Llc | 0 | -100.00 | 0 | |||||
| 2025-08-13 | 13F | Northwestern Mutual Wealth Management Co | 5,198 | 1.52 | 59 | 34.09 | ||||
| 2025-07-29 | 13F | Beverly Hills Private Wealth, LLC | 21,543 | 3.19 | 246 | 34.62 | ||||
| 2025-08-15 | 13F | Great West Life Assurance Co /can/ | 179,297 | -8.50 | 2 | 100.00 | ||||
| 2025-08-14 | 13F | Bnp Paribas Arbitrage, Sa | 109,571 | 22.26 | 1,249 | 59.92 | ||||
| 2025-08-12 | 13F | Coldstream Capital Management Inc | 0 | -100.00 | 0 | |||||
| 2025-08-13 | 13F | OMERS ADMINISTRATION Corp | 417,400 | 0.00 | 4,758 | 30.75 | ||||
| 2025-07-28 | NP | AVEM - Avantis Emerging Markets Equity ETF This fund is a listed as child fund of American Century Companies Inc and if that institution has disclosed ownership in this security, then these positions will not be double counted when calculating total shares and total value | 113,701 | 8.85 | 1,129 | 32.36 | ||||
| 2025-08-13 | 13F | Grantham, Mayo, Van Otterloo & Co. LLC | 0 | -100.00 | 0 | |||||
| 2025-07-07 | 13F | Investors Research Corp | 4,412 | -94.43 | 50 | -92.75 | ||||
| 2025-07-28 | NP | AVSE - Avantis Responsible Emerging Markets Equity ETF | 8,971 | 45.66 | 89 | 78.00 | ||||
| 2025-05-27 | NP | RMEAX - Aspiriant Risk-Managed Equity Allocation Fund Advisor Shares | 4,831 | 0.00 | 42 | 16.67 | ||||
| 2025-08-07 | 13F | Campbell & CO Investment Adviser LLC | 111,919 | 111.23 | 1,276 | 175.97 | ||||
| 2025-08-14 | 13F | Royal Bank Of Canada | 466,226 | 8.16 | 5,314 | 41.41 | ||||
| 2025-08-05 | 13F | NewSquare Capital LLC | 67 | 0.00 | 1 | |||||
| 2025-08-07 | 13F | Vise Technologies, Inc. | 10,017 | 114 | ||||||
| 2025-08-08 | 13F | Larson Financial Group LLC | 87 | 1 | ||||||
| 2025-08-14 | 13F | Ameriprise Financial Inc | 96,843 | 309.73 | 1,105 | 416.36 | ||||
| 2025-08-12 | 13F | SRS Capital Advisors, Inc. | 3,296 | 363.57 | 38 | 516.67 | ||||
| 2025-08-14 | 13F | Banque Transatlantique SA | 0 | -100.00 | 0 | |||||
| 2025-08-28 | NP | QEMM - SPDR MSCI Emerging Markets StrategicFactors ETF | 601 | -3.99 | 7 | 20.00 | ||||
| 2025-08-08 | 13F | Cetera Investment Advisers | 48,646 | 13.81 | 555 | 48.92 | ||||
| 2025-08-06 | 13F | First Horizon Advisors, Inc. | 1,014 | 79.15 | 12 | 175.00 | ||||
| 2025-07-11 | 13F | Pinnacle Bancorp, Inc. | 756 | 0.00 | 9 | 33.33 | ||||
| 2025-03-28 | NP | GERIX - Goldman Sachs Emerging Markets Equity Insights Fund Institutional | 74,600 | 0.00 | 659 | -3.09 | ||||
| 2025-08-14 | 13F | Quantinno Capital Management LP | 123,756 | 35.19 | 1,411 | 76.69 | ||||
| 2025-07-25 | 13F | Sequoia Financial Advisors, LLC | 37,156 | 424 | ||||||
| 2025-08-04 | 13F | Waterfront Wealth Inc. | 131,475 | -26.78 | 1,499 | -4.28 | ||||
| 2025-08-13 | 13F | Quadrant Capital Group Llc | 13,123 | -37.38 | 150 | -18.13 | ||||
| 2025-08-12 | 13F | MAI Capital Management | 1,269 | 14 | ||||||
| 2025-07-18 | 13F | Robeco Institutional Asset Management B.V. | 15,264,157 | -2.24 | 174,011 | 27.81 | ||||
| 2025-05-14 | 13F | Walleye Capital LLC | 0 | -100.00 | 0 | |||||
| 2025-06-30 | NP | VEU - Vanguard FTSE All-World ex-US Index Fund ETF Shares | 160,185 | -11.04 | 1,555 | -2.14 | ||||
| 2025-07-24 | 13F | Us Bancorp \de\ | 46,265 | 2.70 | 527 | 34.44 | ||||
| 2025-07-28 | 13F | BRYN MAWR TRUST Co | 0 | -100.00 | 0 | |||||
| 2025-08-14 | 13F | Macquarie Group Ltd | 2,895,585 | -0.44 | 33,010 | 30.16 | ||||
| 2025-05-13 | 13F | Daiwa Securities Group Inc. | 0 | -100.00 | 0 | |||||
| 2025-06-26 | NP | DFAE - Dimensional Emerging Core Equity Market ETF | 130,675 | 11.86 | 1,269 | 22.99 | ||||
| 2025-08-14 | 13F | Two Sigma Securities, Llc | 58,326 | 665 | ||||||
| 2025-08-12 | 13F | Advisors Asset Management, Inc. | 7,620 | 28.74 | 87 | 68.63 | ||||
| 2025-05-09 | 13F | GeoWealth Management, LLC | 0 | -100.00 | 0 | |||||
| 2025-08-11 | 13F | Principal Securities, Inc. | 140 | 8.53 | 2 | |||||
| 2025-08-13 | 13F | Groupama Asset Managment | 0 | -100.00 | 0 | |||||
| 2025-08-29 | NP | JVANX - International Equity Index Trust NAV | 6,017 | 0.00 | 69 | 30.77 | ||||
| 2025-08-04 | 13F | Spire Wealth Management | 777 | -14.62 | 9 | 14.29 | ||||
| 2025-08-12 | 13F | Proequities, Inc. | Put | 0 | 0 | |||||
| 2025-08-14 | 13F | Modern Wealth Management, LLC | 33,673 | -30.61 | 384 | -9.46 | ||||
| 2025-08-12 | 13F | Proequities, Inc. | Call | 0 | 0 | |||||
| 2025-08-12 | 13F | Proequities, Inc. | 0 | 0 | ||||||
| 2025-08-01 | 13F | Bessemer Group Inc | 34,176 | 19.72 | 0 | |||||
| 2025-08-14 | 13F | Driehaus Capital Management Llc | 173,081 | 0.00 | 1,973 | 30.75 | ||||
| 2025-07-29 | 13F | Private Trust Co Na | 1,071 | 0.00 | 12 | 33.33 | ||||
| 2025-08-14 | 13F | Qube Research & Technologies Ltd | 321,153 | -39.79 | 3,661 | -21.27 | ||||
| 2025-05-14 | 13F | SPX Equities Gestao de Recursos Ltda | 0 | -100.00 | 0 | |||||
| 2025-08-25 | NP | NXTG - First Trust Indxx NextG ETF This fund is a listed as child fund of First Trust Advisors Lp and if that institution has disclosed ownership in this security, then these positions will not be double counted when calculating total shares and total value | 193,265 | -15.24 | 2,203 | 10.81 | ||||
| 2025-08-13 | 13F | First Trust Advisors Lp | 582,690 | -11.47 | 6,643 | 15.73 | ||||
| 2025-07-18 | 13F | BSW Wealth Partners | 24,332 | -0.88 | 277 | 29.44 | ||||
| 2025-07-21 | 13F | Ameritas Advisory Services, LLC | 1,171 | 13 | ||||||
| 2025-07-24 | 13F | Standard Life Aberdeen plc | 2,847,740 | 0.10 | 32,464 | 30.87 | ||||
| 2025-07-31 | 13F | Carrera Capital Advisors | 13,650 | 156 | ||||||
| 2025-08-12 | 13F | LPL Financial LLC | 231,552 | 148.83 | 2,640 | 225.40 | ||||
| 2025-04-22 | NP | APIE - ActivePassive International Equity ETF | 0 | -100.00 | 0 | -100.00 | ||||
| 2025-08-05 | 13F | Simplex Trading, Llc | Put | 500 | 0.00 | 0 | ||||
| 2025-05-23 | NP | ARTKX - Artisan International Value Fund Investor Shares | 16,476,483 | 0.00 | 143,675 | 15.50 | ||||
| 2025-08-05 | 13F | Simplex Trading, Llc | 3,142 | 0 | ||||||
| 2025-08-06 | 13F | Moors & Cabot, Inc. | 0 | -100.00 | 0 | |||||
| 2025-08-05 | 13F | Simplex Trading, Llc | Call | 1,200 | -29.41 | 0 | ||||
| 2025-06-26 | NP | DFA INVESTMENT DIMENSIONS GROUP INC - World ex U.S. Core Equity Portfolio Institutional Class Shares | 1,013 | 0.00 | 10 | 12.50 | ||||
| 2025-07-08 | 13F | Parallel Advisors, LLC | 21,088 | 41.85 | 240 | 86.05 | ||||
| 2025-08-14 | 13F | Headlands Technologies LLC | 350 | 4 | ||||||
| 2025-08-05 | 13F | Huntington National Bank | 1 | 0.00 | 0 | |||||
| 2025-08-14 | 13F | Wells Fargo & Company/mn | 692,961 | 5.10 | 7,900 | 37.40 | ||||
| 2025-08-08 | 13F | SBI Securities Co., Ltd. | 3,440 | -9.07 | 39 | 21.88 | ||||
| 2025-07-21 | 13F | Mirae Asset Global Investments Co., Ltd. | 21,383 | 8.21 | 244 | 40.46 | ||||
| 2025-07-31 | 13F | AlTi Global, Inc. | 10,283 | 0.00 | 118 | 29.67 | ||||
| 2025-08-14 | 13F | Axa S.a. | 55,465 | 0.00 | 632 | 30.85 | ||||
| 2025-08-26 | NP | BINV - Brandes International ETF | 305,999 | 21.93 | 3,488 | 59.41 | ||||
| 2025-07-28 | NP | AVXC - Avantis Emerging Markets ex-China Equity ETF | 8,468 | 37.38 | 84 | 68.00 | ||||
| 2025-07-11 | 13F | Caldwell Securities, Inc | 202 | 0.00 | 2 | 100.00 | ||||
| 2025-08-14 | 13F | Raymond James Financial Inc | 86,030 | 9.52 | 981 | 43.27 | ||||
| 2025-07-16 | 13F | Signaturefd, Llc | 24,005 | 13.64 | 274 | 48.37 | ||||
| 2025-08-13 | 13F | Arrowstreet Capital, Limited Partnership | 5,754,523 | 54.77 | 65,602 | 102.33 | ||||
| 2025-07-17 | 13F | V-Square Quantitative Management LLC | 69,423 | 0.00 | 791 | 30.74 | ||||
| 2025-08-07 | 13F | Connor, Clark & Lunn Investment Management Ltd. | 226,538 | -41.73 | 2,583 | -23.83 | ||||
| 2025-03-27 | NP | BLACKROCK FUNDS - BlackRock Defensive Advantage Emerging Markets Fund Institutional This fund is a listed as child fund of BlackRock, Inc. and if that institution has disclosed ownership in this security, then these positions will not be double counted when calculating total shares and total value | 8,164 | 0.00 | 72 | -2.70 | ||||
| 2025-08-14 | 13F | State Street Corp | 210,225 | -35.35 | 2,472 | -17.11 | ||||
| 2025-05-01 | 13F | Bleakley Financial Group, LLC | 0 | -100.00 | 0 | -100.00 | ||||
| 2025-08-14 | 13F | Cubist Systematic Strategies, LLC | 8,071 | -89.61 | 92 | -86.41 | ||||
| 2025-05-15 | 13F | Jain Global LLC | 0 | -100.00 | 0 | |||||
| 2025-08-07 | 13F | Parkside Financial Bank & Trust | 0 | -100.00 | 0 | |||||
| 2025-08-14 | 13F | UBS Group AG | 365,552 | -40.73 | 4,167 | -22.52 | ||||
| 2025-07-29 | 13F | Commons Capital, Llc | 0 | -100.00 | 0 | |||||
| 2025-07-25 | 13F | Cwm, Llc | 148 | 0.00 | 0 | |||||
| 2025-08-15 | 13F | CI Private Wealth, LLC | 42,984 | 100.86 | 490 | 163.44 | ||||
| 2025-08-08 | 13F | Creative Planning | 45,545 | -31.53 | 519 | -10.52 | ||||
| 2025-08-14 | 13F | Bank Of America Corp /de/ | 1,035,304 | -36.42 | 11,802 | -16.88 | ||||
| 2025-08-08 | 13F | Crossmark Global Holdings, Inc. | 33,942 | 0.33 | 387 | 30.85 | ||||
| 2025-07-30 | 13F | Eqis Capital Management, Inc. | 51,906 | 592 | ||||||
| 2025-05-14 | 13F | Banco BTG Pactual S.A. | 0 | -100.00 | 0 | |||||
| 2025-08-12 | 13F | Summit Global Investments | 0 | -100.00 | 0 | |||||
| 2025-06-26 | NP | DAADX - Emerging Markets ex China Core Equity Portfolio Institutional Class | 13,442 | 0.00 | 131 | 10.17 | ||||
| 2025-08-11 | 13F | Citigroup Inc | 252 | -99.42 | 3 | -99.48 | ||||
| 2025-07-24 | 13F | Ramirez Asset Management, Inc. | 426,868 | 4,866 | ||||||
| 2025-08-14 | 13F | Mariner, LLC | 51,022 | 48.21 | 582 | 93.67 | ||||
| 2025-07-24 | 13F | Ronald Blue Trust, Inc. | 1,167 | -17.82 | 13 | 8.33 | ||||
| 2025-08-12 | 13F | Country Trust Bank | 251 | 3 | ||||||
| 2025-08-07 | 13F | Kestra Private Wealth Services, Llc | 26,855 | 306 | ||||||
| 2025-08-27 | 13F/A | Squarepoint Ops LLC | 33,058 | 23.25 | 377 | 61.37 | ||||
| 2025-08-07 | 13F | Allworth Financial LP | 4,452 | 0.00 | 51 | 19.05 | ||||
| 2025-08-11 | 13F | B. Metzler seel. Sohn & Co. AG | 19,293 | 0.00 | 220 | 30.36 | ||||
| 2025-07-18 | 13F | Truist Financial Corp | 59,465 | 41.63 | 678 | 84.97 | ||||
| 2025-08-08 | 13F | D'Orazio & Associates, Inc. | 22,131 | 80.66 | 252 | 137.74 | ||||
| 2025-07-31 | 13F | MQS Management LLC | 0 | -100.00 | 0 | |||||
| 2025-08-12 | 13F | Rhumbline Advisers | 6,611 | 56.18 | 75 | 108.33 | ||||
| 2025-08-14 | 13F | Millennium Management Llc | 67,913 | -48.35 | 774 | -32.46 | ||||
| 2025-08-11 | 13F | Empowered Funds, LLC | 19,803 | 226 | ||||||
| 2025-08-14 | 13F | Susquehanna International Group, Llp | 27,260 | 311 | ||||||
| 2025-08-08 | 13F | Pnc Financial Services Group, Inc. | 5,163 | 45.68 | 59 | 93.33 | ||||
| 2025-08-26 | NP | IXP - iShares Global Comm Services ETF | 43,638 | 35.15 | 497 | 76.87 | ||||
| 2025-07-21 | 13F | Ascent Group, LLC | 22,701 | 25.15 | 259 | 63.29 | ||||
| 2025-08-12 | 13F | Dimensional Fund Advisors Lp | 518,970 | 14.66 | 5,902 | 49.43 | ||||
| 2025-07-25 | 13F | CBOE Vest Financial, LLC | 11,798 | 7.49 | 134 | 41.05 | ||||
| 2025-08-07 | 13F | Montag A & Associates Inc | 868 | 0.00 | 10 | 28.57 | ||||
| 2025-07-30 | 13F | FNY Investment Advisers, LLC | 20,000 | 0 | ||||||
| 2025-05-05 | 13F | Lindbrook Capital, Llc | 4,920 | 74.59 | 43 | 100.00 | ||||
| 2025-07-30 | 13F | DekaBank Deutsche Girozentrale | 19,293 | 0.00 | 0 | |||||
| 2025-08-14 | 13F | Two Sigma Advisers, Lp | 364,300 | 38.46 | 4,153 | 81.04 | ||||
| 2025-07-15 | 13F | Ballentine Partners, LLC | 54,898 | 10.67 | 626 | 44.68 | ||||
| 2025-08-12 | 13F | Franklin Resources Inc | 63,176 | 10.07 | 720 | 44.00 | ||||
| 2025-08-14 | 13F | GWM Advisors LLC | 72 | 0.00 | 1 | |||||
| 2025-07-31 | 13F | R Squared Ltd | 0 | -100.00 | 0 | |||||
| 2025-07-14 | 13F | GAMMA Investing LLC | 10,034 | 7.03 | 114 | 40.74 | ||||
| 2025-06-30 | NP | VGTSX - Vanguard Total International Stock Index Fund Investor Shares | 898,342 | 0.00 | 8,723 | 9.96 | ||||
| 2025-07-29 | NP | SGLIX - SGI Global Equity Fund Class I Shares | 123,858 | -6.91 | 1,230 | 13.06 | ||||
| 2025-08-13 | 13F | Brandes Investment Partners, Lp | 3,480,597 | 3.54 | 39,679 | 35.36 | ||||
| 2025-06-26 | NP | DFEM - Dimensional Emerging Markets Core Equity 2 ETF | 88,514 | 36.15 | 859 | 49.65 | ||||
| 2025-08-14 | 13F | Graham Capital Management, L.P. | 0 | -100.00 | 0 | |||||
| 2025-07-28 | NP | NSI - National Security Emerging Markets Index ETF | 1,414 | 38.09 | 14 | 75.00 | ||||
| 2025-08-05 | 13F | Bank Of Montreal /can/ | 54,966 | 5.35 | 627 | 37.89 | ||||
| 2025-08-06 | 13F | True Wealth Design, LLC | 4 | 0.00 | 0 | |||||
| 2025-08-14 | 13F | Goldman Sachs Group Inc | 826,507 | 22.37 | 9,422 | 59.99 | ||||
| 2025-08-06 | 13F | Fox Run Management, L.l.c. | 19,098 | -69.80 | 218 | -60.62 | ||||
| 2025-08-14 | 13F | Point72 Asset Management, L.P. | 131,800 | 53.26 | 1,503 | 100.53 | ||||
| 2025-07-24 | 13F | Jfs Wealth Advisors, Llc | 91 | 0.00 | 1 | |||||
| 2025-08-14 | 13F | Group One Trading, L.p. | 0 | -100.00 | 0 | |||||
| 2025-07-25 | 13F | Hemington Wealth Management | 711 | 0.00 | 0 | |||||
| 2025-08-04 | 13F | Strs Ohio | 840,000 | 2.49 | 9,576 | 34.01 | ||||
| 2025-08-12 | 13F | Steward Partners Investment Advisory, Llc | 393 | 0.00 | 4 | 33.33 | ||||
| 2025-08-14 | 13F | Two Sigma Investments, Lp | 1,365,446 | 120.59 | 15,566 | 188.42 | ||||
| 2025-08-13 | 13F | PineBridge Investments, L.P. | 0 | -100.00 | 0 | |||||
| 2025-08-14 | 13F | Smartleaf Asset Management LLC | 18 | 0.00 | 0 | |||||
| 2025-08-14 | 13F | Stifel Financial Corp | 296,907 | 1.62 | 3,385 | 32.86 | ||||
| 2025-08-13 | 13F | Hudson Portfolio Management LLC | 16,084 | -1.96 | 84 | 10.53 | ||||
| 2025-08-13 | 13F | Amundi | 1,257,476 | 22.38 | 14,599 | 52.79 | ||||
| 2025-05-12 | 13F | Virtu Financial LLC | 0 | -100.00 | 0 | |||||
| 2025-07-11 | 13F | Farther Finance Advisors, LLC | 4,918 | 543.72 | 56 | 833.33 | ||||
| 2025-08-14 | 13F | Gould Capital, LLC | 150 | 0.00 | 2 | 0.00 | ||||
| 2025-08-21 | NP | MEMSX - Mercer Emerging Markets Equity Fund Class I | 124,215 | -11.36 | 1,416 | 15.97 | ||||
| 2025-07-15 | 13F | Public Employees Retirement System Of Ohio | 47,432 | -35.96 | 541 | -16.28 | ||||
| 2025-08-13 | 13F | Northern Trust Corp | 320,308 | 33.84 | 3,652 | 75.02 | ||||
| 2025-08-12 | 13F | XTX Topco Ltd | 0 | -100.00 | 0 | |||||
| 2025-08-29 | NP | Gabelli Global Utility & Income Trust | 17,000 | 0.00 | 194 | 30.41 | ||||
| 2025-08-29 | NP | GATAX - The Gabelli Asset Fund Class A | 36,000 | 0.00 | 410 | 30.99 | ||||
| 2025-06-26 | NP | DFCEX - Emerging Markets Core Equity Portfolio - Institutional Class This fund is a listed as child fund of Dimensional Fund Advisors Lp and if that institution has disclosed ownership in this security, then these positions will not be double counted when calculating total shares and total value | 78,886 | 0.00 | 766 | 9.91 | ||||
| 2025-08-13 | 13F | M&t Bank Corp | 38,982 | 20.67 | 444 | 58.01 | ||||
| 2025-07-31 | 13F | Sumitomo Mitsui Trust Holdings, Inc. | 144,687 | 1,649 | ||||||
| 2025-07-14 | 13F | UMA Financial Services, Inc. | 236 | 0.00 | 3 | 0.00 | ||||
| 2025-08-14 | 13F | Federation des caisses Desjardins du Quebec | 2,000 | 82.98 | 23 | 144.44 | ||||
| 2025-07-15 | 13F | Alhambra Investment Partners LLC | 11,437 | 130 | ||||||
| 2025-05-28 | NP | QCVAX - Clearwater International Fund | 148,021 | 0.00 | 1,291 | 15.49 | ||||
| 2025-08-14 | 13F | VPR Management LLC | 72,375 | 0.00 | 825 | 30.74 | ||||
| 2025-06-26 | NP | DFA INVESTMENT DIMENSIONS GROUP INC - Emerging Markets Social Core Equity Portfolio Shares | 10,963 | 0.00 | 106 | 10.42 | ||||
| 2025-06-26 | NP | DFSE - Dimensional Emerging Markets Sustainability Core 1 ETF | 13,200 | 4.76 | 128 | 15.32 | ||||
| 2025-08-01 | 13F | Envestnet Asset Management Inc | 729,193 | 62.33 | 8,313 | 112.20 | ||||
| 2025-07-07 | 13F | Northwest & Ethical Investments L.P. | 0 | -100.00 | 0 | -100.00 | ||||
| 2025-08-14 | 13F | Barometer Capital Management Inc. | 32,200 | 366 | ||||||
| 2025-07-30 | 13F | Cullen/frost Bankers, Inc. | 0 | -100.00 | 0 | |||||
| 2025-04-28 | 13F | DAVENPORT & Co LLC | 0 | -100.00 | 0 | |||||
| 2025-08-13 | 13F | Twin Peaks Wealth Advisors, LLC | 8 | 0 | ||||||
| 2025-08-14 | 13F/A | Barclays Plc | 1,290,641 | -2.46 | 15 | 27.27 | ||||
| 2025-07-14 | 13F | Kapitalo Investimentos Ltda | 209,476 | 2,388 | ||||||
| 2025-05-16 | 13F/A | Kestra Investment Management, LLC | 0 | -100.00 | 0 | |||||
| 2025-05-13 | 13F | Quadrature Capital Ltd | 0 | -100.00 | 0 | |||||
| 2025-08-14 | 13F | Atomi Financial Group, Inc. | 13,173 | 0.64 | 150 | 31.58 | ||||
| 2025-08-14 | 13F | Verition Fund Management LLC | 65,056 | 2.46 | 742 | 34.00 | ||||
| 2025-06-23 | NP | UBPIX - Ultralatin America Profund Investor Class | 7,768 | -7.44 | 75 | 1.35 | ||||
| 2025-08-12 | 13F | Jpmorgan Chase & Co | 79,937 | 31.13 | 911 | 71.56 | ||||
| 2025-08-12 | 13F | ABN AMRO Bank N.V. | 122,444 | 15.76 | 1,402 | 52.12 | ||||
| 2025-08-14 | 13F/A | Skopos Labs, Inc. | 11,447 | 44.10 | 130 | 88.41 | ||||
| 2025-07-16 | 13F | Kathmere Capital Management, LLC | 64,377 | 79.56 | 734 | 134.94 | ||||
| 2025-03-31 | NP | VIHAX - Vanguard International High Dividend Yield Index Fund Admiral Shares | 75,372 | 0.00 | 666 | -3.06 | ||||
| 2025-07-21 | 13F | Quent Capital, LLC | 0 | -100.00 | 0 | |||||
| 2025-08-14 | 13F | Parvin Asset Management, LLC | 6,775 | 0.00 | 77 | 30.51 | ||||
| 2025-06-13 | NP | abrdn Funds - abrdn Emerging Markets Dividend Active ETF | 115,657 | 1,123 | ||||||
| 2025-06-26 | NP | DEXC - Dimensional Emerging Markets ex China Core Equity ETF | 5,000 | 13.64 | 49 | 26.32 | ||||
| 2025-08-13 | 13F | Natixis Advisors, L.p. | 158,223 | 8.11 | 2 | 0.00 | ||||
| 2025-08-29 | NP | GAUAX - The Gabelli Utilities Fund Class A | 125,000 | 0.00 | 1,425 | 30.73 | ||||
| 2025-06-26 | NP | DFAX - Dimensional World ex U.S. Core Equity 2 ETF | 43,649 | 207.52 | 424 | 238.40 | ||||
| 2025-08-12 | 13F | Wayfinding Financial, LLC | 0 | -100.00 | 0 | |||||
| 2025-08-14 | 13F | Wellington Management Group Llp | 390,702 | -0.94 | 4,454 | 29.51 | ||||
| 2025-07-28 | NP | AVEEX - Avantis Emerging Markets Equity Fund Institutional Class This fund is a listed as child fund of American Century Companies Inc and if that institution has disclosed ownership in this security, then these positions will not be double counted when calculating total shares and total value | 23,694 | 0.00 | 235 | 21.76 | ||||
| 2025-08-12 | 13F | American Century Companies Inc | 164,985 | 9.90 | 1,881 | 43.62 | ||||
| 2025-06-26 | 13F/A | Deutsche Bank Ag\ | 0 | -100.00 | 0 | |||||
| 2025-04-23 | 13F | Wealthquest Corp | 17,883 | 2,088 | ||||||
| 2025-08-06 | 13F | Savant Capital, LLC | 17,045 | 194 | ||||||
| 2025-06-25 | NP | IEMGX - Voya Multi-Manager Emerging Markets Equity Fund Class I | 37,141 | -47.67 | 361 | -42.49 | ||||
| 2025-08-04 | 13F | Hantz Financial Services, Inc. | 146,177 | 10.94 | 2 | 0.00 | ||||
| 2025-08-13 | 13F | Renaissance Technologies Llc | 1,935,600 | -8.66 | 22,066 | 19.41 | ||||
| 2025-08-13 | 13F | Invesco Ltd. | 1,196,143 | -17.25 | 13,636 | 8.19 | ||||
| 2025-08-12 | 13F | O'shaughnessy Asset Management, Llc | 974,798 | 36.71 | 11,113 | 78.74 | ||||
| 2025-08-14 | 13F | Voloridge Investment Management, Llc | 270,170 | -3.41 | 3,080 | 26.24 | ||||
| 2025-08-14 | 13F | Wiley Bros.-aintree Capital, Llc | 12,108 | 138 | ||||||
| 2025-08-15 | 13F | WealthCollab, LLC | 994 | 0.00 | 11 | 37.50 | ||||
| 2025-07-24 | 13F | IFP Advisors, Inc | 2,976 | 0.00 | 34 | 32.00 | ||||
| 2025-08-14 | 13F | Ieq Capital, Llc | 10,219 | 116 | ||||||
| 2025-04-11 | 13F | First Affirmative Financial Network | 28,784 | 26.61 | 251 | 46.78 | ||||
| 2025-08-11 | 13F | Vanguard Group Inc | 976,903 | -18.58 | 11,137 | 6.43 | ||||
| 2025-07-22 | 13F | JGP Global Gestao de Recursos Ltda. | 100,000 | 1,140 | ||||||
| 2025-08-13 | 13F | Gabelli Funds Llc | 268,000 | 0.00 | 3,055 | 30.78 | ||||
| 2025-08-26 | NP | Delaware Vip Trust - Delaware Vip Emerging Markets Series Standard Class | 259,915 | 0.00 | 2,963 | 30.76 | ||||
| 2025-05-20 | 13F/A | Colony Group, LLC | 0 | -100.00 | 0 | |||||
| 2025-08-25 | NP | TDIV - First Trust NASDAQ Technology Dividend Index Fund This fund is a listed as child fund of First Trust Advisors Lp and if that institution has disclosed ownership in this security, then these positions will not be double counted when calculating total shares and total value | 383,409 | -9.23 | 4,371 | 18.65 | ||||
| 2025-07-29 | NP | RBB FUND, INC. - Aquarius International Fund | 13,700 | 0.00 | 136 | 22.52 | ||||
| 2025-08-14 | 13F | Sei Investments Co | 16,475 | -98.18 | 188 | -97.63 | ||||
| 2025-06-25 | NP | TDVI - FT Vest Technology Dividend Target Income ETF | 12,170 | 16.82 | 118 | 29.67 | ||||
| 2025-07-28 | 13F | Ritholtz Wealth Management | 151,259 | 80.36 | 1,724 | 135.84 | ||||
| 2025-07-31 | 13F | Stegent Equity Advisors, Inc. | 35,778 | 408 | ||||||
| 2025-08-11 | 13F | Brown Brothers Harriman & Co | 108 | 1 | ||||||
| 2025-06-25 | NP | VVIFX - Voya VACS Series EME Fund | 48,372 | -30.88 | 470 | -23.99 | ||||
| 2025-08-14 | 13F | Citadel Advisors Llc | Put | 0 | -100.00 | 0 | ||||
| 2025-08-12 | 13F | Longfellow Investment Management Co Llc | 260,062 | -4.95 | 2,965 | 24.28 | ||||
| 2025-08-14 | 13F | Mercer Global Advisors Inc /adv | 31,752 | 5.32 | 362 | 37.79 | ||||
| 2025-08-15 | 13F | Morgan Stanley | 563,373 | 3.16 | 6,422 | 34.86 | ||||
| 2025-07-31 | 13F | Caitong International Asset Management Co., Ltd | 51 | 1 | ||||||
| 2025-08-14 | 13F | Jane Street Group, Llc | 367,686 | 4,192 | ||||||
| 2025-08-14 | 13F | Aqr Capital Management Llc | 34,231 | -9.72 | 390 | 18.18 | ||||
| 2025-05-01 | 13F | Schechter Investment Advisors, LLC | 74,812 | 64.41 | 652 | 90.09 | ||||
| 2025-05-13 | 13F | Quantbot Technologies LP | 0 | -100.00 | 0 | -100.00 | ||||
| 2025-08-29 | NP | Gabelli Multimedia Trust Inc. | 20,000 | 0.00 | 228 | 31.03 | ||||
| 2025-08-11 | 13F | Covestor Ltd | 1,966 | 736.60 | 0 | |||||
| 2025-05-15 | 13F | D. E. Shaw & Co., Inc. | 0 | -100.00 | 0 | |||||
| 2025-08-12 | 13F | Artisan Partners Limited Partnership | 0 | -100.00 | 0 | |||||
| 2025-08-14 | 13F | Citadel Advisors Llc | 162,176 | -15.78 | 1,849 | 10.07 | ||||
| 2025-08-12 | 13F | Global Retirement Partners, LLC | 271 | 204.49 | 3 | |||||
| 2025-08-29 | NP | Gabelli Equity Trust Inc | 70,000 | 0.00 | 798 | 30.82 | ||||
| 2025-04-14 | 13F | Yousif Capital Management, Llc | 0 | -100.00 | 0 | |||||
| 2025-08-13 | 13F | Hsbc Holdings Plc | 188,198 | 19.84 | 2,147 | 58.73 | ||||
| 2025-07-30 | 13F | Ethic Inc. | 140,576 | 11.79 | 1,562 | 35.98 | ||||
| 2025-08-13 | 13F | Jones Financial Companies Lllp | 4,354 | 69.28 | 48 | 118.18 |