Basic Stats
| Institutional Owners | 223 total, 223 long only, 0 short only, 0 long/short - change of 7.69% MRQ |
| Average Portfolio Allocation | 0.1353 % - change of 0.06% MRQ |
| Institutional Shares (Long) | 12,836,415 (ex 13D/G) - change of 1.42MM shares 12.46% MRQ |
| Institutional Value (Long) | $ 426,409 USD ($1000) |
Institutional Ownership and Shareholders
Reaves Utility Income Fund (US:UTG) has 223 institutional owners and shareholders that have filed 13D/G or 13F forms with the Securities Exchange Commission (SEC). These institutions hold a total of 12,836,415 shares. Largest shareholders include Bank Of America Corp /de/, Morgan Stanley, Cornerstone Advisors, LLC, Wells Fargo & Company/mn, LPL Financial LLC, Commonwealth Equity Services, Llc, Royal Bank Of Canada, Cornerstone Strategic Value Fund Inc, Ameriprise Financial Inc, and J.w. Cole Advisors, Inc. .
Reaves Utility Income Fund (NYSEAM:UTG) institutional ownership structure shows current positions in the company by institutions and funds, as well as latest changes in position size. Major shareholders can include individual investors, mutual funds, hedge funds, or institutions. The Schedule 13D indicates that the investor holds (or held) more than 5% of the company and intends (or intended) to actively pursue a change in business strategy. Schedule 13G indicates a passive investment of over 5%.
The share price as of September 8, 2025 is 36.90 / share. Previously, on September 9, 2024, the share price was 30.48 / share. This represents an increase of 21.06% over that period.

Fund Sentiment Score
The Fund Sentiment Score (fka Ownership Accumulation Score) finds the stocks that are being most bought by funds. It is the result of a sophisticated, multi-factor quantitative model that identifies companies with the highest levels of institutional accumulation. The scoring model uses a combination of the total increase in disclosed owners, the changes in portfolio allocations in those owners and other metrics. The number ranges from 0 to 100, with higher numbers indicating a higher level of accumulation to its peers, and 50 being the average.
Update Frequency: Daily
See Ownership Explorer, which provides a list of highest-ranking companies.
Institutional Put/Call Ratio
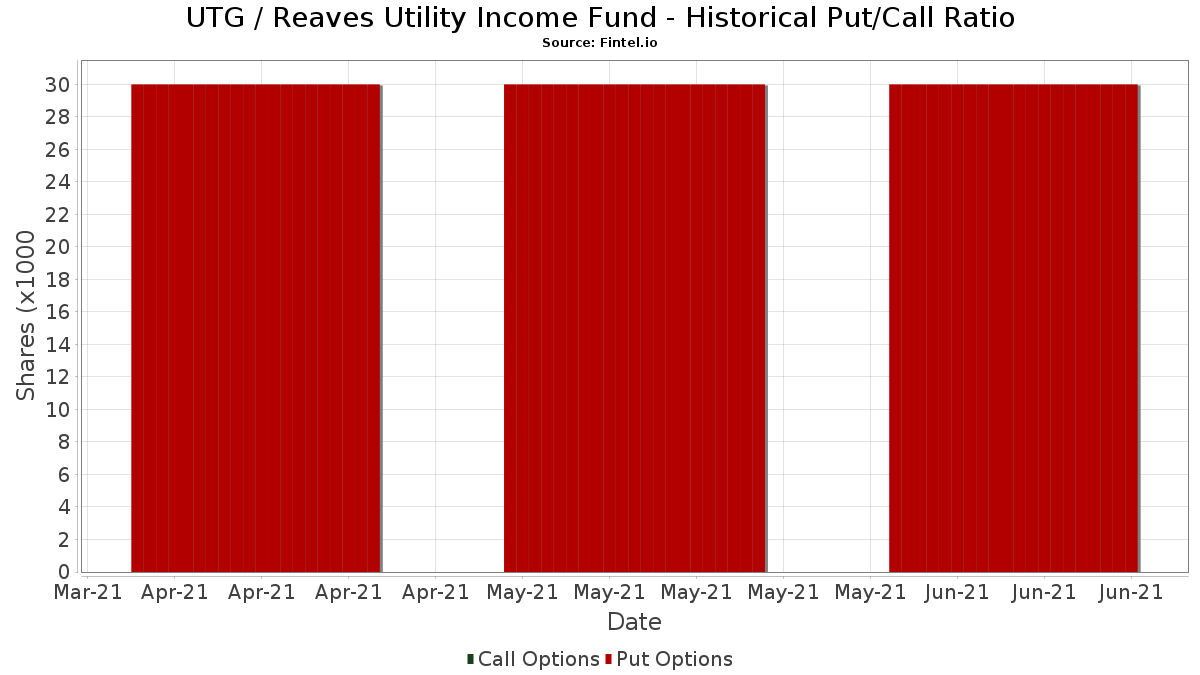
In addition to reporting standard equity and debt issues, institutions with more than 100MM assets under management must also disclose their put and call option holdings. Since put options generally indicate negative sentiment, and call options indicate positive sentiment, we can get a sense of the overall institutional sentiment by plotting the ratio of puts to calls. The chart to the right plots the historical put/call ratio for this instrument.
Using Put/Call Ratio as an indicator of investor sentiment overcomes one of the key deficiencies of using total institutional ownership, which is that a significant amount of assets under management are invested passively to track indices. Passively-managed funds do not typically buy options, so the put/call ratio indicator more closely tracks the sentiment of actively-managed funds.
13F and NPORT Filings
Detail on 13F filings are free. Detail on NP filings require a premium membership. Green rows indicate new positions. Red rows indicate closed positions. Click the link icon to see the full transaction history.
Upgrade
to unlock premium data and export to Excel ![]() .
.
| File Date | Source | Investor | Type | Avg Price (Est) |
Shares | Δ Shares (%) |
Reported Value ($1000) |
Δ Value (%) |
Port Alloc (%) |
|
|---|---|---|---|---|---|---|---|---|---|---|
| 2025-08-12 | 13F | J.w. Cole Advisors, Inc. | 362,956 | 366.21 | 13,132 | 418.40 | ||||
| 2025-08-12 | 13F | LPL Financial LLC | 616,607 | 2.90 | 22,309 | 14.41 | ||||
| 2025-08-12 | 13F | CIBC Private Wealth Group, LLC | 300 | -0.33 | 11 | 25.00 | ||||
| 2025-08-11 | 13F | Elequin Capital Lp | 0 | -100.00 | 0 | |||||
| 2025-07-24 | 13F | Edge Financial Advisors LLC | 8,215 | 298 | ||||||
| 2025-07-29 | 13F | Stephens Inc /ar/ | 26,913 | 5.38 | 974 | 17.09 | ||||
| 2025-04-24 | 13F | Wingate Wealth Advisors, Inc. | 0 | -100.00 | 0 | |||||
| 2025-05-06 | 13F | Proficio Capital Partners LLC | 0 | -100.00 | 0 | -100.00 | ||||
| 2025-08-13 | 13F | Northwestern Mutual Wealth Management Co | 58,209 | 7.56 | 2,106 | 19.53 | ||||
| 2025-05-06 | 13F | Kovack Advisors, Inc. | 0 | -100.00 | 0 | |||||
| 2025-08-14 | 13F | Ameriprise Financial Inc | 382,317 | -22.02 | 13,827 | -12.98 | ||||
| 2025-08-14 | 13F | CoreCap Advisors, LLC | 5,604 | -8.19 | 203 | 2.02 | ||||
| 2025-07-17 | 13F | Sterling Investment Advisors, Ltd. | 192,359 | 3.88 | 6,960 | 15.50 | ||||
| 2025-07-25 | 13F | Atria Wealth Solutions, Inc. | 50,949 | -19.13 | 1,843 | -10.10 | ||||
| 2025-08-13 | 13F | Continuum Advisory, LLC | 0 | -100.00 | 0 | |||||
| 2025-08-06 | 13F | Wedbush Securities Inc | 36,009 | 8.18 | 1 | 0.00 | ||||
| 2025-07-22 | 13F | Belpointe Asset Management LLC | 14,011 | -7.00 | 507 | 3.27 | ||||
| 2025-08-11 | 13F | Western Wealth Management, LLC | 7,095 | 257 | ||||||
| 2025-08-14 | 13F | Federation des caisses Desjardins du Quebec | 358 | 0.00 | 13 | 9.09 | ||||
| 2025-08-14 | 13F | Beaird Harris Wealth Management, LLC | 175 | 0.00 | 6 | 20.00 | ||||
| 2025-08-06 | 13F | Commonwealth Equity Services, Llc | 509,049 | 3.98 | 18 | 20.00 | ||||
| 2025-08-11 | 13F | Private Advisor Group, LLC | 140,633 | 6.95 | 5,088 | 18.93 | ||||
| 2025-07-15 | 13F | Wealth Effects Llc | 69,699 | 0.14 | 2,522 | 11.35 | ||||
| 2025-07-10 | 13F | Oliver Lagore Vanvalin Investment Group | 3,795 | 0.00 | 123 | 2.50 | ||||
| 2025-07-18 | 13F | Consolidated Portfolio Review Corp | 132,011 | -13.26 | 4,776 | -3.55 | ||||
| 2025-08-04 | 13F | Pensionmark Financial Group, Llc | 40,221 | -31.59 | 1,455 | -23.94 | ||||
| 2025-07-11 | 13F/A | Umb Bank N A/mo | 574 | 0.00 | 21 | 11.11 | ||||
| 2025-07-24 | 13F | Costello Asset Management, INC | 10,700 | -1.42 | 387 | 9.63 | ||||
| 2025-08-01 | 13F | Gwn Securities Inc. | 8,638 | 313 | ||||||
| 2025-08-13 | 13F | Allie Family Office LLC | 6,490 | 0.00 | 235 | 10.90 | ||||
| 2025-08-19 | 13F | Advisory Services Network, LLC | 19,185 | 0.15 | 734 | 17.82 | ||||
| 2025-07-11 | 13F | Seacrest Wealth Management, Llc | 7,195 | 10.78 | 260 | 23.22 | ||||
| 2025-08-14 | 13F | Mercer Global Advisors Inc /adv | 14,849 | 26.29 | 537 | 40.58 | ||||
| 2025-07-17 | 13F | Oak Family Advisors, Llc | 249,394 | -6.90 | 9,023 | 3.51 | ||||
| 2025-08-11 | 13F | Semus Wealth Partners LLC | 12,809 | -6.45 | 463 | 4.04 | ||||
| 2025-08-12 | 13F | MAI Capital Management | 5,232 | 0.69 | 189 | 11.83 | ||||
| 2025-07-21 | 13F | Hilltop National Bank | 590 | 0.00 | 21 | 16.67 | ||||
| 2025-08-07 | 13F | McClarren Financial Advisors, Inc. | 0 | -100.00 | 0 | |||||
| 2025-07-24 | 13F | Financial Security Advisor, Inc. | 10,000 | 0.00 | 362 | 11.08 | ||||
| 2025-08-01 | 13F | Centerpoint Advisors, LLC | 1,700 | 0.00 | 0 | |||||
| 2025-08-12 | 13F | Tradition Wealth Management, LLC | 98,261 | 1.40 | 3,555 | 12.75 | ||||
| 2025-07-15 | 13F | Fifth Third Bancorp | 950 | 0.00 | 34 | 13.33 | ||||
| 2025-07-22 | 13F | Kercheville Advisors, LLC | 34,770 | -2.16 | 1,258 | 8.74 | ||||
| 2025-08-13 | 13F | StoneX Group Inc. | 12,464 | -8.39 | 451 | 1.81 | ||||
| 2025-08-11 | 13F | HighTower Advisors, LLC | 17,207 | -5.04 | 623 | 5.60 | ||||
| 2025-08-12 | 13F | Jpmorgan Chase & Co | 228 | -70.47 | 8 | -68.00 | ||||
| 2025-05-19 | 13F | Smith Asset Management Co., LLC | 80,660 | -0.28 | 2,625 | 2.38 | ||||
| 2025-07-07 | 13F | Versant Capital Management, Inc | 234 | 0.00 | 8 | 14.29 | ||||
| 2025-08-14 | 13F | UBS Group AG | 188,829 | 7.57 | 6,832 | 19.59 | ||||
| 2025-08-14 | 13F | Integrated Wealth Concepts LLC | 12,104 | 438 | ||||||
| 2025-08-12 | 13F | Jefferies Financial Group Inc. | 9,014 | 326 | ||||||
| 2025-05-02 | 13F | Cullen/frost Bankers, Inc. | 0 | -100.00 | 0 | |||||
| 2025-06-27 | NP | Calamos ETF Trust - Calamos CEF Income & Arbitrage ETF | 9,808 | -11.53 | 322 | -12.05 | ||||
| 2025-07-24 | 13F | Morton Brown Family Wealth, LLC | 153 | 6 | ||||||
| 2025-07-21 | 13F | Future Financial Wealth Managment LLC | 26,170 | 1.83 | 947 | 13.16 | ||||
| 2025-08-14 | 13F | Stifel Financial Corp | 255,169 | 14.06 | 9,232 | 26.82 | ||||
| 2025-08-04 | 13F | Roble, Belko & Company, Inc | 72 | 1.41 | 0 | |||||
| 2025-08-28 | NP | Cohen & Steers Closed-end Opportunity Fund, Inc. | 20,000 | 30.85 | 724 | 73.80 | ||||
| 2025-07-24 | 13F | Us Bancorp \de\ | 13,284 | -9.90 | 481 | 0.21 | ||||
| 2025-07-30 | 13F | Brookstone Capital Management | 22,606 | 7.27 | 818 | 19.27 | ||||
| 2025-08-04 | 13F | Creative Financial Designs Inc /adv | 5,677 | 3.77 | 205 | 15.17 | ||||
| 2025-08-12 | 13F | AlphaCore Capital LLC | 30,825 | 9.25 | 1,115 | 21.46 | ||||
| 2025-08-15 | 13F | Equitable Holdings, Inc. | 11,711 | 7.18 | 424 | 19.15 | ||||
| 2025-05-12 | 13F | Wolverine Asset Management Llc | 0 | -100.00 | 0 | |||||
| 2025-08-11 | 13F | Brown Brothers Harriman & Co | 4,225 | 0.00 | 153 | 10.95 | ||||
| 2025-07-28 | 13F/A | Penbrook Management LLC | 6,075 | -37.53 | 220 | -30.70 | ||||
| 2025-07-10 | 13F | Focus Financial Network, Inc. | 10,882 | 6.01 | 394 | 17.66 | ||||
| 2025-08-22 | NP | Cornerstone Strategic Value Fund Inc | 482,478 | 74.39 | 17,456 | 93.91 | ||||
| 2025-07-14 | 13F | Armstrong Advisory Group, Inc | 254 | 9 | ||||||
| 2025-08-13 | 13F | Keystone Financial Group | 5,640 | 204 | ||||||
| 2025-08-12 | 13F | Walled Lake Planning & Wealth Management, Llc | 14,045 | 29.21 | 508 | 43.91 | ||||
| 2025-08-14 | 13F | Mml Investors Services, Llc | 17,658 | -16.50 | 1 | |||||
| 2025-07-31 | 13F/A | Avion Wealth | 0 | 0 | ||||||
| 2025-08-13 | 13F | Baird Financial Group, Inc. | 7,586 | 7.91 | 274 | 20.18 | ||||
| 2025-08-13 | 13F | Lido Advisors, LLC | 150,194 | 0.55 | 5,434 | 11.81 | ||||
| 2025-08-08 | 13F | Cetera Investment Advisers | 150,407 | 0.73 | 5,442 | 12.00 | ||||
| 2025-08-14 | 13F | Royal Bank Of Canada | 493,887 | -1.45 | 17,868 | 9.57 | ||||
| 2025-08-07 | 13F | Samalin Investment Counsel, LLC | 19,814 | 1.30 | 717 | 12.58 | ||||
| 2025-08-08 | 13F | Good Life Advisors, LLC | 67,552 | 1.45 | 2,444 | 12.83 | ||||
| 2025-07-25 | 13F | Commonwealth Financial Services, LLC | 5,819 | 211 | ||||||
| 2025-08-07 | 13F | Kestra Private Wealth Services, Llc | 0 | -100.00 | 0 | |||||
| 2025-05-15 | 13F | Family Office Research LLC | 0 | -100.00 | 0 | |||||
| 2025-07-25 | NP | FCEF - First Trust CEF Income Opportunity ETF This fund is a listed as child fund of First Trust Advisors Lp and if that institution has disclosed ownership in this security, then these positions will not be double counted when calculating total shares and total value | 24,510 | 7.99 | 848 | 13.83 | ||||
| 2025-07-16 | 13F | ORG Partners LLC | 7,564 | 5.22 | 275 | 16.10 | ||||
| 2025-07-09 | 13F | Triumph Capital Management | 7,982 | -7.85 | 289 | 2.49 | ||||
| 2025-08-04 | 13F | Assetmark, Inc | 645 | 23 | ||||||
| 2025-08-15 | 13F | Kestra Advisory Services, LLC | 36,177 | 2.84 | 1,309 | 14.34 | ||||
| 2025-08-08 | 13F | Cornerstone Advisors, LLC | 732,485 | 80.17 | 26,501 | 100.33 | ||||
| 2025-08-06 | 13F | Moors & Cabot, Inc. | 0 | -100.00 | 0 | |||||
| 2025-08-15 | 13F | Captrust Financial Advisors | 359,116 | -2.20 | 12,993 | 8.74 | ||||
| 2025-08-07 | 13F | Parkside Financial Bank & Trust | 485 | 0.00 | 18 | 13.33 | ||||
| 2025-04-21 | 13F | Beacon Capital Management, LLC | 0 | -100.00 | 0 | |||||
| 2025-07-25 | 13F | Welch Group, LLC | 22,500 | 18.32 | 814 | 31.93 | ||||
| 2025-08-08 | 13F | IMA Wealth, Inc. | 0 | -100.00 | 0 | |||||
| 2025-08-14 | 13F | Certified Advisory Corp | 15,246 | -11.98 | 552 | -2.13 | ||||
| 2025-09-04 | 13F/A | Advisor Group Holdings, Inc. | 237,084 | 1.35 | 8,579 | 12.71 | ||||
| 2025-08-11 | 13F | Principal Securities, Inc. | 6,751 | 1.86 | 244 | 16.19 | ||||
| 2025-08-15 | 13F | Morgan Stanley | 975,172 | 1.53 | 35,282 | 12.89 | ||||
| 2025-08-05 | 13F | Sigma Planning Corp | 28,890 | 0.71 | 1,045 | 12.00 | ||||
| 2025-05-06 | 13F | Readystate Asset Management Lp | 0 | -100.00 | 0 | -100.00 | ||||
| 2025-08-06 | 13F | AE Wealth Management LLC | 16,802 | -2.26 | 608 | 8.59 | ||||
| 2025-08-08 | 13F | Westbourne Investment Advisors, Inc. | 22,900 | 829 | ||||||
| 2025-08-13 | 13F | Custom Index Systems, Llc | 6,679 | 2.39 | 242 | 13.68 | ||||
| 2025-07-08 | 13F | Ballew Advisors, Inc | 5,664 | 204 | ||||||
| 2025-08-12 | 13F | Landscape Capital Management, L.l.c. | 0 | -100.00 | 0 | |||||
| 2025-07-16 | 13F | Maridea Wealth Management LLC | 15,310 | 1.88 | 554 | 13.09 | ||||
| 2025-08-14 | 13F | Jane Street Group, Llc | 14,039 | 508 | ||||||
| 2025-08-13 | 13F | Alerus Financial Na | 267 | 10 | ||||||
| 2025-08-06 | 13F | Atlantic Union Bankshares Corp | 201 | 7 | ||||||
| 2025-08-12 | 13F | Armor Investment Advisors, LLC | 21,050 | 4.54 | 762 | 16.18 | ||||
| 2025-08-07 | 13F | Allworth Financial LP | 4,289 | 38.89 | 155 | 58.16 | ||||
| 2025-08-13 | 13F | Per Stirling Capital Management, LLC. | 13,254 | 8.37 | 480 | 20.65 | ||||
| 2025-08-13 | 13F | Walleye Capital LLC | 20,496 | 742 | ||||||
| 2025-07-31 | 13F | Leavell Investment Management, Inc. | 0 | -100.00 | 0 | |||||
| 2025-08-13 | 13F | Guggenheim Capital Llc | 178,906 | -18.82 | 6,473 | -9.74 | ||||
| 2025-07-28 | 13F | Mission Hills Financial Advisory, LLC | 12,374 | 448 | ||||||
| 2025-08-05 | 13F | Huntington National Bank | 0 | -100.00 | ||||||
| 2025-08-14 | 13F | Wiley Bros.-aintree Capital, Llc | 11,241 | 407 | ||||||
| 2025-08-11 | 13F | Novak & Powell Financial Services, Inc. | 7,941 | 1.33 | 287 | 12.55 | ||||
| 2025-08-12 | 13F | Proequities, Inc. | 0 | 0 | ||||||
| 2025-07-02 | 13F | HBW Advisory Services LLC | 32,143 | 1.05 | 1,163 | 12.27 | ||||
| 2025-07-14 | 13F | AdvisorNet Financial, Inc | 1,461 | 73.93 | 53 | 92.59 | ||||
| 2025-08-14 | 13F | Colony Group, LLC | 8,335 | -5.01 | 302 | 5.61 | ||||
| 2025-07-25 | 13F | We Are One Seven, LLC | 13,726 | 4.21 | 497 | 15.89 | ||||
| 2025-05-05 | 13F | Transce3nd, LLC | 0 | -100.00 | 0 | |||||
| 2025-08-06 | 13F | Carnegie Lake Advisors LLC | 28,609 | -7.59 | 1 | 0.00 | ||||
| 2025-07-29 | 13F | Tradewinds Capital Management, LLC | 320 | 0.00 | 12 | 10.00 | ||||
| 2025-07-16 | 13F | West Branch Capital LLC | 830 | 1.22 | 30 | 15.38 | ||||
| 2025-08-04 | 13F | ELCO Management Co., LLC | 7,550 | -0.66 | 273 | 10.53 | ||||
| 2025-08-11 | 13F | Hexagon Capital Partners LLC | 0 | -100.00 | 0 | |||||
| 2025-07-14 | 13F | Sowell Financial Services LLC | 57,609 | -0.59 | 2,084 | 10.56 | ||||
| 2025-07-25 | 13F | Cwm, Llc | 22,769 | 2.36 | 1 | |||||
| 2025-08-13 | 13F | Cary Street Partners Financial Llc | 5,808 | 210 | ||||||
| 2025-07-08 | 13F | Nbc Securities, Inc. | 51,173 | -7.98 | 2 | 0.00 | ||||
| 2025-08-12 | 13F | Retirement Planning Co of New England, Inc. | 0 | -100.00 | 0 | -100.00 | ||||
| 2025-08-18 | 13F | Hollencrest Capital Management | 395 | 0.00 | 14 | 16.67 | ||||
| 2025-08-13 | 13F | Summit Financial, LLC | 7,744 | 13.67 | 280 | 26.70 | ||||
| 2025-07-07 | 13F | Investors Research Corp | 7,077 | 0.00 | 256 | 11.30 | ||||
| 2025-07-08 | 13F | Webster Bank, N. A. | 995 | 0.00 | 36 | 9.38 | ||||
| 2025-08-13 | 13F | Leslie Global Wealth, LLC | 9,667 | 0.00 | 350 | 11.15 | ||||
| 2025-08-15 | 13F | Tower Research Capital LLC (TRC) | 0 | -100.00 | 0 | |||||
| 2025-08-12 | 13F | XTX Topco Ltd | 14,844 | 537 | ||||||
| 2025-08-14 | 13F | Vivaldi Capital Management, LLC | 24,350 | 0.00 | 881 | 11.11 | ||||
| 2025-07-02 | 13F | Neville Rodie & Shaw Inc | 12,701 | 0.00 | 0 | |||||
| 2025-08-07 | 13F | Nwam Llc | 7,480 | 20.45 | 285 | 41.09 | ||||
| 2025-07-17 | 13F | Janney Montgomery Scott LLC | 93,563 | 36.82 | 3 | 50.00 | ||||
| 2025-08-08 | 13F | Pnc Financial Services Group, Inc. | 34,599 | 86.71 | 1,252 | 107.81 | ||||
| 2025-08-11 | 13F/A | Purus Wealth Management, LLC | 6,406 | 232 | ||||||
| 2025-08-14 | 13F | Cohen & Steers, Inc. | 20,000 | 1 | ||||||
| 2025-05-12 | 13F | Fmr Llc | 0 | -100.00 | 0 | |||||
| 2025-08-14 | 13F | Wells Fargo & Company/mn | 632,944 | 1.33 | 22,900 | 12.66 | ||||
| 2025-07-22 | 13F | Wealthcare Advisory Partners LLC | 8,694 | 6.00 | 315 | 18.05 | ||||
| 2025-07-29 | 13F | Balboa Wealth Partners | 8,761 | -9.74 | 317 | 0.32 | ||||
| 2025-04-25 | 13F | Albion Financial Group /ut | 0 | -100.00 | 0 | |||||
| 2025-08-14 | 13F | Bank Of America Corp /de/ | 1,043,401 | 11.74 | 37,750 | 24.24 | ||||
| 2025-07-22 | 13F | DAVENPORT & Co LLC | 17,087 | 30.03 | 618 | 44.73 | ||||
| 2025-07-15 | 13F | North Star Investment Management Corp. | 1,450 | 0.00 | 52 | 10.64 | ||||
| 2025-05-15 | 13F | Parvin Asset Management, LLC | 0 | -100.00 | 0 | |||||
| 2025-08-06 | 13F | Savant Capital, LLC | 6,142 | 222 | ||||||
| 2025-08-14 | 13F | Matrix Private Capital Group Llc | 11,550 | -4.94 | 418 | 5.57 | ||||
| 2025-08-07 | 13F | Sound View Wealth Advisors Group, LLC | 14,725 | -5.66 | 533 | 4.93 | ||||
| 2025-08-13 | 13F | EverSource Wealth Advisors, LLC | 2,500 | 0.00 | 90 | 11.11 | ||||
| 2025-08-06 | 13F | Aspect Partners, LLC | 100 | 0.00 | 4 | 0.00 | ||||
| 2025-07-08 | 13F | Dover Advisors, Llc | 9,600 | 9.71 | 347 | 22.18 | ||||
| 2025-08-08 | 13F | Hartland & Co., LLC | 550 | 0.00 | 20 | 11.76 | ||||
| 2025-07-16 | 13F | Signaturefd, Llc | 4,000 | -0.77 | 145 | 9.92 | ||||
| 2025-08-01 | 13F | Boyd Watterson Asset Management Llc/oh | 100 | 0.00 | 4 | 0.00 | ||||
| 2025-07-23 | 13F | Abel Hall, LLC | 10,000 | 362 | ||||||
| 2025-08-14 | 13F | Visionary Wealth Advisors | 11,620 | 47.72 | 420 | 64.71 | ||||
| 2025-07-18 | 13F | SOA Wealth Advisors, LLC. | 613 | 0.00 | 22 | 15.79 | ||||
| 2025-08-04 | 13F | Bay Colony Advisory Group, Inc d/b/a Bay Colony Advisors | 8,803 | 13.78 | 318 | 26.69 | ||||
| 2025-07-29 | 13F | Salomon & Ludwin, LLC | 580 | 0.00 | 21 | 11.11 | ||||
| 2025-05-12 | 13F | Sandy Spring Bank | 201 | 0.00 | 7 | 0.00 | ||||
| 2025-08-04 | 13F | Spire Wealth Management | 4,430 | -6.12 | 160 | 4.58 | ||||
| 2025-05-15 | 13F | Talon Private Wealth, LLC | 0 | -100.00 | 0 | -100.00 | ||||
| 2025-08-12 | 13F | Change Path, LLC | 57,193 | -9.29 | 2,069 | 0.88 | ||||
| 2025-07-31 | 13F | Cambridge Investment Research Advisors, Inc. | 91,696 | 3.85 | 3 | 50.00 | ||||
| 2025-07-16 | 13F | Signature Resources Capital Management, LLC | 250 | 0.00 | 9 | 12.50 | ||||
| 2025-08-13 | 13F | Everstar Asset Management, LLC | 5,650 | 204 | ||||||
| 2025-08-15 | 13F | Resources Management Corp /ct/ /adv | 356 | 0.00 | 0 | |||||
| 2025-08-19 | 13F | Newbridge Financial Services Group, Inc. | 22,283 | 806 | ||||||
| 2025-08-29 | 13F | Centaurus Financial, Inc. | 54,102 | -2.54 | 2 | 0.00 | ||||
| 2025-08-13 | 13F | Colonial Trust Advisors | 1,500 | 0.00 | 54 | 12.50 | ||||
| 2025-08-08 | 13F | Calamos Advisors LLC | 9,808 | -7.99 | 355 | 2.31 | ||||
| 2025-07-21 | 13F | Ameritas Advisory Services, LLC | 2,664 | 96 | ||||||
| 2025-08-18 | 13F | Geneos Wealth Management Inc. | 3,216 | 0.25 | 116 | 11.54 | ||||
| 2025-07-25 | 13F | Orca Investment Management, LLC | 9,775 | 0.00 | 354 | 11.01 | ||||
| 2025-07-15 | 13F | Fortitude Family Office, LLC | 340 | 12 | ||||||
| 2025-08-08 | 13F | Larson Financial Group LLC | 1,442 | 0.00 | 52 | 13.04 | ||||
| 2025-07-31 | 13F | Oppenheimer & Co Inc | 58,928 | 17.60 | 2,132 | 30.80 | ||||
| 2025-08-05 | 13F | Key FInancial Inc | 554 | 0.00 | 20 | 11.11 | ||||
| 2025-04-21 | 13F | Nelson, Van Denburg & Campbell Wealth Management Group, LLC | 0 | -100.00 | 0 | |||||
| 2025-08-11 | 13F | Nations Financial Group Inc, /ia/ /adv | 15,575 | 0.00 | 564 | 11.26 | ||||
| 2025-07-08 | 13F/A | Salem Investment Counselors Inc | 1,246 | 0.00 | 45 | 12.50 | ||||
| 2025-08-12 | 13F | NWF Advisory Services Inc. | 25,240 | 821 | ||||||
| 2025-08-12 | 13F | Steward Partners Investment Advisory, Llc | 32,998 | 6.06 | 1,194 | 17.89 | ||||
| 2025-08-01 | 13F | Logan Capital Management Inc | 1,000 | 0.00 | 36 | 12.50 | ||||
| 2025-08-15 | 13F | CI Private Wealth, LLC | 12,841 | 465 | ||||||
| 2025-09-04 | 13F | Beacon Capital Management, Inc. | 34,500 | 43.75 | 1,248 | 50.72 | ||||
| 2025-08-12 | 13F | Laurel Wealth Advisors LLC | 90,450 | 3,518.00 | 2 | -97.53 | ||||
| 2025-08-19 | 13F | Anchor Investment Management, LLC | 1,622 | 1.69 | 59 | 13.73 | ||||
| 2025-08-08 | 13F | Avantax Advisory Services, Inc. | 16,096 | 2.73 | 582 | 14.34 | ||||
| 2025-08-14 | 13F | Comerica Bank | 19,164 | 1.70 | 693 | 13.05 | ||||
| 2025-05-07 | 13F | Ramirez Asset Management, Inc. | 0 | -100.00 | 0 | |||||
| 2025-05-12 | 13F | Virtu Financial LLC | 0 | -100.00 | 0 | |||||
| 2025-08-13 | 13F | JBR Co Financial Management Inc | 131,812 | -3.16 | 4,769 | 7.65 | ||||
| 2025-08-11 | 13F | Delta Asset Management Llc/tn | 200 | 0.00 | 7 | 16.67 | ||||
| 2025-07-08 | 13F | Atlas Brown,Inc. | 19,579 | -5.87 | 708 | 4.73 | ||||
| 2025-08-12 | 13F | Global Retirement Partners, LLC | 1,692 | 61 | ||||||
| 2025-07-09 | 13F | Sunpointe, LLC | 17,774 | -25.10 | 643 | -16.71 | ||||
| 2025-08-08 | 13F | Islay Capital Management, Llc | 0 | 0 | ||||||
| 2025-07-17 | 13F | XML Financial, LLC | 49,655 | 3.62 | 1,797 | 15.20 | ||||
| 2025-07-29 | 13F | Stratos Wealth Partners, LTD. | 40,375 | 21.78 | 1,461 | 35.44 | ||||
| 2025-04-29 | 13F | Raleigh Capital Management Inc. | 0 | -100.00 | 0 | |||||
| 2025-08-05 | 13F | GPS Wealth Strategies Group, LLC | 1,253 | 0.00 | 45 | 12.50 | ||||
| 2025-08-14 | 13F | Peapack Gladstone Financial Corp | 8,150 | -6.25 | 0 | |||||
| 2025-07-08 | 13F | Lowe Wealth Advisors, LLC | 6,250 | 1.63 | 226 | 13.00 | ||||
| 2025-08-12 | 13F | BlackRock, Inc. | 384 | 0.00 | 14 | 8.33 | ||||
| 2025-07-23 | 13F | Stonegate Investment Group, LLC | 7,171 | 0.11 | 259 | 11.16 | ||||
| 2025-07-24 | 13F | IFP Advisors, Inc | 2,307 | -51.88 | 83 | -46.45 | ||||
| 2025-07-17 | 13F | Oakworth Capital, Inc. | 9,000 | 0.00 | 326 | 11.30 | ||||
| 2025-07-16 | 13F | ORG Wealth Partners, LLC | 591 | 1.72 | 21 | 10.53 | ||||
| 2025-08-11 | 13F | Wealthspire Advisors, LLC | 97,683 | 64.07 | 3,534 | 82.45 | ||||
| 2025-07-29 | 13F | Private Trust Co Na | 1,000 | 0.00 | 36 | 12.50 | ||||
| 2025-07-10 | 13F | Wealth Enhancement Advisory Services, Llc | 54,707 | 16.46 | 1,967 | 28.73 | ||||
| 2025-08-04 | 13F | HBK Sorce Advisory LLC | 13,067 | 11.07 | 473 | 23.56 | ||||
| 2025-07-18 | 13F | PFG Investments, LLC | 14,280 | 4.18 | 517 | 15.70 | ||||
| 2025-08-08 | 13F | Atlanta Consulting Group Advisors, LLC | 24,534 | 0.22 | 888 | 11.43 | ||||
| 2025-07-21 | 13F | DHJJ Financial Advisors, Ltd. | 98 | 0.00 | 4 | 0.00 | ||||
| 2025-07-24 | 13F | Ronald Blue Trust, Inc. | 1,067 | -25.85 | 39 | -17.39 | ||||
| 2025-08-08 | 13F | Creative Planning | 23,109 | 3.42 | 836 | 14.99 | ||||
| 2025-08-04 | 13F | Flagship Harbor Advisors, Llc | 10,875 | 0.00 | 393 | 11.33 | ||||
| 2025-07-28 | 13F | Harbour Investments, Inc. | 5,152 | 0.00 | 186 | 11.38 | ||||
| 2025-08-22 | NP | Cornerstone Total Return Fund Inc | 250,007 | 92.49 | 9,045 | 114.03 | ||||
| 2025-07-11 | 13F | LongView Wealth Management | 69,680 | 0.10 | 2,521 | 11.30 | ||||
| 2025-08-07 | 13F | Montag A & Associates Inc | 0 | -100.00 | 0 | |||||
| 2025-08-14 | 13F | Raymond James Financial Inc | 287,238 | 17.78 | 10,392 | 30.96 | ||||
| 2025-07-21 | 13F | Ameriflex Group, Inc. | 4,874 | -74.07 | 173 | -71.69 | ||||
| 2025-08-14 | 13F | GWM Advisors LLC | 111,791 | 42.31 | 4,045 | 58.22 | ||||
| 2025-07-23 | 13F | Castle Rock Wealth Management, LLC | 14,736 | 549 | ||||||
| 2025-08-07 | 13F | Merrion Investment Management Co, LLC | 25,000 | 0.00 | 904 | 11.19 | ||||
| 2025-07-31 | 13F | Graybill Bartz & Assoc Ltd | 12,081 | 12.47 | 437 | 25.21 | ||||
| 2025-08-04 | 13F | Integrity Alliance, Llc. | 33,623 | 9.32 | 1,216 | 21.60 | ||||
| 2025-08-14 | 13F | Monetary Management Group Inc | 16,400 | 134.29 | 593 | 161.23 | ||||
| 2025-08-13 | 13F | Hollow Brook Wealth Management LLC | 7,606 | -11.90 | 275 | -1.79 | ||||
| 2025-07-09 | 13F | Bank of New Hampshire | 1,560 | 0.00 | 56 | 12.00 | ||||
| 2025-08-06 | 13F | Prospera Financial Services Inc | 19,496 | 10.14 | 705 | 22.40 | ||||
| 2025-07-16 | 13F | Magnus Financial Group LLC | 203,951 | 9.02 | 7,379 | 21.21 | ||||
| 2025-08-04 | 13F | Keybank National Association/oh | 12,700 | 0.00 | 459 | 11.14 | ||||
| 2025-08-14 | 13F | Benjamin Edwards Inc | 8,644 | 2.64 | 313 | 13.87 | ||||
| 2025-08-14 | 13F | Mariner, LLC | 128,952 | 2.46 | 4,665 | 13.92 | ||||
| 2025-08-11 | 13F | Reaves W H & Co Inc | 88,623 | 1.64 | 3,206 | 13.01 | ||||
| 2025-08-13 | 13F | Strategic Family Wealth Counselors, L.L.C. | 28,073 | -0.67 | 1,016 | 10.45 | ||||
| 2025-04-14 | 13F | Bruce G. Allen Investments, LLC | 0 | -100.00 | 0 | -100.00 | ||||
| 2025-08-13 | 13F | First Trust Advisors Lp | 41,144 | -0.45 | 1,489 | 10.71 | ||||
| 2025-05-16 | 13F | Jones Financial Companies Lllp | 0 | -100.00 | 0 | |||||
| 2025-07-25 | 13F | LRI Investments, LLC | 1,440 | 0.00 | 52 | 13.04 | ||||
| 2025-08-01 | 13F | Envestnet Asset Management Inc | 15,474 | 0.51 | 560 | 11.80 |