Basic Stats
| Insider Profile | REAVES W H & CO INC |
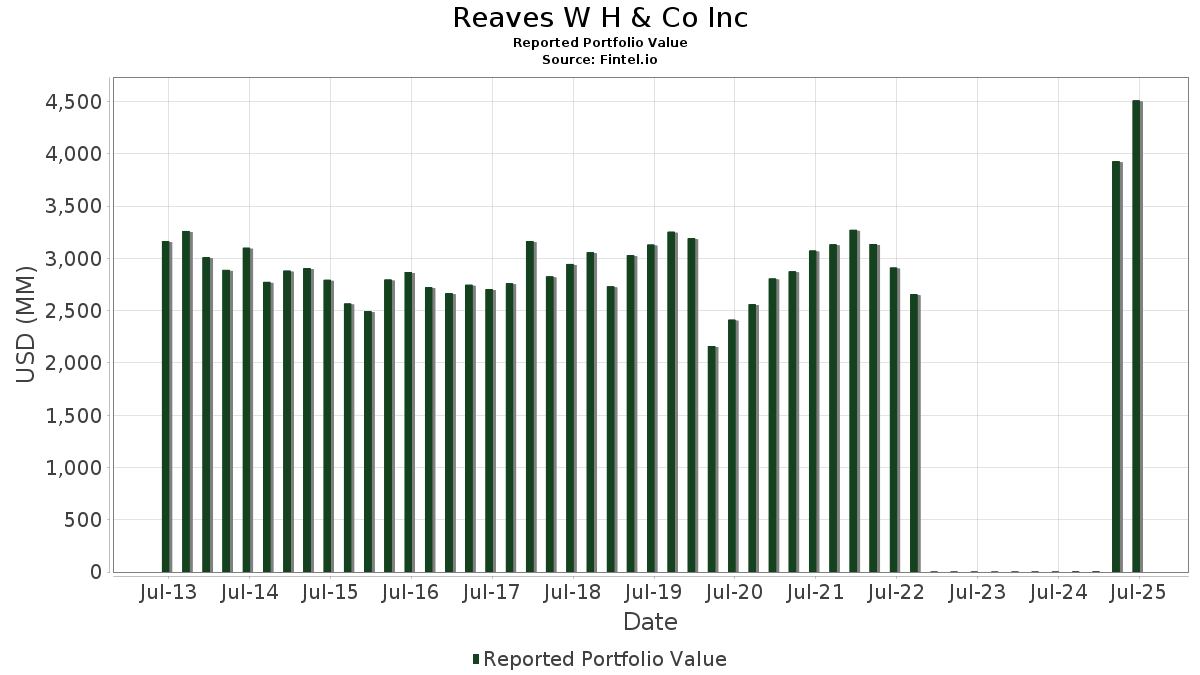
| Portfolio Value | $ 4,510,788,821 |
| Current Positions | 77 |
Latest Holdings, Performance, AUM (from 13F, 13D)
Reaves W H & Co Inc has disclosed 77 total holdings in their latest SEC filings. Most recent portfolio value is calculated to be $ 4,510,788,821 USD. Actual Assets Under Management (AUM) is this value plus cash (which is not disclosed). Reaves W H & Co Inc’s top holdings are Talen Energy Corporation (US:TLN) , Vistra Corp. (US:VST) , Constellation Energy Corporation (US:CEG) , CenterPoint Energy, Inc. (US:CNP) , and IDACORP, Inc. (US:IDA) . Reaves W H & Co Inc’s new positions include MP Materials Corp. (US:MP) , .
Top Increases This Quarter
We use the change in the portfolio allocation because this is the most meaningful metric. Changes can be due to trades or changes in share prices.
| Security | Shares (MM) |
Value (MM$) |
Portfolio % | ΔPortfolio % |
|---|---|---|---|---|
| 1.87 | 129.73 | 1.9081 | 1.2174 | |
| 0.96 | 32.11 | 0.7118 | 0.7118 | |
| 0.45 | 43.58 | 0.6411 | 0.6411 | |
| 0.67 | 34.54 | 0.5080 | 0.3582 | |
| 0.21 | 38.27 | 0.5629 | 0.2009 | |
| 0.82 | 265.74 | 3.9085 | 0.1933 | |
| 0.13 | 21.29 | 0.3132 | 0.1498 | |
| 0.33 | 19.16 | 0.2818 | 0.1287 | |
| 0.35 | 44.92 | 0.6607 | 0.0823 | |
| 0.07 | 13.03 | 0.1916 | 0.0436 |
Top Decreases This Quarter
We use the change in the portfolio allocation because this is the most meaningful metric. Changes can be due to trades or changes in share prices.
| Security | Shares (MM) |
Value (MM$) |
Portfolio % | ΔPortfolio % |
|---|---|---|---|---|
| 1.98 | 164.39 | 2.4179 | -2.6443 | |
| 3.72 | 150.14 | 2.2083 | -2.0291 | |
| 2.57 | 144.84 | 2.1303 | -1.9841 | |
| 3.82 | 129.49 | 1.9045 | -1.8998 | |
| 0.31 | 48.24 | 0.7095 | -1.8794 | |
| 1.54 | 116.89 | 1.7193 | -1.7213 | |
| 1.49 | 133.12 | 1.9580 | -1.7009 | |
| 2.52 | 171.36 | 2.5204 | -1.6239 | |
| 3.59 | 111.45 | 1.6392 | -1.4832 | |
| 0.16 | 126.29 | 1.8576 | -1.4136 |
13F and Fund Filings
This form was filed on 2025-08-11 for the reporting period 2025-06-30. Click the link icon to see the full transaction history.
Upgrade to unlock premium data and export to Excel ![]() .
.
| Security | Type | Avg Share Price | Shares (MM) |
ΔShares (%) |
ΔShares (%) |
Value ($MM) |
Portfolio (%) |
ΔPortfolio (%) |
|
|---|---|---|---|---|---|---|---|---|---|
| TLN / Talen Energy Corporation | 1.25 | 3.25 | 364.19 | 50.37 | 5.3566 | -0.8070 | |||
| VST / Vistra Corp. | 1.57 | 5.65 | 303.94 | 74.36 | 4.4705 | 0.0344 | |||
| CEG / Constellation Energy Corporation | 0.82 | 13.71 | 265.74 | 82.02 | 3.9085 | 0.1933 | |||
| CNP / CenterPoint Energy, Inc. | 6.26 | 42.68 | 229.90 | 44.69 | 3.3814 | -0.6621 | |||
| IDA / IDACORP, Inc. | 1.57 | 25.56 | 180.89 | 24.72 | 2.6606 | -1.0302 | |||
| XEL / Xcel Energy Inc. | 2.52 | 9.38 | 171.36 | 5.22 | 2.5204 | -1.6239 | |||
| ETR / Entergy Corporation | 1.98 | -15.00 | 164.39 | -17.36 | 2.4179 | -2.6443 | |||
| NI / NiSource Inc. | 3.72 | -10.39 | 150.14 | -9.83 | 2.2083 | -2.0291 | |||
| TXNM / TXNM Energy, Inc. | 2.57 | -14.93 | 144.84 | -10.42 | 2.1303 | -1.9841 | |||
| PEG / Public Service Enterprise Group Incorporated | 1.58 | 20.69 | 133.32 | 23.44 | 1.9609 | -0.7875 | |||
| PNW / Pinnacle West Capital Corporation | 1.49 | -1.43 | 133.12 | -7.41 | 1.9580 | -1.7009 | |||
| CMS / CMS Energy Corporation | 1.87 | 418.17 | 129.73 | 377.95 | 1.9081 | 1.2174 | |||
| PPL / PPL Corporation | 3.82 | -7.71 | 129.49 | -13.38 | 1.9045 | -1.8998 | |||
| EQIX / Equinix, Inc. | 0.16 | 0.71 | 126.29 | -1.75 | 1.8576 | -1.4136 | |||
| SRE / Sempra | 1.54 | -18.57 | 116.89 | -13.54 | 1.7193 | -1.7213 | |||
| CCJ / Cameco Corporation | 1.56 | -2.89 | 115.54 | 75.14 | 1.6993 | 0.0206 | |||
| EPD / Enterprise Products Partners L.P. - Limited Partnership | 3.59 | 0.00 | 111.45 | -9.17 | 1.6392 | -1.4832 | |||
| PWR / Quanta Services, Inc. | 0.27 | -3.46 | 102.78 | 43.60 | 1.5117 | -0.3097 | |||
| SBAC / SBA Communications Corporation | 0.43 | 6.26 | 101.60 | 13.43 | 1.4944 | -0.7852 | |||
| CHTR / Charter Communications, Inc. | 0.20 | 41.59 | 80.54 | 57.06 | 1.1847 | -0.1204 | |||
| DTM / DT Midstream, Inc. | 0.70 | -7.56 | 76.77 | 5.31 | 1.1291 | -0.7259 | |||
| DTE / DTE Energy Company | 0.56 | -6.52 | 74.28 | -10.45 | 1.0925 | -1.0182 | |||
| LNT / Alliant Energy Corporation | 1.15 | 76.78 | 69.70 | 66.12 | 1.0252 | -0.0426 | |||
| UNP / Union Pacific Corporation | 0.30 | -0.56 | 69.17 | -3.16 | 1.0174 | -0.8003 | |||
| CMCSA / Comcast Corporation | 1.86 | -6.73 | 66.33 | -9.79 | 0.9757 | -0.8956 | |||
| NEE / NextEra Energy, Inc. | 0.89 | -11.40 | 62.06 | -13.23 | 0.9128 | -0.9074 | |||
| NSC / Norfolk Southern Corporation | 0.22 | 0.00 | 56.13 | 8.07 | 0.8256 | -0.4962 | |||
| OGE / OGE Energy Corp. | 1.24 | 1.86 | 55.13 | -1.64 | 1.2222 | -0.2042 | |||
| ATO / Atmos Energy Corporation | 0.31 | -52.44 | 48.24 | -52.58 | 0.7095 | -1.8794 | |||
| OKE / ONEOK, Inc. | 0.58 | 68.78 | 47.70 | 38.86 | 0.7017 | -0.1726 | |||
| WMB / The Williams Companies, Inc. | 0.75 | 11.09 | 46.97 | 16.76 | 0.6908 | -0.3329 | |||
| VRT / Vertiv Holdings Co | 0.35 | 11.12 | 44.92 | 97.63 | 0.6607 | 0.0823 | |||
| AEE / Ameren Corporation | 0.45 | 43.58 | 0.6411 | 0.6411 | |||||
| AMT / American Tower Corporation | 0.19 | 0.00 | 42.67 | 1.57 | 0.6275 | -0.4414 | |||
| CCOI / Cogent Communications Holdings, Inc. | 0.82 | 1.47 | 39.53 | -20.21 | 0.5814 | -0.6793 | |||
| LEU / Centrus Energy Corp. | 0.21 | -8.64 | 38.27 | 169.01 | 0.5629 | 0.2009 | |||
| TMUS / T-Mobile US, Inc. | 0.15 | -27.88 | 36.76 | -35.58 | 0.5407 | -0.9114 | |||
| MPLX / MPLX LP - Limited Partnership | 0.67 | 509.55 | 34.54 | 486.67 | 0.5080 | 0.3582 | |||
| MP / MP Materials Corp. | 0.96 | 32.11 | 0.7118 | 0.7118 | |||||
| PCG / PG&E Corporation | 2.18 | -32.70 | 30.38 | -45.39 | 0.4469 | -0.9690 | |||
| DY / Dycom Industries, Inc. | 0.12 | -13.78 | 29.73 | 38.32 | 0.4373 | -0.1097 | |||
| FYBR / Frontier Communications Parent, Inc. | 0.71 | -0.18 | 25.76 | 1.32 | 0.3788 | -0.2681 | |||
| MPC / Marathon Petroleum Corporation | 0.15 | 0.00 | 24.92 | 14.02 | 0.3665 | -0.1896 | |||
| AWK / American Water Works Company, Inc. | 0.16 | -38.22 | 21.72 | -41.75 | 0.3195 | -0.6294 | |||
| NRG / NRG Energy, Inc. | 0.13 | 97.22 | 21.29 | 231.75 | 0.3132 | 0.1498 | |||
| EQT / EQT Corporation | 0.33 | 191.70 | 19.16 | 218.40 | 0.2818 | 0.1287 | |||
| DLR / Digital Realty Trust, Inc. | 0.07 | 84.13 | 13.03 | 124.02 | 0.1916 | 0.0436 | |||
| ODFL / Old Dominion Freight Line, Inc. | 0.07 | 82.01 | 12.04 | 78.55 | 0.1771 | 0.0055 | |||
| GEV / GE Vernova Inc. | 0.02 | 0.00 | 10.58 | 73.35 | 0.1557 | 0.0003 | |||
| LIN / Linde plc | 0.02 | 0.96 | 9.99 | 1.72 | 0.1469 | -0.1029 | |||
| BRK.B / Berkshire Hathaway Inc. | 0.02 | 0.00 | 8.90 | -8.79 | 0.1310 | -0.1175 | |||
| JCI / Johnson Controls International plc | 0.05 | 1.10 | 5.34 | 33.29 | 0.0785 | -0.0234 | |||
| T / AT&T Inc. | 0.18 | -38.44 | 5.23 | -37.00 | 0.0770 | -0.1344 | |||
| CPK / Chesapeake Utilities Corporation | 0.03 | 0.00 | 3.61 | -6.39 | 0.0530 | -0.0450 | |||
| UTG / Reaves Utility Income Fund | 0.09 | 1.64 | 3.21 | 13.01 | 0.0472 | -0.0250 | |||
| CNI / Canadian National Railway Company | 0.03 | -1.73 | 3.04 | 4.90 | 0.0447 | -0.0290 | |||
| LAMR / Lamar Advertising Company | 0.03 | 0.00 | 3.03 | 6.68 | 0.0446 | -0.0278 | |||
| SO / The Southern Company | 0.03 | -12.65 | 2.76 | -12.75 | 0.0406 | -0.0399 | |||
| XOM / Exxon Mobil Corporation | 0.02 | -94.84 | 1.93 | -95.32 | 0.0284 | -1.0215 | |||
| CVX / Chevron Corporation | 0.01 | -0.49 | 1.59 | -14.83 | 0.0234 | -0.0241 | |||
| SCE.PRJ / SCE Trust IV - Preferred Stock | 0.06 | 0.00 | 1.44 | 1.55 | 0.0212 | -0.0149 | |||
| DTEGY / Deutsche Telekom AG - Depositary Receipt (Common Stock) | 0.04 | -1.68 | 1.38 | -3.30 | 0.0202 | -0.0160 | |||
| AAPL / Apple Inc. | 0.00 | 0.00 | 0.98 | -7.69 | 0.0218 | -0.0053 | |||
| DUK / Duke Energy Corporation | 0.01 | -1.69 | 0.96 | -4.84 | 0.0142 | -0.0116 | |||
| PM / Philip Morris International Inc. | 0.01 | 0.00 | 0.91 | 14.75 | 0.0134 | -0.0068 | |||
| MDU / MDU Resources Group, Inc. | 0.05 | 0.00 | 0.83 | -1.42 | 0.0123 | -0.0093 | |||
| ECG / Everus Construction Group, Inc. | 0.01 | 0.00 | 0.79 | 71.49 | 0.0117 | -0.0001 | |||
| PLD / Prologis, Inc. | 0.01 | 0.00 | 0.77 | -5.96 | 0.0114 | -0.0096 | |||
| CP / Canadian Pacific Kansas City Limited | 0.01 | 0.00 | 0.74 | 12.80 | 0.0109 | -0.0058 | |||
| EXC / Exelon Corporation | 0.02 | -5.61 | 0.73 | -11.07 | 0.0108 | -0.0102 | |||
| NJR / New Jersey Resources Corporation | 0.02 | -68.10 | 0.67 | -70.87 | 0.0099 | -0.0489 | |||
| PPG / PPG Industries, Inc. | 0.01 | 0.00 | 0.57 | 4.03 | 0.0084 | -0.0055 | |||
| JNJ / Johnson & Johnson | 0.00 | 0.00 | 0.50 | -7.73 | 0.0074 | -0.0065 | |||
| MO / Altria Group, Inc. | 0.01 | 0.00 | 0.47 | -2.29 | 0.0069 | -0.0053 | |||
| EIX / Edison International | 0.01 | -99.15 | 0.34 | -99.26 | 0.0050 | -1.1583 | |||
| NWN / Northwest Natural Holding Company | 0.01 | -77.22 | 0.23 | -78.88 | 0.0035 | -0.0248 | |||
| VZ / Verizon Communications Inc. | 0.00 | -98.36 | 0.20 | -98.44 | 0.0030 | -0.3256 | |||
| AEP / American Electric Power Company, Inc. | 0.00 | -100.00 | 0.00 | 0.0000 | |||||
| GOOGL / Alphabet Inc. | 0.00 | -100.00 | 0.00 | 0.0000 | |||||
| GOOG / Alphabet Inc. | 0.00 | -100.00 | 0.00 | 0.0000 | |||||
| USM / United States Cellular Corporation | 0.00 | -100.00 | 0.00 | 0.0000 |