Basic Stats
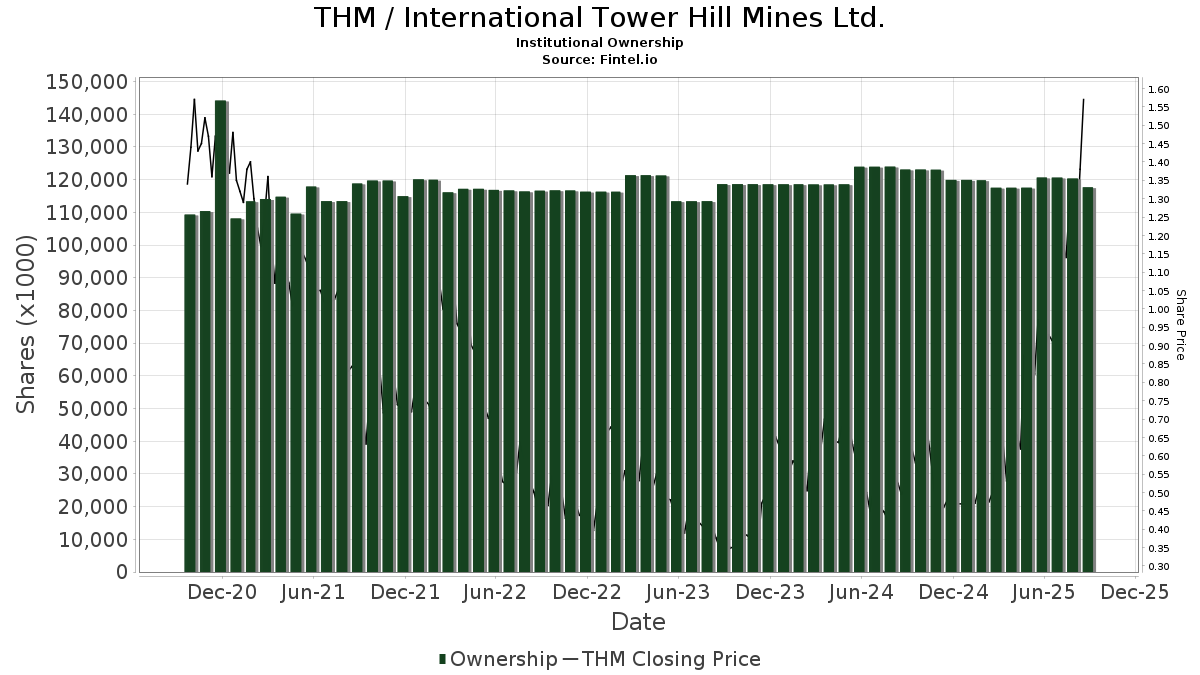
| Institutional Shares (Long) | 117,683,008 - 56.61% (ex 13D/G) - change of -2.98MM shares -2.47% MRQ |
| Institutional Value (Long) | $ 98,730 USD ($1000) |
Institutional Ownership and Shareholders
International Tower Hill Mines Ltd. (US:THM) has 48 institutional owners and shareholders that have filed 13D/G or 13F forms with the Securities Exchange Commission (SEC). These institutions hold a total of 117,683,008 shares. Largest shareholders include Paulson & Co. Inc., Sprott Inc., Kopernik Global Investors, LLC, KGGAX - KOPERNIK GLOBAL ALL-CAP FUND CLASS A SHARES, SPROTT FUNDS TRUST - Sprott Gold Equity Fund Institutional Class, Russell Investments Group, Ltd., Morgan Stanley, Sei Investments Co, TIFF INVESTMENT PROGRAM - TIFF Multi-Asset Fund, and Evoke Wealth, Llc .
International Tower Hill Mines Ltd. (NYSEAM:THM) institutional ownership structure shows current positions in the company by institutions and funds, as well as latest changes in position size. Major shareholders can include individual investors, mutual funds, hedge funds, or institutions. The Schedule 13D indicates that the investor holds (or held) more than 5% of the company and intends (or intended) to actively pursue a change in business strategy. Schedule 13G indicates a passive investment of over 5%.
The share price as of September 4, 2025 is 1.43 / share. Previously, on September 5, 2024, the share price was 0.51 / share. This represents an increase of 182.50% over that period.
Fund Sentiment Score
The Fund Sentiment Score (fka Ownership Accumulation Score) finds the stocks that are being most bought by funds. It is the result of a sophisticated, multi-factor quantitative model that identifies companies with the highest levels of institutional accumulation. The scoring model uses a combination of the total increase in disclosed owners, the changes in portfolio allocations in those owners and other metrics. The number ranges from 0 to 100, with higher numbers indicating a higher level of accumulation to its peers, and 50 being the average.
Update Frequency: Daily
See Ownership Explorer, which provides a list of highest-ranking companies.
Institutional Put/Call Ratio
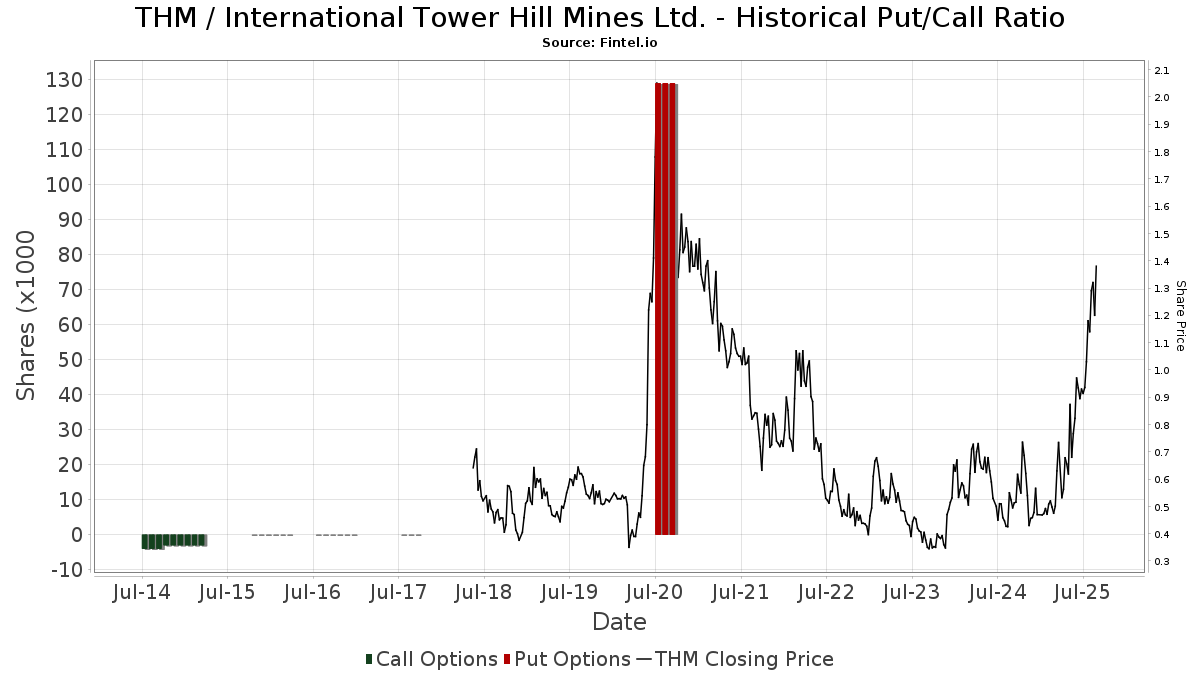
In addition to reporting standard equity and debt issues, institutions with more than 100MM assets under management must also disclose their put and call option holdings. Since put options generally indicate negative sentiment, and call options indicate positive sentiment, we can get a sense of the overall institutional sentiment by plotting the ratio of puts to calls. The chart to the right plots the historical put/call ratio for this instrument.
Using Put/Call Ratio as an indicator of investor sentiment overcomes one of the key deficiencies of using total institutional ownership, which is that a significant amount of assets under management are invested passively to track indices. Passively-managed funds do not typically buy options, so the put/call ratio indicator more closely tracks the sentiment of actively-managed funds.
13D/G Filings
We present 13D/G filings separately from the 13F filings because of the different treatement by the SEC. 13D/G filings can be filed by groups of investors (with one leading), whereas 13F filings cannot. This results in situations where an investor may file a 13D/G reporting one value for the total shares (representing all the shares owned by the investor group), but then file a 13F reporting a different value for the total shares (representing strictly their own ownership). This means that share ownership of 13D/G filings and 13F filings are oftentimes not directly comparable, so we present them separately.
Note: As of May 16, 2021, we no longer show owners that have not filed a 13D/G within the last year. Previously, we were showing the full history of 13D/G filings. In general, entities that are required to file 13D/G filings must file at least annually before submitting a closing filing. However, funds sometimes exit positions without submitting a closing filing (ie, they wind down), so displaying the full history sometimes resulted in confusion about the current ownership. To prevent confusion, we now only show ’current’ owners - that is - owners that have filed within the last year.
Upgrade to unlock premium data.
| File Date | Form | Investor | Prev Shares |
Latest Shares |
Δ Shares (Percent) |
Ownership (Percent) |
Δ Ownership (Percent) |
|
|---|---|---|---|---|---|---|---|---|
| 2025-05-15 | SPROTT INC. | 22,919,535 | 21,614,267 | -5.70 | 10.40 | -9.57 | ||
| 2025-03-05 | PAULSON & CO. INC. | 64,198,980 | 70,239,388 | 9.41 | 33.80 | 5.30 | ||
| 2024-11-04 | Kopernik Global Investors, LLC | 15,507,282 | 15,986,338 | 3.09 | 8.00 | 1.01 |
13F and NPORT Filings
Detail on 13F filings are free. Detail on NP filings require a premium membership. Green rows indicate new positions. Red rows indicate closed positions. Click the link icon to see the full transaction history.
Upgrade
to unlock premium data and export to Excel ![]() .
.
| File Date | Source | Investor | Type | Avg Price (Est) |
Shares | Δ Shares (%) |
Reported Value ($1000) |
Δ Value (%) |
Port Alloc (%) |
|
|---|---|---|---|---|---|---|---|---|---|---|
| 2025-09-04 | 13F/A | Advisor Group Holdings, Inc. | 6,862 | -36.01 | 6 | -16.67 | ||||
| 2025-05-13 | 13F | Northern Trust Corp | 0 | -100.00 | 0 | -100.00 | ||||
| 2025-08-14 | 13F | Royal Bank Of Canada | 19,136 | 54.32 | 16 | 100.00 | ||||
| 2025-08-15 | 13F | CI Private Wealth, LLC | 12,500 | 0.00 | 11 | 42.86 | ||||
| 2025-08-14 | 13F | CoreCap Advisors, LLC | 700 | 0.00 | 1 | |||||
| 2025-07-25 | 13F | Atria Wealth Solutions, Inc. | 58,000 | 15.63 | 50 | 58.06 | ||||
| 2025-08-15 | 13F | Morgan Stanley | 807,789 | 90.83 | 691 | 158.80 | ||||
| 2025-08-12 | 13F | XTX Topco Ltd | 59,074 | 97.65 | 51 | 177.78 | ||||
| 2025-07-16 | 13F | Phil A. Younker & Associates, Ltd. | 10,000 | 0.00 | 9 | 33.33 | ||||
| 2025-08-15 | 13F | Captrust Financial Advisors | 81,142 | 69 | ||||||
| 2025-08-07 | 13F | Evoke Wealth, Llc | 318,750 | 0.00 | 273 | 35.32 | ||||
| 2025-07-23 | 13F | Hemenway Trust Co LLC | 83,400 | 0.00 | 71 | 36.54 | ||||
| 2025-08-14 | 13F | Kopernik Global Investors, LLC | 14,448,418 | 0.00 | 12,361 | 35.36 | ||||
| 2025-07-17 | 13F | CWA Asset Management Group, LLC | 10,000 | 0.00 | 9 | 33.33 | ||||
| 2025-08-11 | 13F | Sprott Inc. | 19,778,015 | -8.50 | 17,000 | 23.22 | ||||
| 2025-08-27 | NP | Brighthouse Funds Trust II - Brighthouse/Dimensional International Small Company Portfolio Class A | 21,604 | 0.00 | 19 | 38.46 | ||||
| 2025-05-16 | 13F | Coppell Advisory Solutions LLC | 0 | -100.00 | 0 | |||||
| 2025-08-14 | 13F | Bank Of America Corp /de/ | 28,525 | 24 | ||||||
| 2025-08-27 | NP | TIFF INVESTMENT PROGRAM - TIFF Multi-Asset Fund | 376,174 | 0.00 | 322 | 35.44 | ||||
| 2025-08-12 | 13F | Jpmorgan Chase & Co | 500 | 0.00 | 0 | |||||
| 2025-06-26 | NP | KGGAX - KOPERNIK GLOBAL ALL-CAP FUND CLASS A SHARES | 6,548,183 | 0.00 | 4,053 | 34.53 | ||||
| 2025-08-14 | 13F | Citadel Advisors Llc | 16,385 | -91.84 | 14 | -88.89 | ||||
| 2025-08-14 | 13F | Sei Investments Co | 600,830 | 0.00 | 514 | 35.62 | ||||
| 2025-08-08 | 13F | Avantax Advisory Services, Inc. | 10,048 | -49.88 | 9 | -33.33 | ||||
| 2025-08-18 | 13F/A | National Bank Of Canada /fi/ | 135 | -54.08 | 0 | |||||
| 2025-08-07 | 13F | Connor, Clark & Lunn Investment Management Ltd. | 120,600 | 589.14 | 104 | 836.36 | ||||
| 2025-08-14 | 13F | Two Sigma Securities, Llc | 22,971 | 20 | ||||||
| 2025-07-29 | 13F | Stratos Wealth Partners, LTD. | 11,812 | 0.00 | 10 | 42.86 | ||||
| 2025-07-29 | 13F | Mountain Capital Investment Advisors, Inc | 0 | -100.00 | 0 | |||||
| 2025-08-07 | 13F | Kestra Private Wealth Services, Llc | 13,000 | 0.00 | 11 | 37.50 | ||||
| 2025-06-18 | NP | RMYAX - Multi-Strategy Income Fund Class A | 18,199 | -56.16 | 11 | -42.11 | ||||
| 2025-08-13 | 13F | Northwestern Mutual Wealth Management Co | 0 | -100.00 | 0 | |||||
| 2025-08-14 | 13F | Dauntless Investment Group, LLC | 0 | -100.00 | 0 | |||||
| 2025-08-14 | 13F | Jane Street Group, Llc | 90,084 | 77 | ||||||
| 2025-05-29 | NP | SPROTT FUNDS TRUST - Sprott Gold Equity Fund Institutional Class | 1,863,852 | -48.18 | 1,178 | -28.14 | ||||
| 2025-08-12 | 13F | Proequities, Inc. | Put | 0 | 0 | |||||
| 2025-08-12 | 13F | Proequities, Inc. | Call | 0 | 0 | |||||
| 2025-08-12 | 13F | Proequities, Inc. | 0 | 0 | ||||||
| 2025-08-12 | 13F | Virtu Financial LLC | 0 | -100.00 | 0 | |||||
| 2025-08-08 | 13F | Thompson Davis & Co., Inc. | 0 | -100.00 | 0 | |||||
| 2025-07-23 | 13F | Traphagen Investment Advisors Llc | 11,257 | 10 | ||||||
| 2025-05-13 | 13F | Ground Swell Capital, LLC | 0 | -100.00 | 0 | |||||
| 2025-08-13 | 13F | Marshall Wace, Llp | 37,551 | 32 | ||||||
| 2025-08-29 | NP | JAJDX - International Small Company Trust NAV | 2,300 | 0.00 | 2 | 0.00 | ||||
| 2025-08-14 | 13F | Paulson & Co. Inc. | 70,239,388 | 0.00 | 60,090 | 35.36 | ||||
| 2025-08-14 | 13F | Wells Fargo & Company/mn | 50,000 | -85.96 | 43 | -81.33 | ||||
| 2025-08-14 | 13F | Raymond James Financial Inc | 615 | 1 | ||||||
| 2025-07-24 | 13F | Blue Zone Wealth Advisors, LLC | 23,000 | 0.00 | 20 | 35.71 | ||||
| 2025-07-30 | 13F | Journey Advisory Group, LLC | 0 | -100.00 | 0 | |||||
| 2025-07-25 | 13F | Concurrent Investment Advisors, LLC | 35,275 | 0.00 | 30 | 36.36 | ||||
| 2025-08-12 | 13F | LPL Financial LLC | 12,700 | 11 | ||||||
| 2025-08-13 | 13F | Russell Investments Group, Ltd. | 1,533,445 | -33.02 | 1,312 | -9.34 | ||||
| 2025-08-14 | 13F | Federation des caisses Desjardins du Quebec | 2,000 | 0.00 | 2 | 0.00 | ||||
| 2025-07-28 | 13F | Cypress Wealth Services, LLC | 129,687 | 0.00 | 111 | 35.80 | ||||
| 2025-08-12 | 13F | Tradition Wealth Management, LLC | 31,000 | -24.39 | 27 | 4.00 | ||||
| 2025-08-13 | 13F | Scotia Capital Inc. | 17,500 | -12.50 | 15 | 16.67 | ||||
| 2025-08-14 | 13F | Hrt Financial Lp | 10,182 | -42.59 | 0 | |||||
| 2025-06-18 | NP | RAZAX - Multi-Asset Growth Strategy Fund Class A | 104,920 | 0.00 | 65 | 33.33 | ||||
| 2025-08-01 | 13F | Rossby Financial, LCC | 5,000 | 4 | ||||||
| 2025-08-14 | 13F | UBS Group AG | 500 | 0.00 | 0 |