Basic Stats
| Institutional Owners | 114 total, 113 long only, 0 short only, 1 long/short - change of -6.56% MRQ |
| Average Portfolio Allocation | 0.1338 % - change of -25.01% MRQ |
| Institutional Shares (Long) | 23,791,013 (ex 13D/G) - change of 4.01MM shares 20.28% MRQ |
| Institutional Value (Long) | $ 551,442 USD ($1000) |
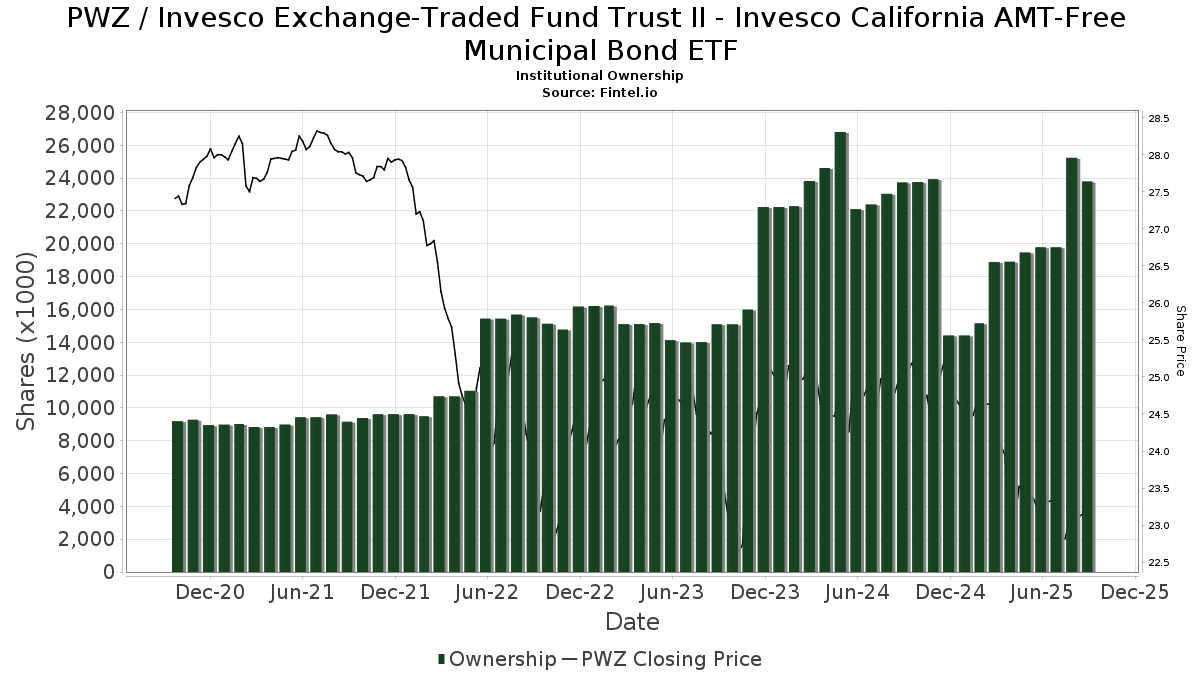
Institutional Ownership and Shareholders
Invesco Exchange-Traded Fund Trust II - Invesco California AMT-Free Municipal Bond ETF (US:PWZ) has 114 institutional owners and shareholders that have filed 13D/G or 13F forms with the Securities Exchange Commission (SEC). These institutions hold a total of 23,791,013 shares. Largest shareholders include Wealthfront Advisers Llc, Miracle Mile Advisors, LLC, Stratos Wealth Partners, LTD., Mercer Global Advisors Inc /adv, Envestnet Asset Management Inc, Syon Capital Llc, Gerber Kawasaki Wealth & Investment Management, First Foundation Advisors, EP Wealth Advisors, Inc., and Bank Of America Corp /de/ .
Invesco Exchange-Traded Fund Trust II - Invesco California AMT-Free Municipal Bond ETF (ARCA:PWZ) institutional ownership structure shows current positions in the company by institutions and funds, as well as latest changes in position size. Major shareholders can include individual investors, mutual funds, hedge funds, or institutions. The Schedule 13D indicates that the investor holds (or held) more than 5% of the company and intends (or intended) to actively pursue a change in business strategy. Schedule 13G indicates a passive investment of over 5%.
The share price as of September 5, 2025 is 23.54 / share. Previously, on September 6, 2024, the share price was 25.12 / share. This represents a decline of 6.29% over that period.
Fund Sentiment Score
The Fund Sentiment Score (fka Ownership Accumulation Score) finds the stocks that are being most bought by funds. It is the result of a sophisticated, multi-factor quantitative model that identifies companies with the highest levels of institutional accumulation. The scoring model uses a combination of the total increase in disclosed owners, the changes in portfolio allocations in those owners and other metrics. The number ranges from 0 to 100, with higher numbers indicating a higher level of accumulation to its peers, and 50 being the average.
Update Frequency: Daily
See Ownership Explorer, which provides a list of highest-ranking companies.
Institutional Put/Call Ratio
In addition to reporting standard equity and debt issues, institutions with more than 100MM assets under management must also disclose their put and call option holdings. Since put options generally indicate negative sentiment, and call options indicate positive sentiment, we can get a sense of the overall institutional sentiment by plotting the ratio of puts to calls. The chart to the right plots the historical put/call ratio for this instrument.
Using Put/Call Ratio as an indicator of investor sentiment overcomes one of the key deficiencies of using total institutional ownership, which is that a significant amount of assets under management are invested passively to track indices. Passively-managed funds do not typically buy options, so the put/call ratio indicator more closely tracks the sentiment of actively-managed funds.

13F and NPORT Filings
Detail on 13F filings are free. Detail on NP filings require a premium membership. Green rows indicate new positions. Red rows indicate closed positions. Click the link icon to see the full transaction history.
Upgrade
to unlock premium data and export to Excel ![]() .
.
| File Date | Source | Investor | Type | Avg Price (Est) |
Shares | Δ Shares (%) |
Reported Value ($1000) |
Δ Value (%) |
Port Alloc (%) |
|
|---|---|---|---|---|---|---|---|---|---|---|
| 2025-07-18 | 13F | Warren Street Wealth Advisors, LLC | 19,907 | -3.23 | 465 | -5.31 | ||||
| 2025-07-18 | 13F | Bartlett & Co. Wealth Management Llc | 3,747 | 162.03 | 87 | 155.88 | ||||
| 2025-08-12 | 13F | Jpmorgan Chase & Co | 165,571 | -58.64 | 3,864 | -59.53 | ||||
| 2025-08-13 | 13F | Dynamic Wealth Strategies, LLC | 9,717 | -71.64 | 227 | -72.34 | ||||
| 2025-05-15 | 13F/A | Orion Portfolio Solutions, LLC | 92,720 | -3.16 | 2,211 | -6.47 | ||||
| 2025-08-08 | 13F | Creative Planning | 18,359 | -20.33 | 428 | -22.04 | ||||
| 2025-08-08 | 13F | Crossmark Global Holdings, Inc. | 26,448 | -3.32 | 617 | -6.10 | ||||
| 2025-08-11 | 13F | Avantax Planning Partners, Inc. | 15,296 | -39.18 | 357 | -40.40 | ||||
| 2025-08-07 | 13F | Resources Investment Advisors, LLC. | 45,580 | -60.50 | 1,064 | -61.36 | ||||
| 2025-08-12 | 13F | Steward Partners Investment Advisory, Llc | 10,250 | -1.51 | 239 | -3.63 | ||||
| 2025-08-14 | 13F | BCS Private Wealth Management, Inc. | 20,000 | 0 | ||||||
| 2025-07-18 | 13F | SimpliFi, Inc. | 62,431 | 5.02 | 1,457 | 2.82 | ||||
| 2025-08-06 | 13F | Prospera Financial Services Inc | 43,213 | -3.92 | 1,009 | -5.97 | ||||
| 2025-07-28 | 13F | Elmwood Wealth Management, Inc. | 25,075 | 2.66 | 585 | 0.52 | ||||
| 2025-07-08 | 13F | Zrc Wealth Management, Llc | 3,018 | 0.87 | 70 | -1.41 | ||||
| 2025-08-14 | 13F | Hrt Financial Lp | 0 | -100.00 | 0 | |||||
| 2025-07-28 | 13F | Harbour Investments, Inc. | 407 | 0.00 | 9 | 0.00 | ||||
| 2025-08-01 | 13F | Rossby Financial, LCC | 10,000 | 0.00 | 233 | 0.00 | ||||
| 2025-08-12 | 13F | Global Retirement Partners, LLC | 12,545 | -40.61 | 293 | -43.95 | ||||
| 2025-08-14 | 13F | First Foundation Advisors | 952,878 | -14.55 | 22,240 | -16.37 | ||||
| 2025-08-14 | 13F | Dimension Capital Management Llc | 26,232 | 0.00 | 612 | -2.08 | ||||
| 2025-08-04 | 13F | Bristlecone Advisors, LLC | 0 | -100.00 | 0 | |||||
| 2025-08-14 | 13F | Royal Bank Of Canada | 10,178 | -45.60 | 238 | -46.64 | ||||
| 2025-08-14 | 13F | UBS Group AG | 102,562 | 13.76 | 2,394 | 11.30 | ||||
| 2025-08-01 | 13F | Envestnet Asset Management Inc | 1,666,448 | 16.82 | 38,895 | 14.32 | ||||
| 2025-07-14 | 13F | Parkshore Wealth Management, Inc. | 11,170 | -45.59 | 261 | -46.83 | ||||
| 2025-08-15 | 13F | CI Private Wealth, LLC | 9,729 | 227 | ||||||
| 2025-04-25 | 13F | Avidian Wealth Solutions, LLC | 0 | -100.00 | 0 | |||||
| 2025-07-23 | 13F | Steel Peak Wealth Management LLC | 120,397 | 6.84 | 2,810 | 4.58 | ||||
| 2025-08-14 | 13F | Fmr Llc | 69,951 | -65.84 | 1,633 | -66.58 | ||||
| 2025-07-14 | 13F | Sweeney & Michel, Llc | 20,000 | -9.09 | 464 | -7.21 | ||||
| 2025-07-11 | 13F | Farther Finance Advisors, LLC | 8,100 | 0.00 | 189 | -2.58 | ||||
| 2025-08-11 | 13F | GKV Capital Management Co., Inc. | 0 | -100.00 | 0 | -100.00 | ||||
| 2025-08-14 | 13F | Abound Financial, Llc | 0 | -100.00 | 0 | |||||
| 2025-07-09 | 13F | FOCUS Wealth Advisors, LLC | 39,404 | 5.73 | 920 | 3.49 | ||||
| 2025-07-25 | 13F | Lodestar Private Asset Management Llc | 62,801 | -21.35 | 1,466 | -23.06 | ||||
| 2025-08-12 | 13F | LPL Financial LLC | 582,260 | 0.72 | 13,590 | -1.44 | ||||
| 2025-07-29 | 13F | Werba Rubin Papier Wealth Management | 0 | -100.00 | 0 | |||||
| 2025-07-24 | 13F | Williams & Novak, LLC | 39,800 | 5.57 | 929 | 2.54 | ||||
| 2025-07-22 | 13F | McNaughton Wealth Management, LLC | 84,576 | 26.34 | 1,974 | 23.68 | ||||
| 2025-08-08 | 13F | Larson Financial Group LLC | 2,650 | 0.00 | 62 | -3.17 | ||||
| 2025-08-12 | 13F | Waddell & Associates, Llc | 14,125 | 0.00 | 330 | -2.08 | ||||
| 2025-07-11 | 13F | Myecfo, Llc | 0 | -100.00 | 0 | |||||
| 2025-07-09 | 13F | Affinity Capital Advisors, LLC | 53,170 | -71.99 | 1,241 | -71.48 | ||||
| 2025-07-31 | 13F | Wealthfront Advisers Llc | 5,171,896 | 3,414.50 | 120,712 | 3,340.07 | ||||
| 2025-07-31 | 13F | Cambridge Investment Research Advisors, Inc. | 47,378 | -9.32 | 1 | 0.00 | ||||
| 2025-08-04 | 13F | Keybank National Association/oh | 117,570 | 4.75 | 2,744 | 2.54 | ||||
| 2025-08-11 | 13F | Root Financial Partners, LLC | 10,240 | 239 | ||||||
| 2025-08-14 | 13F | Mercer Global Advisors Inc /adv | 1,667,055 | 15.82 | 38,909 | 13.34 | ||||
| 2025-08-08 | 13F | Omega Financial Group, LLC | 25,044 | 0.56 | 585 | -1.52 | ||||
| 2025-06-23 | NP | SRCMX - California Municipal Fund Class A | 500 | 0.00 | 12 | -8.33 | ||||
| 2025-09-04 | 13F/A | Advisor Group Holdings, Inc. | 60,698 | 382.73 | 1,417 | 373.58 | ||||
| 2025-08-05 | 13F | Tme Financial, Inc. | 12,375 | -35.77 | 289 | -37.25 | ||||
| 2025-08-07 | 13F | Allworth Financial LP | 134,636 | -27.65 | 3,142 | -27.62 | ||||
| 2025-08-26 | 13F | Nautilus Advisors LLC | 37,520 | 0.00 | 876 | -2.13 | ||||
| 2025-08-07 | 13F | Hennion & Walsh Asset Management, Inc. | 40,803 | 21.58 | 952 | 19.00 | ||||
| 2025-08-13 | 13F | Kayne Anderson Rudnick Investment Management Llc | 11,405 | 266 | ||||||
| 2025-04-17 | 13F | Cliftonlarsonallen Wealth Advisors, Llc | 0 | -100.00 | 0 | |||||
| 2025-05-15 | 13F | Tower Research Capital LLC (TRC) | 0 | -100.00 | 0 | |||||
| 2025-08-08 | 13F | Laurel Wealth Planning LLC | 9,749 | -5.24 | 228 | -7.35 | ||||
| 2025-07-21 | 13F | Impact Investors, Inc | 81,431 | -8.58 | 1,901 | -10.55 | ||||
| 2025-08-13 | 13F | EverSource Wealth Advisors, LLC | 1,238 | 0.90 | 29 | -3.45 | ||||
| 2025-08-11 | 13F | First American Trust, Fsb | 262,226 | -19.25 | 6,120 | -20.98 | ||||
| 2025-08-13 | 13F | Fisher Asset Management, LLC | 26,000 | 0.00 | 607 | -2.26 | ||||
| 2025-05-15 | 13F | GWM Advisors LLC | 0 | -100.00 | 0 | -100.00 | ||||
| 2025-08-12 | 13F | Journey Strategic Wealth Llc | 24,275 | -67.73 | 567 | -68.45 | ||||
| 2025-07-21 | 13F | Ameriflex Group, Inc. | 1,499 | 0.00 | 35 | -2.86 | ||||
| 2025-08-07 | 13F | Shared Vision Wealth Group LLC | 18,309 | 419 | ||||||
| 2025-08-06 | 13F | Atlas Legacy Advisors, LLC | 17,663 | -96.03 | 412 | -96.13 | ||||
| 2025-08-14 | 13F | Raymond James Financial Inc | 17,903 | -29.33 | 418 | -30.96 | ||||
| 2025-08-13 | 13F | Townsquare Capital Llc | 0 | -100.00 | 0 | |||||
| 2025-08-14 | 13F | Syon Capital Llc | 1,351,618 | 28.95 | 31,547 | 26.19 | ||||
| 2025-07-31 | 13F | Brighton Jones Llc | 0 | -100.00 | 0 | |||||
| 2025-08-15 | 13F | Morgan Stanley | 616,353 | -3.67 | 14,386 | -5.73 | ||||
| 2025-07-24 | 13F | IFP Advisors, Inc | 287 | 0.00 | 7 | 0.00 | ||||
| 2025-07-08 | 13F | Parallel Advisors, LLC | 40 | 0.00 | 1 | |||||
| 2025-08-06 | 13F | Climber Capital SA | 16,395 | 0.00 | 381 | 13.10 | ||||
| 2025-08-13 | 13F | Jones Financial Companies Lllp | 42,338 | 212.27 | 985 | 205.90 | ||||
| 2025-08-14 | 13F | Stifel Financial Corp | 17,416 | -23.82 | 406 | -25.50 | ||||
| 2025-08-13 | 13F | Guggenheim Capital Llc | 282,428 | 66.74 | 6,592 | 63.18 | ||||
| 2025-08-13 | 13F | WCG Wealth Advisors LLC | 11,204 | 262 | ||||||
| 2025-08-14 | 13F | Destination Wealth Management | 35,256 | 0.00 | 823 | -2.14 | ||||
| 2025-08-14 | 13F | Jane Street Group, Llc | 489,526 | 82.27 | 11,426 | 78.38 | ||||
| 2025-07-22 | 13F | Miracle Mile Advisors, LLC | 2,569,651 | 1.94 | 59,976 | -0.24 | ||||
| 2025-08-13 | 13F | Flow Traders U.s. Llc | 0 | -100.00 | 0 | |||||
| 2025-07-28 | 13F | WealthPlan Investment Management, LLC | 23,996 | 560 | ||||||
| 2025-08-14 | 13F | EP Wealth Advisors, Inc. | 834,086 | -3.84 | 19,468 | -5.90 | ||||
| 2025-08-14 | 13F | Smartleaf Asset Management LLC | 1 | 0.00 | 0 | |||||
| 2025-07-21 | 13F | Ameritas Advisory Services, LLC | 0 | -100.00 | 0 | |||||
| 2025-07-30 | 13F | Clifford Swan Investment Counsel Llc | 10,300 | 0.00 | 240 | -2.04 | ||||
| 2025-08-14 | 13F | Integrated Wealth Concepts LLC | 38,594 | 6.26 | 901 | 3.93 | ||||
| 2025-08-14 | 13F | Mariner, LLC | 151,990 | 17.58 | 3,547 | 15.09 | ||||
| 2025-08-08 | 13F | Avantax Advisory Services, Inc. | 16,332 | -1.72 | 381 | -3.79 | ||||
| 2025-08-14 | 13F | Ameriprise Financial Inc | 75,445 | -80.99 | 1,761 | -81.44 | ||||
| 2025-08-14 | 13F | Susquehanna International Group, Llp | 10,164 | -97.04 | 237 | -97.10 | ||||
| 2025-08-14 | 13F | C M Bidwell & Associates Ltd | 22,132 | 0.00 | 517 | -2.09 | ||||
| 2025-08-14 | 13F | Citadel Advisors Llc | Call | 44,500 | 244.96 | 1,039 | 238.11 | |||
| 2025-08-11 | 13F | Amara Financial, Llc. | 0 | -100.00 | 0 | |||||
| 2025-08-14 | 13F | Citadel Advisors Llc | 51,652 | -22.15 | 1,206 | -23.83 | ||||
| 2025-08-14 | 13F | Atomi Financial Group, Inc. | 64,646 | 47.76 | 1,509 | 44.58 | ||||
| 2025-08-14 | 13F | Citadel Advisors Llc | Put | 18,600 | 434 | |||||
| 2025-07-17 | 13F | Keystone Global Partners, LLC | 0 | -100.00 | 0 | |||||
| 2025-08-11 | 13F | Tidemark, LLC | 0 | -100.00 | 0 | |||||
| 2025-08-13 | 13F | Twin Peaks Wealth Advisors, LLC | 10,106 | 0.00 | 234 | -0.85 | ||||
| 2025-08-14 | 13F | Gerber Kawasaki Wealth & Investment Management | 1,219,896 | -7.08 | 28,472 | -9.07 | ||||
| 2025-07-24 | 13F | Robertson Stephens Wealth Management, LLC | 23,848 | 0.00 | 557 | -2.11 | ||||
| 2025-08-14 | 13F | Foronjy Financial Llc | 9,851 | 230 | ||||||
| 2025-08-04 | 13F | Creative Financial Designs Inc /adv | 3,000 | 0.00 | 70 | -1.41 | ||||
| 2025-08-14 | 13F | Quantinno Capital Management LP | 28,144 | 657 | ||||||
| 2025-07-29 | 13F | Stratos Wealth Partners, LTD. | 1,830,367 | 2.08 | 42,721 | -0.10 | ||||
| 2025-07-14 | 13F | GAMMA Investing LLC | 12,129 | -38.47 | 283 | -39.79 | ||||
| 2025-08-12 | 13F | Ameritas Investment Partners, Inc. | 3,241 | 0.46 | 76 | -1.32 | ||||
| 2025-08-14 | 13F | Comerica Bank | 8,395 | 0.00 | 196 | -2.50 | ||||
| 2025-07-14 | 13F | S.A. Mason LLC | 1,300 | 0.00 | 30 | -3.23 | ||||
| 2025-08-06 | 13F | Commonwealth Equity Services, Llc | 91,809 | 67.72 | 2 | 100.00 | ||||
| 2025-07-18 | 13F | Pure Financial Advisors, Inc. | 304,528 | 402.70 | 7,108 | 392.17 | ||||
| 2025-08-14 | 13F | Warren Averett Asset Management, LLC | 0 | -100.00 | 0 | |||||
| 2025-08-27 | 13F/A | Brinker Capital Investments, LLC | 86,562 | -6.64 | 2,020 | -8.64 | ||||
| 2025-08-11 | 13F | FSA Wealth Management LLC | 592 | 14 | ||||||
| 2025-07-24 | 13F | Us Bancorp \de\ | 2,055 | 0.00 | 48 | -4.08 | ||||
| 2025-08-12 | 13F | Main Management LLC | 4,705 | -0.84 | 0 | |||||
| 2025-07-07 | 13F | Versant Capital Management, Inc | 370 | 0.00 | 9 | 0.00 | ||||
| 2025-05-15 | 13F | Old Mission Capital Llc | 0 | -100.00 | 0 | -100.00 | ||||
| 2025-07-22 | 13F | Hill Island Financial Llc | 8,858 | 0.29 | 207 | -1.90 | ||||
| 2025-08-13 | 13F | Cerity Partners LLC | 0 | -100.00 | 0 | |||||
| 2025-08-11 | 13F | Elequin Capital Lp | 0 | -100.00 | 0 | |||||
| 2025-08-15 | 13F | Equitable Holdings, Inc. | 20,851 | -33.76 | 487 | -35.20 | ||||
| 2025-07-21 | 13F | Mattern Capital Management, Llc | 29,340 | 4.26 | 685 | 1.94 | ||||
| 2025-07-14 | 13F | Southland Equity Partners LLC | 9,950 | 0.00 | 232 | -2.11 | ||||
| 2025-08-06 | 13F | Golden State Wealth Management, LLC | 1,821 | 0.00 | 43 | -2.33 | ||||
| 2025-07-22 | 13F | Verus Wealth Management, Llc | 0 | -100.00 | 0 | |||||
| 2025-08-11 | 13F | HighTower Advisors, LLC | 63,159 | 1.89 | 1,474 | -0.27 | ||||
| 2025-08-14 | 13F | Bank Of America Corp /de/ | 698,813 | -18.66 | 16,310 | -20.40 | ||||
| 2025-08-12 | 13F | NWF Advisory Services Inc. | 23,151 | -43.06 | 552 | -45.02 | ||||
| 2025-08-08 | 13F | Cetera Investment Advisers | 20,568 | 5.30 | 480 | 3.23 | ||||
| 2025-07-22 | 13F | Wealthcare Advisory Partners LLC | 0 | -100.00 | 0 | |||||
| 2025-08-11 | 13F | Greykasell Wealth Strategies, Inc. | 43,108 | 0.99 | 1,006 | -1.18 | ||||
| 2025-04-22 | 13F | Spinnaker Investment Group, LLC | 0 | -100.00 | 0 | |||||
| 2025-08-11 | 13F | NewEdge Wealth, LLC | 0 | -100.00 | 0 | |||||
| 2025-08-12 | 13F | Charles Schwab Investment Management Inc | 0 | -100.00 | 0 | |||||
| 2025-07-24 | 13F | Certus Wealth Management, LLC | 17,309 | 404 | ||||||
| 2025-08-12 | 13F | Proequities, Inc. | 0 | 0 | ||||||
| 2025-08-14 | 13F | Wells Fargo & Company/mn | 223,209 | -31.58 | 5,210 | -33.05 |