Basic Stats
| Institutional Owners | 66 total, 66 long only, 0 short only, 0 long/short - change of 3.08% MRQ |
| Average Portfolio Allocation | 0.4324 % - change of 0.75% MRQ |
| Institutional Shares (Long) | 14,462,771 (ex 13D/G) - change of -0.18MM shares -1.20% MRQ |
| Institutional Value (Long) | $ 272,595 USD ($1000) |
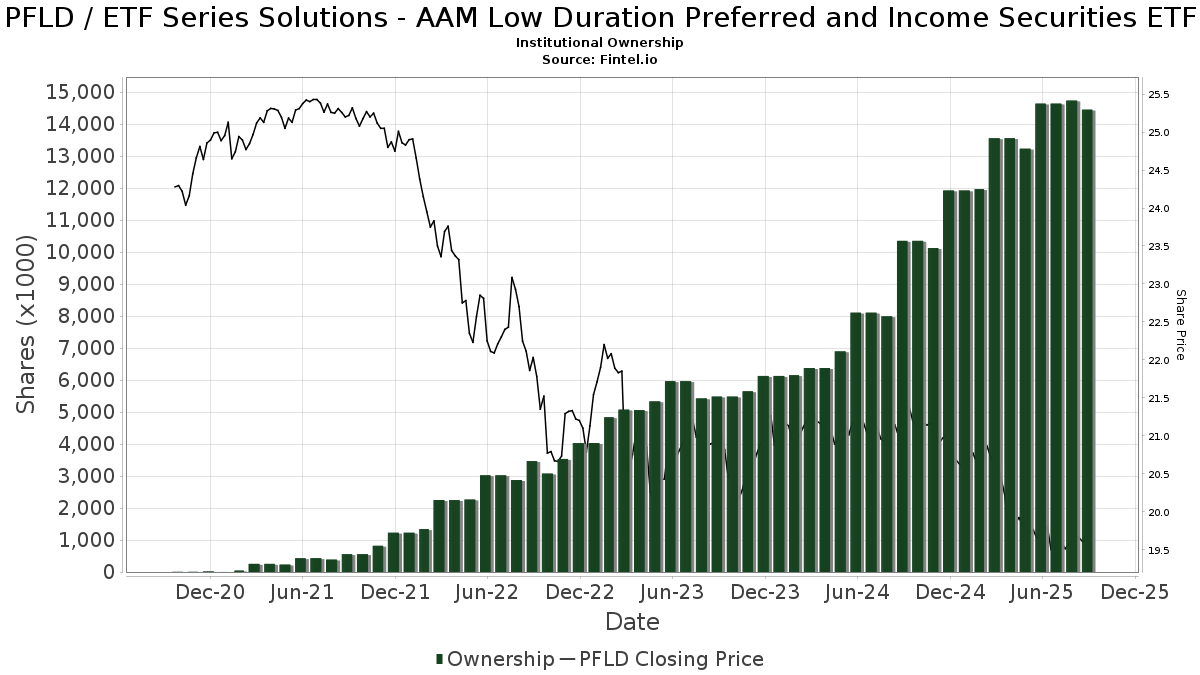
Institutional Ownership and Shareholders
ETF Series Solutions - AAM Low Duration Preferred and Income Securities ETF (US:PFLD) has 66 institutional owners and shareholders that have filed 13D/G or 13F forms with the Securities Exchange Commission (SEC). These institutions hold a total of 14,462,771 shares. Largest shareholders include Morgan Stanley, Wells Fargo & Company/mn, LPL Financial LLC, Rainey & Randall Investment Management Inc., Raymond James Financial Inc, Advisor Group Holdings, Inc., Royal Bank Of Canada, Cambridge Investment Research Advisors, Inc., YFYA - Yields for You Income Strategy A ETF, and Sound Income Strategies, LLC .
ETF Series Solutions - AAM Low Duration Preferred and Income Securities ETF (ARCA:PFLD) institutional ownership structure shows current positions in the company by institutions and funds, as well as latest changes in position size. Major shareholders can include individual investors, mutual funds, hedge funds, or institutions. The Schedule 13D indicates that the investor holds (or held) more than 5% of the company and intends (or intended) to actively pursue a change in business strategy. Schedule 13G indicates a passive investment of over 5%.
The share price as of September 5, 2025 is 19.72 / share. Previously, on September 9, 2024, the share price was 21.10 / share. This represents a decline of 6.54% over that period.
Fund Sentiment Score
The Fund Sentiment Score (fka Ownership Accumulation Score) finds the stocks that are being most bought by funds. It is the result of a sophisticated, multi-factor quantitative model that identifies companies with the highest levels of institutional accumulation. The scoring model uses a combination of the total increase in disclosed owners, the changes in portfolio allocations in those owners and other metrics. The number ranges from 0 to 100, with higher numbers indicating a higher level of accumulation to its peers, and 50 being the average.
Update Frequency: Daily
See Ownership Explorer, which provides a list of highest-ranking companies.
Institutional Put/Call Ratio
In addition to reporting standard equity and debt issues, institutions with more than 100MM assets under management must also disclose their put and call option holdings. Since put options generally indicate negative sentiment, and call options indicate positive sentiment, we can get a sense of the overall institutional sentiment by plotting the ratio of puts to calls. The chart to the right plots the historical put/call ratio for this instrument.
Using Put/Call Ratio as an indicator of investor sentiment overcomes one of the key deficiencies of using total institutional ownership, which is that a significant amount of assets under management are invested passively to track indices. Passively-managed funds do not typically buy options, so the put/call ratio indicator more closely tracks the sentiment of actively-managed funds.
13F and NPORT Filings
Detail on 13F filings are free. Detail on NP filings require a premium membership. Green rows indicate new positions. Red rows indicate closed positions. Click the link icon to see the full transaction history.
Upgrade
to unlock premium data and export to Excel ![]() .
.
| File Date | Source | Investor | Type | Avg Price (Est) |
Shares | Δ Shares (%) |
Reported Value ($1000) |
Δ Value (%) |
Port Alloc (%) |
|
|---|---|---|---|---|---|---|---|---|---|---|
| 2025-08-14 | 13F | GWM Advisors LLC | 449 | 0.00 | 9 | -11.11 | ||||
| 2025-09-04 | 13F/A | Advisor Group Holdings, Inc. | 406,147 | 23.95 | 7,965 | 20.32 | ||||
| 2025-07-24 | 13F | IFP Advisors, Inc | 48,686 | 0.83 | 955 | -2.15 | ||||
| 2025-08-28 | NP | YFYA - Yields for You Income Strategy A ETF | 267,749 | 3.01 | 5,251 | 0.00 | ||||
| 2025-08-12 | 13F | Gladstone Institutional Advisory LLC | 15,981 | -69.91 | 313 | -70.80 | ||||
| 2025-08-12 | 13F | Global Retirement Partners, LLC | 133 | 3 | ||||||
| 2025-08-12 | 13F | Proequities, Inc. | 0 | 0 | ||||||
| 2025-08-11 | 13F | Principal Securities, Inc. | 20,867 | 44.31 | 409 | 37.71 | ||||
| 2025-07-30 | 13F | Bleakley Financial Group, LLC | 122,398 | 17.77 | 2,400 | 14.34 | ||||
| 2025-05-12 | 13F | Fmr Llc | 0 | -100.00 | 0 | |||||
| 2025-05-14 | 13F | Mml Investors Services, Llc | 0 | -100.00 | 0 | |||||
| 2025-07-17 | 13F | HB Wealth Management, LLC | 0 | -100.00 | 0 | |||||
| 2025-08-08 | 13F | Rockefeller Capital Management L.P. | 0 | -100.00 | 0 | |||||
| 2025-08-08 | 13F | Foundations Investment Advisors, LLC | 11,253 | 221 | ||||||
| 2025-05-06 | 13F | AE Wealth Management LLC | 0 | -100.00 | 0 | |||||
| 2025-08-01 | 13F | Envestnet Asset Management Inc | 77,173 | 16.04 | 1,513 | 12.66 | ||||
| 2025-08-19 | 13F | Advisory Services Network, LLC | 0 | -100.00 | 0 | |||||
| 2025-08-08 | 13F | Creative Planning | 16,800 | 0.00 | 329 | -2.95 | ||||
| 2025-08-12 | 13F | NWF Advisory Services Inc. | 13,051 | -1.02 | 264 | -3.66 | ||||
| 2025-08-11 | 13F | Hexagon Capital Partners LLC | 0 | -100.00 | 0 | |||||
| 2025-08-07 | 13F | Allworth Financial LP | 533 | 0.00 | 10 | 0.00 | ||||
| 2025-08-12 | 13F | Blueprint Investment Partners LLC | 0 | -100.00 | 0 | |||||
| 2025-08-14 | 13F | Gotham Asset Management, LLC | 113,924 | 89.60 | 2,234 | 84.17 | ||||
| 2025-08-14 | 13F | CoreCap Advisors, LLC | 100 | 0.00 | 2 | -50.00 | ||||
| 2025-07-25 | 13F | Cwm, Llc | 50 | 0 | ||||||
| 2025-07-07 | 13F | Thurston, Springer, Miller, Herd & Titak, Inc. | 8,292 | 0.00 | 163 | -2.99 | ||||
| 2025-08-12 | 13F | Cornerstone Wealth Management, LLC | 12,250 | -10.94 | 240 | -13.36 | ||||
| 2025-08-12 | 13F | Steward Partners Investment Advisory, Llc | 15,404 | -2.39 | 302 | -5.03 | ||||
| 2025-07-17 | 13F | Janney Montgomery Scott LLC | 89,316 | 4.59 | 2 | 0.00 | ||||
| 2025-08-07 | 13F | CSM Advisors, LLC | 25,000 | 0.00 | 0 | |||||
| 2025-08-14 | 13F | Royal Bank Of Canada | 354,838 | -17.22 | 6,959 | -19.63 | ||||
| 2025-07-25 | 13F | Atria Wealth Solutions, Inc. | 15,903 | -12.96 | 314 | -15.63 | ||||
| 2025-08-07 | 13F | Curtis Advisory Group, LLC | 134,624 | 0.00 | 2,640 | -2.94 | ||||
| 2025-05-05 | 13F | Transce3nd, LLC | 0 | -100.00 | 0 | |||||
| 2025-08-14 | 13F | Goldman Sachs Group Inc | 20,808 | 408 | ||||||
| 2025-07-15 | 13F | Oregon Pacific Wealth Management, LLC | 18,985 | -3.46 | 372 | -6.30 | ||||
| 2025-07-09 | 13F | Massmutual Trust Co Fsb/adv | 2,097 | 41 | ||||||
| 2025-08-14 | 13F | Susquehanna International Group, Llp | 0 | -100.00 | 0 | |||||
| 2025-07-17 | 13F | Sound Income Strategies, LLC | 258,113 | -0.93 | 5,062 | -3.82 | ||||
| 2025-05-15 | 13F | National Wealth Management Group, LLC | 37,373 | 15.98 | 755 | 13.90 | ||||
| 2025-08-15 | 13F | Morgan Stanley | 5,158,182 | -9.20 | 101,152 | -11.86 | ||||
| 2025-08-06 | 13F | Wedbush Securities Inc | 39,575 | 11.71 | 1 | |||||
| 2025-08-14 | 13F | Citadel Advisors Llc | 27,813 | 545 | ||||||
| 2025-08-14 | 13F | Stifel Financial Corp | 170,215 | -40.29 | 3,338 | -42.05 | ||||
| 2025-07-21 | 13F | Ameritas Advisory Services, LLC | 26,883 | 18.62 | 527 | 13.33 | ||||
| 2025-04-10 | 13F | Key Client Fiduciary Advisors, LLC | 0 | -100.00 | 0 | |||||
| 2025-08-08 | 13F | Kingsview Wealth Management, LLC | 10,564 | -3.74 | 207 | -6.33 | ||||
| 2025-07-31 | 13F | Cambridge Investment Research Advisors, Inc. | 287,444 | -4.40 | 6 | -16.67 | ||||
| 2025-08-05 | 13F | Bank Of Montreal /can/ | 10,000 | 0.00 | 196 | -2.97 | ||||
| 2025-08-14 | 13F | Raymond James Financial Inc | 585,692 | -0.05 | 11,485 | -2.97 | ||||
| 2025-08-15 | 13F | Prevail Innovative Wealth Advisors, Llc | 83,901 | 0.14 | 1,645 | -2.78 | ||||
| 2025-08-14 | 13F | Warren Averett Asset Management, LLC | 0 | -100.00 | 0 | |||||
| 2025-08-14 | 13F | Comerica Bank | 14,901 | -17.38 | 292 | -19.78 | ||||
| 2025-08-14 | 13F | UBS Group AG | 48,041 | 942 | ||||||
| 2025-08-20 | 13F/A | Coppell Advisory Solutions LLC | 54,875 | -27.58 | 1,076 | -28.81 | ||||
| 2025-08-14 | 13F | Integrated Wealth Concepts LLC | 14,124 | 0.89 | 277 | -2.13 | ||||
| 2025-07-10 | 13F | Wealth Enhancement Advisory Services, Llc | 164,770 | 79.82 | 3,223 | 74.16 | ||||
| 2025-08-14 | 13F | Wells Fargo & Company/mn | 2,651,784 | 16.81 | 52,001 | 13.40 | ||||
| 2025-08-14 | 13F | Hilltop Holdings Inc. | 11,752 | 1.21 | 230 | -1.71 | ||||
| 2025-08-08 | 13F | Avantax Advisory Services, Inc. | 116,691 | -7.57 | 2,288 | -10.27 | ||||
| 2025-07-08 | 13F | Webster Bank, N. A. | 735 | 0.00 | 14 | 0.00 | ||||
| 2025-08-07 | 13F | Kestra Private Wealth Services, Llc | 43,307 | 57.63 | 849 | 53.25 | ||||
| 2025-08-14 | 13F | AllSquare Wealth Management LLC | 193,375 | -1.54 | 3,792 | -4.41 | ||||
| 2025-07-25 | 13F | Apollon Wealth Management, LLC | 36,224 | 2.28 | 710 | -0.70 | ||||
| 2025-07-10 | 13F | Global Financial Private Client, LLC | 22,212 | 436 | ||||||
| 2025-07-30 | 13F | Cullen/frost Bankers, Inc. | 7,410 | 145 | ||||||
| 2025-08-06 | 13F | Commonwealth Equity Services, Llc | 124,848 | 7.95 | 2 | 0.00 | ||||
| 2025-08-12 | 13F | LPL Financial LLC | 1,195,922 | -3.71 | 23,452 | -6.52 | ||||
| 2025-07-29 | 13F | Private Trust Co Na | 13,369 | 3.89 | 262 | 1.16 | ||||
| 2025-07-17 | 13F | Fiduciary Advisors, Inc. | 2,751 | 1.85 | 54 | -1.85 | ||||
| 2025-07-21 | 13F | Rainey & Randall Investment Management Inc. | 671,076 | 0.13 | 13,240 | -2.78 | ||||
| 2025-08-14 | 13F | Mariner, LLC | 103,553 | 12.01 | 2,031 | 8.73 | ||||
| 2025-08-08 | 13F | Cetera Investment Advisers | 158,268 | -8.55 | 3,104 | -11.22 | ||||
| 2025-08-14 | 13F | TCG Advisory Services, LLC | 24,012 | 0.60 | 471 | -2.49 | ||||
| 2025-08-12 | 13F | J.w. Cole Advisors, Inc. | 24,038 | -6.01 | 471 | -8.72 | ||||
| 2025-08-15 | 13F | Captrust Financial Advisors | 166,055 | 0.62 | 3,256 | -2.31 | ||||
| 2025-07-17 | 13F | Alpine Bank Wealth Management | 5,185 | 102 | ||||||
| 2025-08-11 | 13F | Private Advisor Group, LLC | 11,061 | -34.49 | 217 | -36.66 | ||||
| 2025-04-28 | 13F | Strategic Financial Concepts, LLC | 0 | -100.00 | 0 | -100.00 | ||||
| 2025-08-15 | 13F | Kestra Advisory Services, LLC | 73,866 | 23.03 | 1,449 | 19.47 | ||||
| 2025-08-12 | 13F | Jpmorgan Chase & Co | 0 | 0 |