Basic Stats
| Institutional Owners | 70 total, 70 long only, 0 short only, 0 long/short - change of 1.45% MRQ |
| Average Portfolio Allocation | 0.3837 % - change of -5.18% MRQ |
| Institutional Shares (Long) | 4,351,051 (ex 13D/G) - change of -0.40MM shares -8.39% MRQ |
| Institutional Value (Long) | $ 201,617 USD ($1000) |
Institutional Ownership and Shareholders
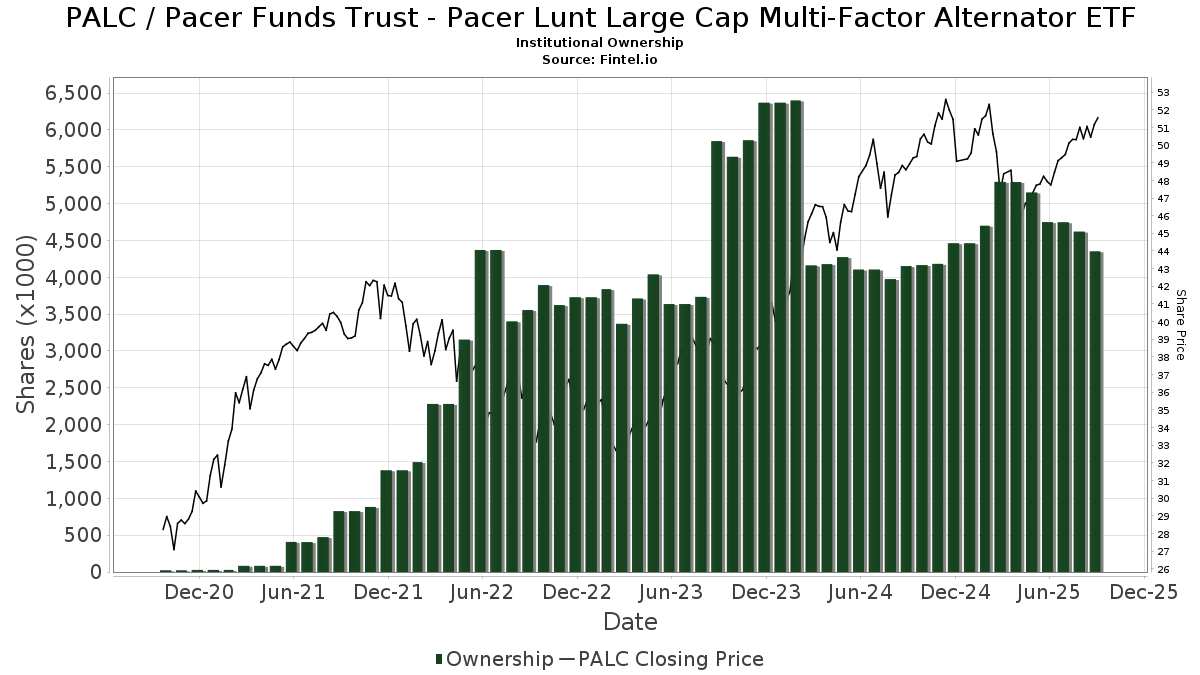
Pacer Funds Trust - Pacer Lunt Large Cap Multi-Factor Alternator ETF (US:PALC) has 70 institutional owners and shareholders that have filed 13D/G or 13F forms with the Securities Exchange Commission (SEC). These institutions hold a total of 4,351,051 shares. Largest shareholders include Ameriprise Financial Inc, Northwestern Mutual Wealth Management Co, Geneos Wealth Management Inc., Lunt Capital Management, Inc., Enzi Wealth, Financial Enhancement Group LLC, Cambridge Investment Research Advisors, Inc., Ergawealth Advisors, Inc., Centric Wealth Management, and LPL Financial LLC .
Pacer Funds Trust - Pacer Lunt Large Cap Multi-Factor Alternator ETF (ARCA:PALC) institutional ownership structure shows current positions in the company by institutions and funds, as well as latest changes in position size. Major shareholders can include individual investors, mutual funds, hedge funds, or institutions. The Schedule 13D indicates that the investor holds (or held) more than 5% of the company and intends (or intended) to actively pursue a change in business strategy. Schedule 13G indicates a passive investment of over 5%.
The share price as of September 5, 2025 is 50.57 / share. Previously, on September 9, 2024, the share price was 48.55 / share. This represents an increase of 4.16% over that period.
Fund Sentiment Score
The Fund Sentiment Score (fka Ownership Accumulation Score) finds the stocks that are being most bought by funds. It is the result of a sophisticated, multi-factor quantitative model that identifies companies with the highest levels of institutional accumulation. The scoring model uses a combination of the total increase in disclosed owners, the changes in portfolio allocations in those owners and other metrics. The number ranges from 0 to 100, with higher numbers indicating a higher level of accumulation to its peers, and 50 being the average.
Update Frequency: Daily
See Ownership Explorer, which provides a list of highest-ranking companies.
Institutional Put/Call Ratio
In addition to reporting standard equity and debt issues, institutions with more than 100MM assets under management must also disclose their put and call option holdings. Since put options generally indicate negative sentiment, and call options indicate positive sentiment, we can get a sense of the overall institutional sentiment by plotting the ratio of puts to calls. The chart to the right plots the historical put/call ratio for this instrument.
Using Put/Call Ratio as an indicator of investor sentiment overcomes one of the key deficiencies of using total institutional ownership, which is that a significant amount of assets under management are invested passively to track indices. Passively-managed funds do not typically buy options, so the put/call ratio indicator more closely tracks the sentiment of actively-managed funds.
13F and NPORT Filings
Detail on 13F filings are free. Detail on NP filings require a premium membership. Green rows indicate new positions. Red rows indicate closed positions. Click the link icon to see the full transaction history.
Upgrade
to unlock premium data and export to Excel ![]() .
.
| File Date | Source | Investor | Type | Avg Price (Est) |
Shares | Δ Shares (%) |
Reported Value ($1000) |
Δ Value (%) |
Port Alloc (%) |
|
|---|---|---|---|---|---|---|---|---|---|---|
| 2025-08-15 | 13F | Kestra Advisory Services, LLC | 88,394 | -0.71 | 4,367 | 2.30 | ||||
| 2025-08-04 | 13F | Pensionmark Financial Group, Llc | 63,722 | -2.05 | 3,148 | 0.90 | ||||
| 2025-07-22 | 13F | Ergawealth Advisors, Inc. | 201,666 | -2.90 | 9,962 | 0.04 | ||||
| 2025-08-01 | 13F | Brookwood Investment Group LLC | 4,144 | 205 | ||||||
| 2025-07-24 | 13F | IFP Advisors, Inc | 2,190 | 338.00 | 108 | 468.42 | ||||
| 2025-08-14 | 13F | GWM Advisors LLC | 231 | 0.00 | 11 | 0.00 | ||||
| 2025-05-13 | 13F | Wells Fargo & Company/mn | 0 | -100.00 | 0 | |||||
| 2025-07-14 | 13F | Financial Enhancement Group LLC | 245,831 | 0.26 | 12,124 | 7.35 | ||||
| 2025-03-21 | 13F | Prostatis Group LLC | 0 | -100.00 | 0 | -100.00 | ||||
| 2025-07-15 | 13F | Unified Investment Management | 11,849 | 0.01 | 585 | 2.99 | ||||
| 2025-08-01 | 13F | Envestnet Asset Management Inc | 9,376 | -0.77 | 463 | 2.21 | ||||
| 2025-07-28 | 13F | Lunt Capital Management, Inc. | 262,935 | 1.06 | 12,989 | 4.13 | ||||
| 2025-08-05 | 13F | Sigma Planning Corp | 4,675 | 231 | ||||||
| 2025-07-15 | 13F | Armis Advisers, LLC | 161,192 | 4.75 | 7,963 | 7.93 | ||||
| 2025-07-22 | 13F | Belpointe Asset Management LLC | 31,303 | -7.02 | 1,546 | -4.21 | ||||
| 2025-05-15 | 13F | Captrust Financial Advisors | 0 | -100.00 | 0 | |||||
| 2025-05-22 | 13F | Wbi Investments, Inc. | 0 | -100.00 | 0 | |||||
| 2025-05-14 | 13F | Change Path, LLC | 0 | -100.00 | 0 | |||||
| 2025-08-08 | 13F | Cetera Investment Advisers | 22,919 | -9.11 | 1,132 | -6.37 | ||||
| 2025-07-28 | 13F | Harbour Investments, Inc. | 3,174 | -34.30 | 157 | -32.47 | ||||
| 2025-08-14 | 13F | Glen Eagle Advisors, LLC | 831 | 0.24 | 41 | 5.13 | ||||
| 2025-07-25 | 13F | Cwm, Llc | 439 | -12.90 | 0 | |||||
| 2025-08-14 | 13F | Chicago Wealth Management, Inc. | 8,481 | -2.06 | 419 | 0.72 | ||||
| 2025-07-15 | 13F | Clarus Group, Inc. | 14,576 | 0.00 | 720 | 3.15 | ||||
| 2025-08-14 | 13F | Raymond James Financial Inc | 32,828 | -67.01 | 1,622 | -66.02 | ||||
| 2025-08-18 | 13F | Geneos Wealth Management Inc. | 298,698 | 20.07 | 14,756 | 23.70 | ||||
| 2025-07-25 | 13F | Alpha Financial Partners, LLC | 29,494 | -8.63 | 1,457 | -5.82 | ||||
| 2025-08-12 | 13F | Cornerstone Wealth Management, LLC | 6,450 | 0.06 | 319 | 2.91 | ||||
| 2025-05-07 | 13F | Maridea Wealth Management LLC | 0 | -100.00 | 0 | |||||
| 2025-08-14 | 13F | Citadel Advisors Llc | 0 | -100.00 | 0 | |||||
| 2025-05-16 | 13F/A | Kestra Investment Management, LLC | 0 | -100.00 | 0 | |||||
| 2025-05-14 | 13F | Susquehanna International Group, Llp | 0 | -100.00 | 0 | -100.00 | ||||
| 2025-08-14 | 13F | Gallagher Fiduciary Advisors, LLC | 130,204 | 0.28 | 6,432 | 3.33 | ||||
| 2025-08-14 | 13F | Warren Averett Asset Management, LLC | 18,391 | 26.49 | 909 | 30.27 | ||||
| 2025-08-08 | 13F | Good Life Advisors, LLC | 14,560 | 12.97 | 719 | 16.53 | ||||
| 2025-08-27 | 13F/A | Brinker Capital Investments, LLC | 6,479 | 33.97 | 320 | 38.53 | ||||
| 2025-08-14 | 13F | UBS Group AG | 17,172 | 63.42 | 848 | 68.59 | ||||
| 2025-08-12 | 13F | Proequities, Inc. | 0 | 0 | ||||||
| 2025-07-30 | 13F | Eqis Capital Management, Inc. | 6,905 | -1.16 | 341 | 2.10 | ||||
| 2025-04-18 | 13F | Edge Financial Advisors LLC | 0 | -100.00 | 0 | |||||
| 2025-07-15 | 13F | Palumbo Wealth Management LLC | 21,035 | 2.88 | 1,039 | 6.02 | ||||
| 2025-04-21 | 13F | Clg Llc | 0 | -100.00 | 0 | |||||
| 2025-08-06 | 13F | Commonwealth Equity Services, Llc | 22,533 | -17.25 | 1 | 0.00 | ||||
| 2025-08-12 | 13F | Centric Wealth Management | 195,113 | 1.59 | 9,869 | 7.16 | ||||
| 2025-08-13 | 13F | Northwestern Mutual Wealth Management Co | 359,937 | 8.08 | 17,781 | 11.36 | ||||
| 2025-04-17 | 13F | FNY Investment Advisers, LLC | 0 | -100.00 | 0 | |||||
| 2025-07-17 | 13F | Sound Income Strategies, LLC | 36 | -81.05 | 2 | -88.89 | ||||
| 2025-08-13 | 13F | Flow Traders U.s. Llc | 15,617 | 1 | ||||||
| 2025-08-15 | 13F | Morgan Stanley | 9,363 | -27.99 | 463 | -25.84 | ||||
| 2025-07-31 | 13F | Leavell Investment Management, Inc. | 20,627 | -34.19 | 1,019 | -32.22 | ||||
| 2025-08-14 | 13F | Ausdal Financial Partners, Inc. | 129,937 | 4.97 | 6,417 | 8.14 | ||||
| 2025-07-09 | 13F | Burt Wealth Advisors | 46,544 | 1.72 | 2,299 | 4.83 | ||||
| 2025-09-04 | 13F/A | Advisor Group Holdings, Inc. | 54,008 | 9.84 | 2,668 | 13.19 | ||||
| 2025-05-12 | 13F | Independent Advisor Alliance | 0 | -100.00 | 0 | |||||
| 2025-05-15 | 13F/A | Orion Portfolio Solutions, LLC | 4,836 | -38.08 | 232 | -39.84 | ||||
| 2025-08-04 | 13F | L.m. Kohn & Company | 7,775 | 0.00 | 384 | 3.23 | ||||
| 2025-05-13 | 13F | Aptus Capital Advisors, LLC | 0 | -100.00 | 0 | |||||
| 2025-08-12 | 13F | Steward Partners Investment Advisory, Llc | 2,081 | 0.00 | 103 | 3.03 | ||||
| 2025-07-28 | 13F | Frazier Financial Advisors, LLC | 121 | 0.00 | 6 | 0.00 | ||||
| 2025-08-13 | 13F | Trustmark National Bank Trust Department | 9,000 | 0.00 | 445 | 3.02 | ||||
| 2025-08-14 | 13F | Ameriprise Financial Inc | 422,835 | -22.28 | 20,882 | -20.04 | ||||
| 2025-08-15 | 13F | Equitable Holdings, Inc. | 109,054 | -20.58 | 5,387 | -18.18 | ||||
| 2025-08-14 | 13F | Royal Bank Of Canada | 1,007 | 0.00 | 50 | 4.17 | ||||
| 2025-05-06 | 13F | Avantax Advisory Services, Inc. | 0 | -100.00 | 0 | |||||
| 2025-07-17 | 13F | Financial Designs Corp | 85,395 | -13.80 | 4,219 | -11.20 | ||||
| 2025-08-14 | 13F | Qube Research & Technologies Ltd | 0 | -100.00 | 0 | |||||
| 2025-08-13 | 13F | StoneX Group Inc. | 16,018 | 6.21 | 791 | 9.41 | ||||
| 2025-07-14 | 13F | Enzi Wealth | 257,767 | 0.34 | 12,713 | 6.75 | ||||
| 2025-08-14 | 13F | Goldman Sachs Group Inc | 42,388 | -1.88 | 2,094 | 1.11 | ||||
| 2025-08-19 | 13F | Advisory Services Network, LLC | 43,763 | -50.02 | 2,194 | -47.75 | ||||
| 2025-07-11 | 13F | SILVER OAK SECURITIES, Inc | 58,445 | 0.09 | 2,887 | 3.70 | ||||
| 2025-07-31 | 13F | Cambridge Investment Research Advisors, Inc. | 235,173 | -4.79 | 12 | 0.00 | ||||
| 2025-08-12 | 13F | LPL Financial LLC | 192,035 | -7.40 | 9,487 | -4.60 | ||||
| 2025-08-13 | 13F | GeoWealth Management, LLC | 29,903 | -1.47 | 1,477 | 1.51 | ||||
| 2025-08-29 | 13F | Evolution Wealth Management Inc. | 29 | 1 | ||||||
| 2025-08-08 | 13F | Foundations Investment Advisors, LLC | 27,958 | 208.35 | 1,381 | 218.20 | ||||
| 2025-08-04 | 13F | Atria Investments Llc | 132,837 | -1.10 | 6,562 | 1.89 | ||||
| 2025-08-12 | 13F | Integrated Advisors Network LLC | 8,137 | -40.44 | 402 | -38.78 | ||||
| 2025-05-09 | 13F | Blue Barn Wealth, LLC | 0 | -100.00 | 0 | |||||
| 2025-08-07 | 13F | Allworth Financial LP | 246 | 0.41 | 12 | 9.09 | ||||
| 2025-07-10 | 13F | Wealth Enhancement Advisory Services, Llc | 33,923 | -73.99 | 1,682 | -73.12 | ||||
| 2025-07-18 | 13F | Truist Financial Corp | 6,973 | -6.49 | 344 | -3.64 | ||||
| 2025-08-08 | 13F | Capital Investment Advisory Services, LLC | 8,604 | 11.81 | 425 | 15.49 | ||||
| 2025-08-13 | 13F | Jones Financial Companies Lllp | 0 | -100.00 | 0 | -100.00 | ||||
| 2025-08-14 | 13F | Fmr Llc | 871 | 37.17 | 43 | 43.33 | ||||
| 2025-07-25 | 13F | Atria Wealth Solutions, Inc. | 0 | -100.00 | 0 | |||||
| 2025-08-05 | 13F | Landmark Wealth Management, Inc. | 14,687 | -16.72 | 726 | -14.20 | ||||
| 2025-07-07 | 13F | Centurion Wealth Management LLC | 8,264 | 408 | ||||||
| 2025-08-13 | 13F | EverSource Wealth Advisors, LLC | 166 | 8 | ||||||
| 2025-08-14 | 13F | Jane Street Group, Llc | 16,901 | 96.36 | 835 | 102.43 |