Basic Stats
| Institutional Owners | 53 total, 53 long only, 0 short only, 0 long/short - change of 1.92% MRQ |
| Average Portfolio Allocation | 0.1081 % - change of 35.51% MRQ |
| Institutional Shares (Long) | 4,986,116 (ex 13D/G) - change of 0.96MM shares 23.69% MRQ |
| Institutional Value (Long) | $ 44,687 USD ($1000) |
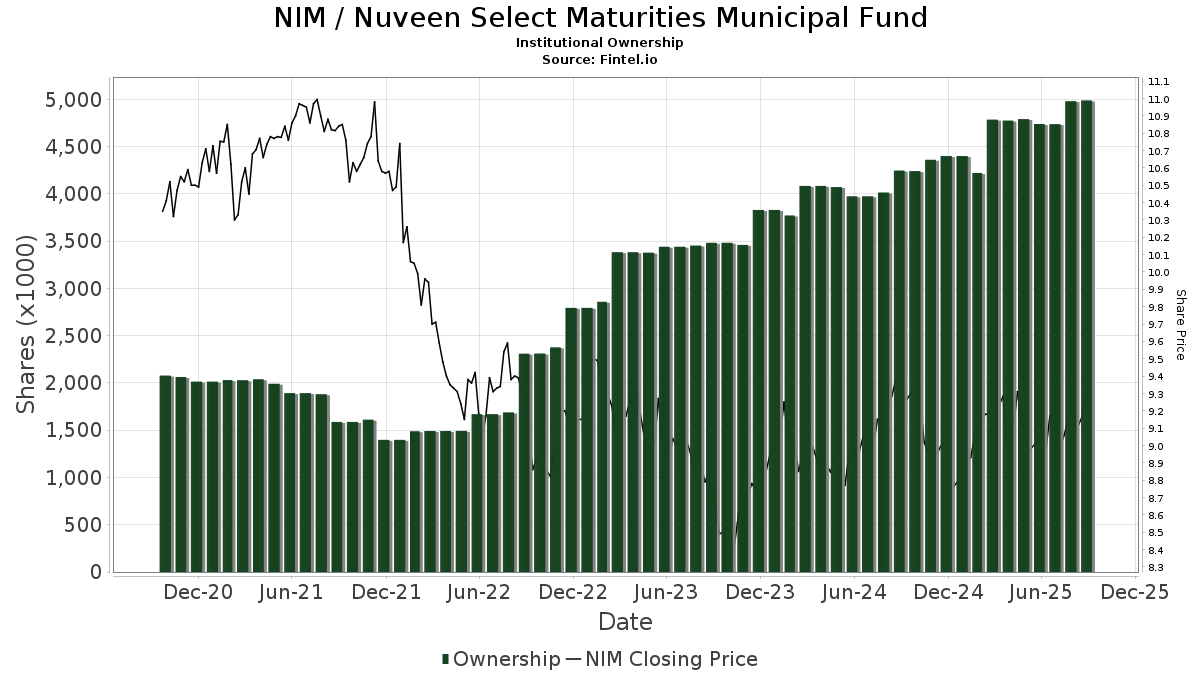
Institutional Ownership and Shareholders
Nuveen Select Maturities Municipal Fund (US:NIM) has 53 institutional owners and shareholders that have filed 13D/G or 13F forms with the Securities Exchange Commission (SEC). These institutions hold a total of 4,986,116 shares. Largest shareholders include 1607 Capital Partners, LLC, Tortoise Investment Management, LLC, Morgan Stanley, Jones Financial Companies Lllp, Guggenheim Capital Llc, Hennion & Walsh Asset Management, Inc., UBS Group AG, Bank Of America Corp /de/, Whipplewood Advisors, LLC, and Blake Schutter Theil Wealth Advisors, LLC .
Nuveen Select Maturities Municipal Fund (NYSE:NIM) institutional ownership structure shows current positions in the company by institutions and funds, as well as latest changes in position size. Major shareholders can include individual investors, mutual funds, hedge funds, or institutions. The Schedule 13D indicates that the investor holds (or held) more than 5% of the company and intends (or intended) to actively pursue a change in business strategy. Schedule 13G indicates a passive investment of over 5%.
The share price as of September 8, 2025 is 9.28 / share. Previously, on September 9, 2024, the share price was 9.35 / share. This represents a decline of 0.78% over that period.
Fund Sentiment Score
The Fund Sentiment Score (fka Ownership Accumulation Score) finds the stocks that are being most bought by funds. It is the result of a sophisticated, multi-factor quantitative model that identifies companies with the highest levels of institutional accumulation. The scoring model uses a combination of the total increase in disclosed owners, the changes in portfolio allocations in those owners and other metrics. The number ranges from 0 to 100, with higher numbers indicating a higher level of accumulation to its peers, and 50 being the average.
Update Frequency: Daily
See Ownership Explorer, which provides a list of highest-ranking companies.
Institutional Put/Call Ratio
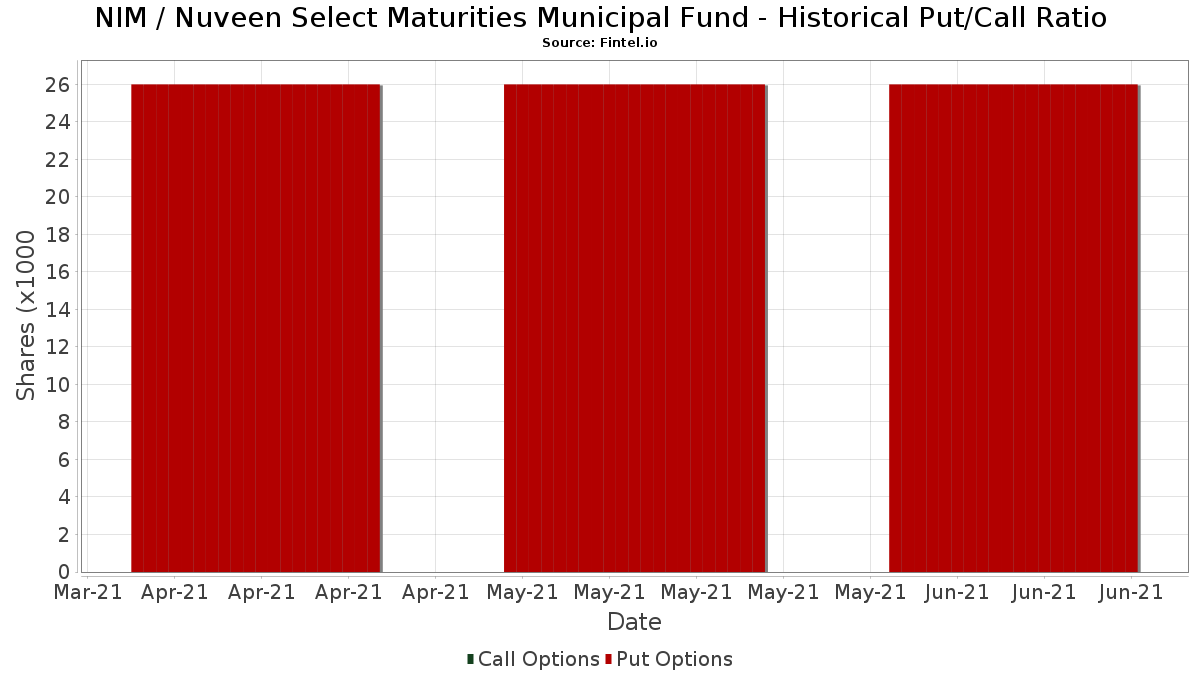
In addition to reporting standard equity and debt issues, institutions with more than 100MM assets under management must also disclose their put and call option holdings. Since put options generally indicate negative sentiment, and call options indicate positive sentiment, we can get a sense of the overall institutional sentiment by plotting the ratio of puts to calls. The chart to the right plots the historical put/call ratio for this instrument.
Using Put/Call Ratio as an indicator of investor sentiment overcomes one of the key deficiencies of using total institutional ownership, which is that a significant amount of assets under management are invested passively to track indices. Passively-managed funds do not typically buy options, so the put/call ratio indicator more closely tracks the sentiment of actively-managed funds.
13D/G Filings
We present 13D/G filings separately from the 13F filings because of the different treatement by the SEC. 13D/G filings can be filed by groups of investors (with one leading), whereas 13F filings cannot. This results in situations where an investor may file a 13D/G reporting one value for the total shares (representing all the shares owned by the investor group), but then file a 13F reporting a different value for the total shares (representing strictly their own ownership). This means that share ownership of 13D/G filings and 13F filings are oftentimes not directly comparable, so we present them separately.
Note: As of May 16, 2021, we no longer show owners that have not filed a 13D/G within the last year. Previously, we were showing the full history of 13D/G filings. In general, entities that are required to file 13D/G filings must file at least annually before submitting a closing filing. However, funds sometimes exit positions without submitting a closing filing (ie, they wind down), so displaying the full history sometimes resulted in confusion about the current ownership. To prevent confusion, we now only show ’current’ owners - that is - owners that have filed within the last year.
Upgrade to unlock premium data.
| File Date | Form | Investor | Prev Shares |
Latest Shares |
Δ Shares (Percent) |
Ownership (Percent) |
Δ Ownership (Percent) |
|
|---|---|---|---|---|---|---|---|---|
| 2025-02-13 | 1607 Capital Partners, LLC | 791,593 | 1,021,532 | 29.05 | 8.21 | 29.09 | ||
| 2025-01-14 | Tortoise Investment Management, LLC | 751,335 | 5.40 | |||||
| 2024-11-08 | MORGAN STANLEY | 702,648 | 587,014 | -16.46 | 4.70 | -16.07 |
13F and NPORT Filings
Detail on 13F filings are free. Detail on NP filings require a premium membership. Green rows indicate new positions. Red rows indicate closed positions. Click the link icon to see the full transaction history.
Upgrade
to unlock premium data and export to Excel ![]() .
.
| File Date | Source | Investor | Type | Avg Price (Est) |
Shares | Δ Shares (%) |
Reported Value ($1000) |
Δ Value (%) |
Port Alloc (%) |
|
|---|---|---|---|---|---|---|---|---|---|---|
| 2025-08-14 | 13F | Hilltop Holdings Inc. | 28,834 | 4.42 | 261 | 1.56 | ||||
| 2025-08-14 | 13F | Ancora Advisors, LLC | 18,207 | 0.00 | 165 | -2.96 | ||||
| 2025-04-08 | 13F | First Community Trust Na | 0 | -100.00 | 0 | -100.00 | ||||
| 2025-08-01 | 13F | James Investment Research Inc | 13,821 | 0.00 | 125 | -2.34 | ||||
| 2025-09-04 | 13F/A | Advisor Group Holdings, Inc. | 33,742 | 58.85 | 306 | 54.82 | ||||
| 2025-04-29 | 13F/A | Huntleigh Advisors, Inc. | 10,716 | 0.00 | 100 | 6.45 | ||||
| 2025-07-17 | 13F | Nelson, Van Denburg & Campbell Wealth Management Group, LLC | 16,066 | -14.96 | 146 | -17.61 | ||||
| 2025-08-05 | 13F | Sigma Planning Corp | 10,474 | 0.00 | 95 | -3.09 | ||||
| 2025-07-24 | 13F | Forefront Analytics, LLC | 93,517 | 847 | ||||||
| 2025-05-30 | NP | RiverNorth Flexible Municipal Income Fund, Inc. | 0 | -100.00 | 0 | -100.00 | ||||
| 2025-07-29 | 13F | Stephens Inc /ar/ | 28,000 | -8.79 | 254 | -11.54 | ||||
| 2025-05-30 | NP | RiverNorth Opportunistic Municipal Income Fund, Inc. | 0 | -100.00 | 0 | -100.00 | ||||
| 2025-08-06 | 13F | Commonwealth Equity Services, Llc | 14,689 | -42.33 | 0 | |||||
| 2025-08-14 | 13F | Wells Fargo & Company/mn | 52,950 | 21.34 | 480 | 17.98 | ||||
| 2025-07-24 | 13F | IFP Advisors, Inc | 15,898 | 65.59 | 144 | 61.80 | ||||
| 2025-08-11 | 13F | Nations Financial Group Inc, /ia/ /adv | 10,748 | -41.34 | 97 | -42.94 | ||||
| 2025-08-13 | 13F | Jones Financial Companies Lllp | 349,311 | -14.93 | 3,154 | -16.67 | ||||
| 2025-08-12 | 13F | MAI Capital Management | 574 | 0.88 | 5 | 0.00 | ||||
| 2025-08-07 | 13F | Midwest Trust Co | 38,650 | 350 | ||||||
| 2025-07-29 | 13F | Uhlmann Price Securities, Llc | 78,981 | 3.83 | 716 | 0.99 | ||||
| 2025-08-19 | 13F | Anchor Investment Management, LLC | 37,869 | 0.00 | 343 | -2.56 | ||||
| 2025-08-15 | 13F | Captrust Financial Advisors | 0 | -100.00 | 0 | |||||
| 2025-07-31 | 13F | Whipplewood Advisors, LLC | 146,796 | 111.83 | 1,330 | -3.28 | ||||
| 2025-04-17 | 13F | Janney Montgomery Scott LLC | 0 | -100.00 | 0 | |||||
| 2025-08-08 | 13F | Tortoise Investment Management, LLC | 636,599 | -9.60 | 5,768 | -12.13 | ||||
| 2025-08-12 | 13F | Proequities, Inc. | 0 | 0 | ||||||
| 2025-07-09 | 13F | Dynamic Advisor Solutions LLC | 10,274 | 93 | ||||||
| 2025-07-29 | 13F | Stratos Wealth Partners, LTD. | 16,700 | 17.61 | 151 | 14.39 | ||||
| 2025-07-21 | 13F | Barrett & Company, Inc. | 6,000 | 0.00 | 54 | -1.82 | ||||
| 2025-07-08 | 13F | Hickory Point Bank & Trust | 39,500 | 0.00 | 358 | -2.99 | ||||
| 2025-08-14 | 13F | Royal Bank Of Canada | 97,648 | 14.85 | 885 | 11.74 | ||||
| 2025-08-13 | 13F | Guggenheim Capital Llc | 299,396 | 26.65 | 2,713 | 23.10 | ||||
| 2025-08-14 | 13F | Ameriprise Financial Inc | 18,950 | -9.98 | 172 | -12.76 | ||||
| 2025-04-29 | 13F | Truist Financial Corp | 0 | -100.00 | 0 | |||||
| 2025-08-14 | 13F | Stifel Financial Corp | 73,228 | 0.00 | 663 | -2.79 | ||||
| 2025-05-12 | 13F | Independent Advisor Alliance | 0 | -100.00 | 0 | |||||
| 2025-07-15 | 13F | Sightline Wealth Advisors, LLC | 12,079 | 0.59 | 109 | -1.80 | ||||
| 2025-05-15 | 13F | Buckingham Strategic Partners | 0 | -100.00 | 0 | |||||
| 2025-05-12 | 13F | Wolverine Asset Management Llc | 0 | -100.00 | 0 | |||||
| 2025-07-22 | 13F | DAVENPORT & Co LLC | 19,257 | -2.28 | 174 | -4.92 | ||||
| 2025-08-14 | 13F | UBS Group AG | 170,428 | -16.43 | 1,544 | -18.74 | ||||
| 2025-08-14 | 13F | Bank Of America Corp /de/ | 154,701 | -9.34 | 1,402 | -11.89 | ||||
| 2025-05-13 | 13F | Lee Financial Co | 0 | -100.00 | 0 | |||||
| 2025-05-06 | 13F | Arlington Capital Management, Inc. | 0 | -100.00 | 0 | |||||
| 2025-05-29 | NP | RYDEX VARIABLE TRUST - Multi-Hedge Strategies Fund Variable Annuity | 423 | -1.17 | 4 | 0.00 | ||||
| 2025-07-30 | 13F | FNY Investment Advisers, LLC | 100 | 0 | ||||||
| 2025-08-12 | 13F | LPL Financial LLC | 33,343 | -3.71 | 302 | -6.21 | ||||
| 2025-08-08 | 13F | Schwarz Dygos Wheeler Investment Advisors Llc | 39,945 | 3.69 | 362 | 0.56 | ||||
| 2025-05-29 | NP | RYMSX - Guggenheim Multi-Hedge Strategies Fund Class P | 324 | -47.15 | 3 | -40.00 | ||||
| 2025-08-08 | 13F | Croban | 93,517 | 4.88 | 847 | 1.93 | ||||
| 2025-08-01 | 13F | Financial Counselors Inc | 0 | -100.00 | 0 | |||||
| 2025-08-07 | 13F | Hennion & Walsh Asset Management, Inc. | 265,949 | 76.73 | 2,409 | 71.83 | ||||
| 2025-08-14 | 13F | 1607 Capital Partners, LLC | 1,004,530 | -2.46 | 9,101 | -5.17 | ||||
| 2025-05-15 | 13F | Nomura Holdings Inc | 0 | -100.00 | 0 | |||||
| 2025-08-15 | 13F | Morgan Stanley | 584,440 | -0.82 | 5,295 | -3.59 | ||||
| 2025-07-28 | 13F | Deroy & Devereaux Private Investment Counsel Inc | 11,500 | 0.00 | 0 | |||||
| 2025-07-31 | 13F | Cambridge Investment Research Advisors, Inc. | 24,223 | -5.77 | 0 | |||||
| 2025-07-16 | 13F | Signaturefd, Llc | 0 | -100.00 | 0 | |||||
| 2025-08-14 | 13F | Citadel Advisors Llc | 27,281 | -2.57 | 247 | -5.00 | ||||
| 2025-08-11 | 13F | Dorsey & Whitney Trust CO LLC | 32,100 | 2.39 | 291 | -0.68 | ||||
| 2025-08-14 | 13F | Susquehanna International Group, Llp | 0 | -100.00 | 0 | |||||
| 2025-08-12 | 13F | Horizon Kinetics Asset Management Llc | 21,500 | 0.00 | 195 | -3.00 | ||||
| 2025-05-15 | 13F | Logan Stone Capital, LLC | 0 | -100.00 | 0 | |||||
| 2025-07-31 | 13F | Blake Schutter Theil Wealth Advisors, LLC | 111,032 | 21.90 | 1,006 | 18.51 | ||||
| 2025-08-13 | 13F | Northwestern Mutual Wealth Management Co | 28,456 | 0.58 | 258 | -2.28 | ||||
| 2025-05-05 | 13F | Blue Bell Private Wealth Management, Llc | 0 | -100.00 | 0 | |||||
| 2025-08-12 | 13F | South Plains Financial, Inc. | 4,240 | 0.00 | 38 | -2.56 | ||||
| 2025-08-14 | 13F | Balyasny Asset Management Llc | 12,507 | 113 | ||||||
| 2025-07-25 | 13F | Cerro Pacific Wealth Advisors LLC | 11,400 | 0.00 | 103 | 4.04 | ||||
| 2025-08-14 | 13F | Raymond James Financial Inc | 46,514 | 0.22 | 421 | -2.55 | ||||
| 2025-08-13 | 13F | Baird Financial Group, Inc. | 78,189 | -0.57 | 708 | -3.28 |