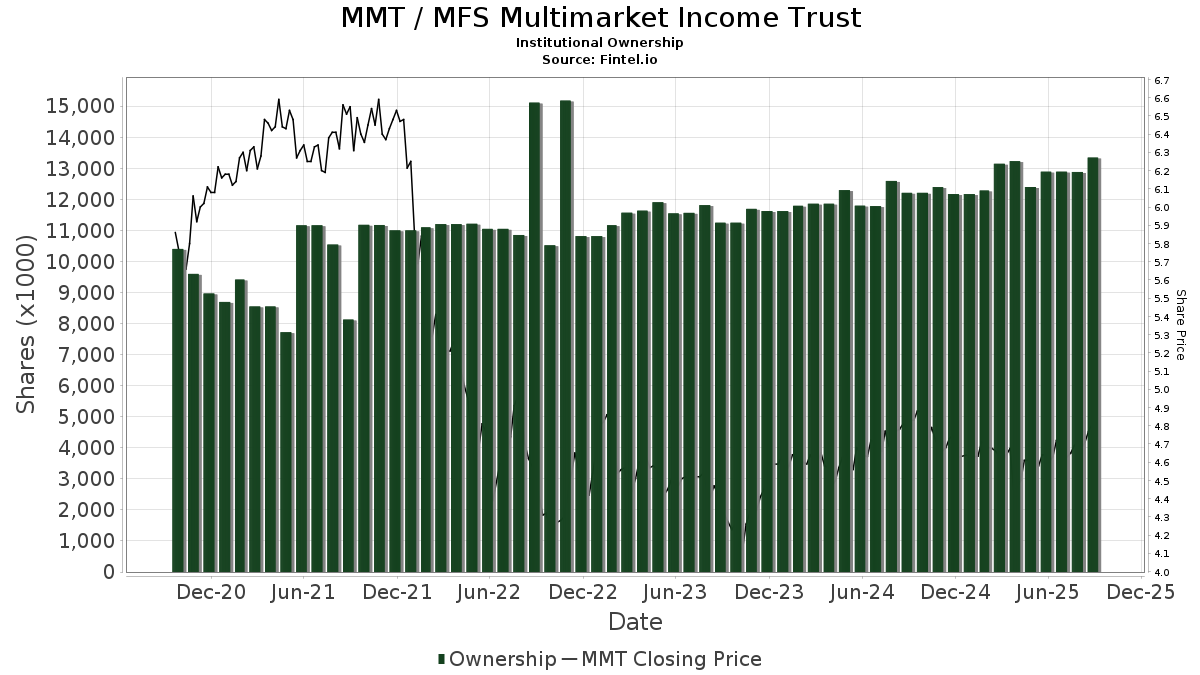
Basic Stats
| Institutional Owners | 85 total, 85 long only, 0 short only, 0 long/short - change of 3.61% MRQ |
| Average Portfolio Allocation | 0.0274 % - change of -12.22% MRQ |
| Institutional Shares (Long) | 13,345,551 (ex 13D/G) - change of 0.45MM shares 3.53% MRQ |
| Institutional Value (Long) | $ 57,611 USD ($1000) |
Institutional Ownership and Shareholders
MFS Multimarket Income Trust (US:MMT) has 85 institutional owners and shareholders that have filed 13D/G or 13F forms with the Securities Exchange Commission (SEC). These institutions hold a total of 13,345,551 shares. Largest shareholders include Allspring Global Investments Holdings, LLC, Morgan Stanley, Raymond James Financial Inc, 1607 Capital Partners, LLC, Invesco Ltd., PCEF - Invesco CEF Income Composite ETF, LPL Financial LLC, Pathstone Holdings, LLC, Janney Montgomery Scott LLC, and Cohen & Steers, Inc. .
MFS Multimarket Income Trust (NYSE:MMT) institutional ownership structure shows current positions in the company by institutions and funds, as well as latest changes in position size. Major shareholders can include individual investors, mutual funds, hedge funds, or institutions. The Schedule 13D indicates that the investor holds (or held) more than 5% of the company and intends (or intended) to actively pursue a change in business strategy. Schedule 13G indicates a passive investment of over 5%.
The share price as of September 10, 2025 is 4.81 / share. Previously, on September 11, 2024, the share price was 4.80 / share. This represents an increase of 0.21% over that period.
Fund Sentiment Score
The Fund Sentiment Score (fka Ownership Accumulation Score) finds the stocks that are being most bought by funds. It is the result of a sophisticated, multi-factor quantitative model that identifies companies with the highest levels of institutional accumulation. The scoring model uses a combination of the total increase in disclosed owners, the changes in portfolio allocations in those owners and other metrics. The number ranges from 0 to 100, with higher numbers indicating a higher level of accumulation to its peers, and 50 being the average.
Update Frequency: Daily
See Ownership Explorer, which provides a list of highest-ranking companies.
Institutional Put/Call Ratio
In addition to reporting standard equity and debt issues, institutions with more than 100MM assets under management must also disclose their put and call option holdings. Since put options generally indicate negative sentiment, and call options indicate positive sentiment, we can get a sense of the overall institutional sentiment by plotting the ratio of puts to calls. The chart to the right plots the historical put/call ratio for this instrument.
Using Put/Call Ratio as an indicator of investor sentiment overcomes one of the key deficiencies of using total institutional ownership, which is that a significant amount of assets under management are invested passively to track indices. Passively-managed funds do not typically buy options, so the put/call ratio indicator more closely tracks the sentiment of actively-managed funds.
13D/G Filings
We present 13D/G filings separately from the 13F filings because of the different treatement by the SEC. 13D/G filings can be filed by groups of investors (with one leading), whereas 13F filings cannot. This results in situations where an investor may file a 13D/G reporting one value for the total shares (representing all the shares owned by the investor group), but then file a 13F reporting a different value for the total shares (representing strictly their own ownership). This means that share ownership of 13D/G filings and 13F filings are oftentimes not directly comparable, so we present them separately.
Note: As of May 16, 2021, we no longer show owners that have not filed a 13D/G within the last year. Previously, we were showing the full history of 13D/G filings. In general, entities that are required to file 13D/G filings must file at least annually before submitting a closing filing. However, funds sometimes exit positions without submitting a closing filing (ie, they wind down), so displaying the full history sometimes resulted in confusion about the current ownership. To prevent confusion, we now only show ’current’ owners - that is - owners that have filed within the last year.
Upgrade to unlock premium data.
| File Date | Form | Investor | Prev Shares |
Latest Shares |
Δ Shares (Percent) |
Ownership (Percent) |
Δ Ownership (Percent) |
|
|---|---|---|---|---|---|---|---|---|
| 2024-10-07 | Allspring Global Investments Holdings, LLC | 3,251,335 | 5.88 |
13F and NPORT Filings
Detail on 13F filings are free. Detail on NP filings require a premium membership. Green rows indicate new positions. Red rows indicate closed positions. Click the link icon to see the full transaction history.
Upgrade
to unlock premium data and export to Excel ![]() .
.
| File Date | Source | Investor | Type | Avg Price (Est) |
Shares | Δ Shares (%) |
Reported Value ($1000) |
Δ Value (%) |
Port Alloc (%) |
|
|---|---|---|---|---|---|---|---|---|---|---|
| 2025-08-14 | 13F | Ancora Advisors, LLC | 90 | -99.70 | 0 | -100.00 | ||||
| 2025-08-14 | 13F | Wells Fargo & Company/mn | 49,756 | -20.57 | 234 | -19.93 | ||||
| 2025-08-12 | 13F | LPL Financial LLC | 512,411 | 10.16 | 2,408 | 11.38 | ||||
| 2025-08-12 | 13F | Northstar Financial Companies, Inc. | 54,458 | 0.43 | 256 | 1.19 | ||||
| 2025-08-12 | 13F | TCTC Holdings, LLC | 5,850 | 0.00 | 27 | 0.00 | ||||
| 2025-08-14 | 13F | Stifel Financial Corp | 216,318 | -4.07 | 1,017 | -3.05 | ||||
| 2025-07-10 | 13F | Oliver Lagore Vanvalin Investment Group | 19,844 | 0.00 | 92 | -1.08 | ||||
| 2025-04-22 | 13F | Synergy Financial Management, LLC | 0 | -100.00 | 0 | |||||
| 2025-07-18 | 13F | SOA Wealth Advisors, LLC. | 400 | 0.00 | 2 | 0.00 | ||||
| 2025-08-11 | 13F | WPG Advisers, LLC | 3,633 | -16.12 | 17 | -15.00 | ||||
| 2025-07-25 | 13F | We Are One Seven, LLC | 48,608 | -0.44 | 228 | 0.44 | ||||
| 2025-05-09 | 13F | TD Waterhouse Canada Inc. | 0 | -100.00 | 0 | |||||
| 2025-09-04 | 13F/A | Advisor Group Holdings, Inc. | 104,726 | -10.23 | 492 | -9.23 | ||||
| 2025-08-14 | 13F | Royal Bank Of Canada | 147,159 | 7.08 | 692 | 8.29 | ||||
| 2025-08-14 | 13F | CoreCap Advisors, LLC | 7,910 | 0.00 | 37 | 2.78 | ||||
| 2025-08-05 | 13F | Shaker Financial Services, LLC | 225,381 | -27.07 | 1,059 | -26.30 | ||||
| 2025-04-29 | 13F | Tradewinds, LLC. | 0 | -100.00 | 0 | |||||
| 2025-08-13 | 13F | Northwestern Mutual Wealth Management Co | 235,831 | 0.00 | 1,108 | 1.09 | ||||
| 2025-07-07 | 13F | Fox Hill Wealth Management | 12,371 | 0.00 | 58 | 1.75 | ||||
| 2025-07-14 | 13F | Armstrong Advisory Group, Inc | 700 | 0.00 | 3 | 0.00 | ||||
| 2025-05-15 | 13F | Creative Planning | 0 | -100.00 | 0 | |||||
| 2025-08-06 | 13F | Kcm Investment Advisors Llc | 10,000 | 0.00 | 47 | 2.17 | ||||
| 2025-05-02 | 13F | Schwarz Dygos Wheeler Investment Advisors Llc | 0 | -100.00 | 0 | |||||
| 2025-05-14 | 13F | Susquehanna International Group, Llp | 0 | -100.00 | 0 | |||||
| 2025-07-25 | 13F | Allspring Global Investments Holdings, LLC | 3,270,086 | 0.00 | 15,369 | 1.08 | ||||
| 2025-08-15 | 13F | Equitable Holdings, Inc. | 24,550 | 0.00 | 115 | 0.88 | ||||
| 2025-08-04 | 13F | Spire Wealth Management | 1,000 | 0.00 | 5 | 0.00 | ||||
| 2025-08-12 | 13F | Jpmorgan Chase & Co | 142 | 1 | ||||||
| 2025-08-14 | 13F | Comerica Bank | 897 | 15.44 | 4 | 33.33 | ||||
| 2025-07-16 | 13F | Signaturefd, Llc | 42 | 0.00 | 0 | |||||
| 2025-08-12 | 13F | Steward Partners Investment Advisory, Llc | 21,020 | 0.00 | 99 | 1.03 | ||||
| 2025-08-11 | 13F | HighTower Advisors, LLC | 0 | -100.00 | 0 | |||||
| 2025-08-14 | 13F | 1607 Capital Partners, LLC | 860,538 | 41.20 | 4,045 | 42.75 | ||||
| 2025-04-21 | 13F | Nelson, Van Denburg & Campbell Wealth Management Group, LLC | 0 | -100.00 | 0 | |||||
| 2025-08-04 | 13F | Wolverine Asset Management Llc | 10,788 | -32.64 | 51 | -32.43 | ||||
| 2025-08-27 | NP | RYDEX VARIABLE TRUST - Multi-Hedge Strategies Fund Variable Annuity | 673 | -19.59 | 3 | 0.00 | ||||
| 2025-08-06 | 13F | Wedbush Securities Inc | 14,655 | 0.66 | 0 | |||||
| 2025-07-24 | 13F | Bey-Douglas LLC | 41,491 | 54.90 | 195 | 57.26 | ||||
| 2025-08-14 | 13F | Sit Investment Associates Inc | 32,990 | 0.00 | 0 | |||||
| 2025-07-17 | 13F | XML Financial, LLC | 10,690 | -8.08 | 50 | -7.41 | ||||
| 2025-08-15 | 13F | Morgan Stanley | 2,852,508 | -0.98 | 13,407 | 0.08 | ||||
| 2025-08-14 | 13F | Jane Street Group, Llc | 17,845 | 84 | ||||||
| 2025-08-07 | 13F | Allworth Financial LP | 37,500 | 176 | ||||||
| 2025-08-01 | 13F | Rossby Financial, LCC | 4,493 | 0.00 | 21 | 5.00 | ||||
| 2025-04-14 | 13F | Umb Bank N A/mo | 0 | -100.00 | 0 | |||||
| 2025-07-14 | 13F | AdvisorNet Financial, Inc | 1,282 | 0.00 | 6 | 20.00 | ||||
| 2025-08-14 | 13F | UBS Group AG | 183,859 | -2.31 | 864 | -1.26 | ||||
| 2025-07-25 | 13F | Commonwealth Financial Services, LLC | 26,100 | 0.00 | 123 | 0.83 | ||||
| 2025-08-11 | 13F | Elequin Capital Lp | 0 | -100.00 | 0 | |||||
| 2025-07-17 | 13F | Janney Montgomery Scott LLC | 370,592 | -0.23 | 2 | 0.00 | ||||
| 2025-07-31 | 13F | Oak Harbor Wealth Partners, Llc | 29,062 | 0.00 | 137 | 0.74 | ||||
| 2025-04-16 | 13F | Wealth Enhancement Advisory Services, Llc | 0 | -100.00 | 0 | |||||
| 2025-08-11 | 13F | Teachers Insurance & Annuity Association Of America | 3,860 | 0.00 | 18 | 5.88 | ||||
| 2025-08-14 | 13F | Bank Of America Corp /de/ | 28,868 | -10.74 | 136 | -10.00 | ||||
| 2025-08-14 | 13F | Atomi Financial Group, Inc. | 60,746 | 0.00 | 286 | 1.06 | ||||
| 2025-07-28 | NP | PCEF - Invesco CEF Income Composite ETF This fund is a listed as child fund of Invesco Ltd. and if that institution has disclosed ownership in this security, then these positions will not be double counted when calculating total shares and total value | 760,159 | 8.25 | 3,512 | 6.85 | ||||
| 2025-07-07 | 13F | Hoertkorn Richard Charles | 22,000 | 0.00 | 103 | 0.98 | ||||
| 2025-08-14 | 13F | Mariner, LLC | 17,085 | -8.86 | 80 | -8.05 | ||||
| 2025-07-22 | 13F | Merit Financial Group, LLC | 12,932 | 61 | ||||||
| 2025-07-16 | 13F | West Branch Capital LLC | 1,000 | 0.00 | 5 | 0.00 | ||||
| 2025-08-08 | 13F | Cetera Investment Advisers | 170,244 | -9.22 | 800 | -8.26 | ||||
| 2025-07-31 | 13F | Cambridge Investment Research Advisors, Inc. | 87,141 | 1.75 | 0 | |||||
| 2025-08-27 | NP | RYMSX - Guggenheim Multi-Hedge Strategies Fund Class P | 400 | -37.69 | 2 | -50.00 | ||||
| 2025-08-12 | 13F | Global Retirement Partners, LLC | 2,000 | 9 | ||||||
| 2025-08-25 | 13F/A | Kovitz Investment Group Partners, LLC | 0 | -100.00 | 0 | |||||
| 2025-08-14 | 13F | Ameriprise Financial Inc | 27,513 | 23.09 | 129 | 14.16 | ||||
| 2025-07-14 | 13F | Sowell Financial Services LLC | 44,767 | -10.25 | 210 | -9.09 | ||||
| 2025-08-14 | 13F | Lazard Asset Management Llc | 0 | |||||||
| 2025-08-14 | 13F | Cohen & Steers, Inc. | 329,603 | 0.00 | 2 | 0.00 | ||||
| 2025-08-12 | 13F | Landscape Capital Management, L.l.c. | 43,670 | -33.37 | 205 | -32.57 | ||||
| 2025-08-07 | 13F | Readystate Asset Management Lp | 45,237 | -41.70 | 213 | -41.11 | ||||
| 2025-08-14 | 13F | Balyasny Asset Management Llc | 12,208 | 57 | ||||||
| 2025-08-06 | 13F | Golden State Wealth Management, LLC | 900 | 0.00 | 4 | 0.00 | ||||
| 2025-05-15 | 13F | Two Sigma Securities, Llc | 0 | -100.00 | 0 | |||||
| 2025-05-07 | 13F | Sheaff Brock Investment Advisors, LLC | 37,500 | 0.00 | 174 | -0.57 | ||||
| 2025-07-14 | 13F | Park Avenue Securities Llc | 0 | -100.00 | 0 | |||||
| 2025-04-15 | 13F | Laurel Wealth Advisors LLC | 0 | -100.00 | 0 | |||||
| 2025-08-14 | 13F | GWM Advisors LLC | 65,700 | -2.18 | 309 | -1.28 | ||||
| 2025-07-18 | 13F | Founders Capital Management | 6,270 | 0.00 | 29 | 0.00 | ||||
| 2025-08-13 | 13F | Invesco Ltd. | 763,018 | 1.57 | 3,586 | 2.66 | ||||
| 2025-07-21 | 13F | Ashton Thomas Securities, Llc | 27,500 | -20.29 | 129 | -19.37 | ||||
| 2025-08-14 | 13F | Peapack Gladstone Financial Corp | 14,219 | -10.20 | 0 | |||||
| 2025-07-08 | 13F | Nbc Securities, Inc. | 2,000 | 0.00 | 0 | |||||
| 2025-07-24 | 13F | Us Bancorp \de\ | 3,000 | 0.00 | 14 | 7.69 | ||||
| 2025-08-14 | 13F | Raymond James Financial Inc | 913,667 | 6.57 | 4,294 | 7.73 | ||||
| 2025-08-12 | 13F | Pathstone Holdings, LLC | 504,514 | 134.95 | 2,371 | 137.58 | ||||
| 2025-08-11 | 13F | Mosaic Family Wealth Partners, Llc | 157,160 | -2.22 | 739 | -1.20 | ||||
| 2025-07-25 | 13F | Cwm, Llc | 1,569 | 0.00 | 0 | |||||
| 2025-08-06 | 13F | Commonwealth Equity Services, Llc | 206,570 | 1.06 | 1 | |||||
| 2025-08-11 | 13F | Private Advisor Group, LLC | 19,272 | 0.00 | 91 | 1.12 | ||||
| 2025-08-14 | 13F | Citadel Advisors Llc | 14,524 | 68 | ||||||
| 2025-07-18 | 13F | Broadway Wealth Solutions, Inc. | 14,900 | 0.00 | 70 | 1.45 | ||||
| 2025-08-14 | 13F | Hrt Financial Lp | 21,862 | 0 | ||||||
| 2025-07-22 | 13F | Fortitude Advisory Group L.L.C. | 88,913 | 0.00 | 418 | 5.30 | ||||
| 2025-08-12 | 13F | Founders Financial Alliance, LLC | 15,129 | 0.00 | 71 | 1.43 | ||||
| 2025-08-12 | 13F | Franklin Resources Inc | 20,610 | 97 | ||||||
| 2025-08-12 | 13F | Proequities, Inc. | 0 | 0 | ||||||
| 2025-08-18 | 13F | Geneos Wealth Management Inc. | 10,857 | 6.91 | 51 | 8.51 | ||||
| 2025-05-14 | 13F | Mml Investors Services, Llc | 0 | -100.00 | 0 | |||||
| 2025-08-14 | 13F | Colony Group, LLC | 28,645 | 0.00 | 135 | 0.75 | ||||
| 2025-07-10 | 13F | Atticus Wealth Management, Llc | 1,854 | 0.00 | 9 | 0.00 | ||||
| 2025-08-08 | 13F | Pnc Financial Services Group, Inc. | 663 | 0.00 | 3 | 0.00 | ||||
| 2025-08-06 | 13F | Ethos Financial Group, LLC | 27,212 | -2.47 | 128 | -1.55 | ||||
| 2025-08-11 | 13F | Delta Asset Management Llc/tn | 0 | -100.00 | 0 |