Basic Stats
| Institutional Owners | 155 total, 155 long only, 0 short only, 0 long/short - change of 9.15% MRQ |
| Average Portfolio Allocation | 0.1209 % - change of -14.22% MRQ |
| Institutional Shares (Long) | 15,384,005 (ex 13D/G) - change of 0.93MM shares 6.47% MRQ |
| Institutional Value (Long) | $ 377,736 USD ($1000) |
Institutional Ownership and Shareholders
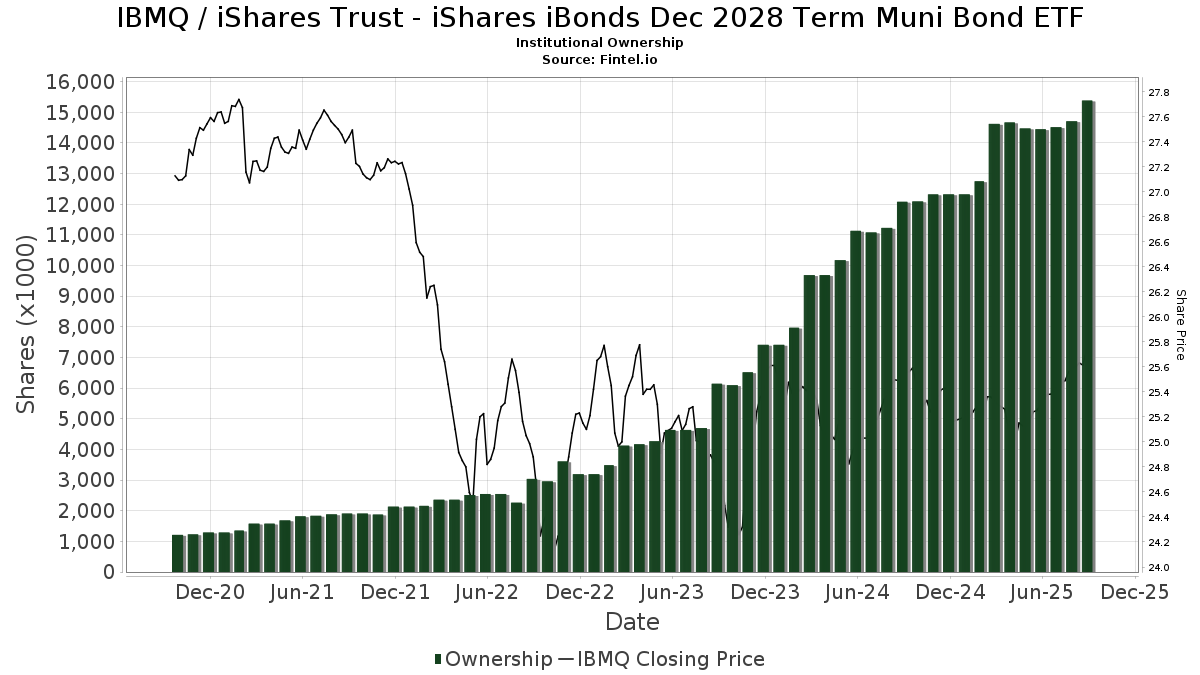
iShares Trust - iShares iBonds Dec 2028 Term Muni Bond ETF (US:IBMQ) has 155 institutional owners and shareholders that have filed 13D/G or 13F forms with the Securities Exchange Commission (SEC). These institutions hold a total of 15,384,005 shares. Largest shareholders include Bank Of America Corp /de/, Hartland & Co., LLC, Mercer Global Advisors Inc /adv, Envestnet Asset Management Inc, Us Bancorp \de\, HighTower Advisors, LLC, Wells Fargo & Company/mn, GWM Advisors LLC, Hengehold Capital Management Llc, and Hills Bank & Trust Co .
iShares Trust - iShares iBonds Dec 2028 Term Muni Bond ETF (BATS:IBMQ) institutional ownership structure shows current positions in the company by institutions and funds, as well as latest changes in position size. Major shareholders can include individual investors, mutual funds, hedge funds, or institutions. The Schedule 13D indicates that the investor holds (or held) more than 5% of the company and intends (or intended) to actively pursue a change in business strategy. Schedule 13G indicates a passive investment of over 5%.
The share price as of September 5, 2025 is 25.68 / share. Previously, on September 9, 2024, the share price was 25.52 / share. This represents an increase of 0.63% over that period.
Fund Sentiment Score
The Fund Sentiment Score (fka Ownership Accumulation Score) finds the stocks that are being most bought by funds. It is the result of a sophisticated, multi-factor quantitative model that identifies companies with the highest levels of institutional accumulation. The scoring model uses a combination of the total increase in disclosed owners, the changes in portfolio allocations in those owners and other metrics. The number ranges from 0 to 100, with higher numbers indicating a higher level of accumulation to its peers, and 50 being the average.
Update Frequency: Daily
See Ownership Explorer, which provides a list of highest-ranking companies.
Institutional Put/Call Ratio
In addition to reporting standard equity and debt issues, institutions with more than 100MM assets under management must also disclose their put and call option holdings. Since put options generally indicate negative sentiment, and call options indicate positive sentiment, we can get a sense of the overall institutional sentiment by plotting the ratio of puts to calls. The chart to the right plots the historical put/call ratio for this instrument.
Using Put/Call Ratio as an indicator of investor sentiment overcomes one of the key deficiencies of using total institutional ownership, which is that a significant amount of assets under management are invested passively to track indices. Passively-managed funds do not typically buy options, so the put/call ratio indicator more closely tracks the sentiment of actively-managed funds.
13F and NPORT Filings
Detail on 13F filings are free. Detail on NP filings require a premium membership. Green rows indicate new positions. Red rows indicate closed positions. Click the link icon to see the full transaction history.
Upgrade
to unlock premium data and export to Excel ![]() .
.
| File Date | Source | Investor | Type | Avg Price (Est) |
Shares | Δ Shares (%) |
Reported Value ($1000) |
Δ Value (%) |
Port Alloc (%) |
|
|---|---|---|---|---|---|---|---|---|---|---|
| 2025-07-08 | 13F | FF Advisors,LLC | 21,309 | 3.66 | 541 | 4.84 | ||||
| 2025-08-14 | 13F | Garden State Investment Advisory Services LLC | 0 | -100.00 | 0 | |||||
| 2025-07-28 | 13F | Harbour Investments, Inc. | 294 | 0.00 | 7 | 0.00 | ||||
| 2025-07-23 | 13F | Sax Wealth Advisors, Llc | 13,241 | 336 | ||||||
| 2025-08-07 | 13F | Kestra Private Wealth Services, Llc | 8,031 | 204 | ||||||
| 2025-07-24 | 13F | Cyndeo Wealth Partners, LLC | 97,284 | -9.73 | 2,472 | -9.32 | ||||
| 2025-08-13 | 13F | Peloton Wealth Strategists | 13,000 | 0.00 | 0 | |||||
| 2025-08-13 | 13F | RIA Advisory Group LLC | 49,569 | 9.03 | 1,260 | 9.57 | ||||
| 2025-08-04 | 13F | Spinnaker Trust | 54,020 | 13.48 | 1,373 | 14.05 | ||||
| 2025-07-29 | 13F | Stratos Wealth Partners, LTD. | 28,281 | -17.44 | 719 | -17.09 | ||||
| 2025-08-08 | 13F | Hartland & Co., LLC | 891,719 | 3.39 | 22,659 | 3.88 | ||||
| 2025-07-08 | 13F | Parallel Advisors, LLC | 16,279 | 7.67 | 414 | 8.12 | ||||
| 2025-07-16 | 13F | Kathmere Capital Management, LLC | 301,088 | -45.68 | 7,651 | -45.43 | ||||
| 2025-08-12 | 13F | BlackRock, Inc. | 150 | 0.67 | 4 | 0.00 | ||||
| 2025-08-07 | 13F | Rossmore Private Capital | 13,887 | 353 | ||||||
| 2025-07-17 | 13F | Archford Capital Strategies, LLC | 13,065 | 4.74 | 332 | 5.08 | ||||
| 2025-08-11 | 13F | Arrow Financial Corp | 9,448 | 0.00 | 240 | 0.84 | ||||
| 2025-07-28 | 13F | Nestegg Advisors, Inc. | 13,225 | -39.34 | 336 | -39.02 | ||||
| 2025-07-30 | 13F | Rehmann Capital Advisory Group | 11,065 | 0.00 | 281 | 0.72 | ||||
| 2025-08-14 | 13F | Wells Fargo & Company/mn | 454,319 | 4.82 | 11,544 | 5.32 | ||||
| 2025-08-15 | 13F | Morgan Stanley | 192,905 | 5.83 | 4,902 | 6.34 | ||||
| 2025-08-15 | 13F | Captrust Financial Advisors | 19,844 | -2.53 | 504 | -1.95 | ||||
| 2025-07-17 | 13F | Hengehold Capital Management Llc | 386,615 | 3.24 | 9,824 | 3.73 | ||||
| 2025-08-11 | 13F | United Capital Financial Advisers, Llc | 107,202 | 0.06 | 2,724 | 0.55 | ||||
| 2025-08-13 | 13F | Smith, Moore & Co. | 14,163 | 360 | ||||||
| 2025-07-22 | 13F | Valley National Advisers Inc | 3,943 | 0 | ||||||
| 2025-07-18 | 13F | Precision Wealth Strategies, LLC | 10,392 | 264 | ||||||
| 2025-08-08 | 13F | Cetera Investment Advisers | 34,100 | 42.15 | 866 | 42.90 | ||||
| 2025-08-04 | 13F | Jim Saulnier & Associates, Llc | 13,612 | 0.61 | 346 | 0.88 | ||||
| 2025-08-08 | 13F | Meridian Wealth Management, LLC | 12,954 | 329 | ||||||
| 2025-07-07 | 13F | Trust Co | 13,728 | 0.00 | 349 | 0.29 | ||||
| 2025-07-08 | 13F | Heartwood Wealth Advisors LLC | 252,883 | 0.05 | 6,426 | 0.53 | ||||
| 2025-08-12 | 13F | LPL Financial LLC | 265,242 | 2.44 | 6,740 | 2.92 | ||||
| 2025-07-09 | 13F | Massmutual Trust Co Fsb/adv | 19,660 | 14,462.96 | 500 | 16,533.33 | ||||
| 2025-07-29 | 13F | Stratos Wealth Advisors, LLC | 97,842 | 137.99 | 2,486 | 139.27 | ||||
| 2025-07-22 | 13F | Partners Wealth Management, Llc | 11,593 | 0.00 | 293 | -0.34 | ||||
| 2025-08-12 | 13F | YANKCOM Partnership | 0 | -100.00 | 0 | |||||
| 2025-08-14 | 13F | Mercer Global Advisors Inc /adv | 856,888 | 13.85 | 21,774 | 14.39 | ||||
| 2025-08-14 | 13F | Snowden Capital Advisors LLC | 31,000 | 0.00 | 788 | 0.51 | ||||
| 2025-07-16 | 13F | Evergreen Private Wealth LLC | 43,810 | 1.33 | 1,113 | 1.83 | ||||
| 2025-07-17 | 13F/A | Capital Investment Advisors, LLC | 58,555 | 13.15 | 1,488 | 13.69 | ||||
| 2025-07-15 | 13F | Postrock Partners Llc | 16,841 | 26.71 | 428 | 27.08 | ||||
| 2025-07-11 | 13F | Quantum Financial Advisors, LLC | 87,204 | 5.12 | 2,216 | 5.58 | ||||
| 2025-08-27 | 13F/A | Brinker Capital Investments, LLC | 27,000 | 27.92 | 686 | 28.71 | ||||
| 2025-07-15 | 13F | Droms Strauss Advisors Inc /mo/ /adv | 15,443 | 10.77 | 392 | 11.36 | ||||
| 2025-07-31 | 13F | Leavell Investment Management, Inc. | 50,439 | 93.17 | 1,282 | 94.09 | ||||
| 2025-07-08 | 13F | Legacy Private Trust Co. | 82,149 | 0.00 | 2,087 | 0.48 | ||||
| 2025-08-14 | 13F | STAR Financial Bank | 0 | -100.00 | 0 | |||||
| 2025-08-14 | 13F | Ameriprise Financial Inc | 113,132 | 3.51 | 2,875 | 4.02 | ||||
| 2025-08-14 | 13F | Citadel Advisors Llc | 0 | -100.00 | 0 | |||||
| 2025-08-12 | 13F | Steward Partners Investment Advisory, Llc | 11,666 | 33.51 | 296 | 34.55 | ||||
| 2025-08-14 | 13F | Royal Bank Of Canada | 92,733 | -1.27 | 2,356 | -0.80 | ||||
| 2025-07-18 | 13F | Client 1st Advisory Group, Llc | 19,920 | 0.00 | 506 | 0.60 | ||||
| 2025-08-12 | 13F | Covington Investment Advisors Inc. | 308,365 | 9.30 | 8 | 0.00 | ||||
| 2025-08-14 | 13F | Comerica Bank | 5,889 | 0.00 | 150 | 0.68 | ||||
| 2025-08-11 | 13F | Avantax Planning Partners, Inc. | 12,459 | -0.01 | 317 | 0.32 | ||||
| 2025-08-14 | 13F | Mariner, LLC | 14,536 | 0.00 | 369 | 0.54 | ||||
| 2025-05-14 | 13F | Evergreen Wealth Solutions, LLC | 0 | -100.00 | 0 | |||||
| 2025-08-12 | 13F | OneAscent Financial Services LLC | 9,066 | -7.38 | 0 | |||||
| 2025-08-14 | 13F | UBS Group AG | 335,095 | -8.03 | 8,515 | -7.60 | ||||
| 2025-07-17 | 13F | Catalytic Wealth RIA, LLC | 31,217 | -2.05 | 793 | -1.49 | ||||
| 2025-08-06 | 13F | Rialto Wealth Management, LLC | 828 | 0.00 | 21 | 5.00 | ||||
| 2025-08-15 | 13F | CI Private Wealth, LLC | 11,656 | -65.87 | 296 | -65.70 | ||||
| 2025-05-12 | 13F | Sandy Spring Bank | 61,833 | 15.14 | 1,564 | 15.61 | ||||
| 2025-08-01 | 13F | First National Trust Co | 14,433 | 4.28 | 367 | 4.57 | ||||
| 2025-07-30 | 13F | Granite Harbor Advisors, Inc. | 41,059 | -9.39 | 1,043 | -8.91 | ||||
| 2025-08-12 | 13F | Proequities, Inc. | 0 | 0 | ||||||
| 2025-08-07 | 13F | Allworth Financial LP | 813 | 0.00 | 21 | 0.00 | ||||
| 2025-08-13 | 13F | MONECO Advisors, LLC | 10,933 | 0.00 | 278 | 0.36 | ||||
| 2025-08-12 | 13F | Passive Capital Management, LLC. | 13,803 | 0.00 | 350 | 0.29 | ||||
| 2025-07-24 | 13F | IFP Advisors, Inc | 30,559 | 14.36 | 776 | 14.96 | ||||
| 2025-07-29 | 13F | Roof Eidam & Maycock/adv | 31,789 | 0.14 | 808 | 0.62 | ||||
| 2025-08-07 | 13F | CENTRAL TRUST Co | 151,130 | 0.76 | 3,840 | 1.24 | ||||
| 2025-08-14 | 13F | Fmr Llc | 2,043 | -75.05 | 52 | -75.36 | ||||
| 2025-08-14 | 13F | Benjamin Edwards Inc | 81,830 | 150.56 | 2,079 | 152.00 | ||||
| 2025-07-09 | 13F | Praetorian Wealth Management, Inc. | 242,261 | 1.30 | 6,156 | 1.79 | ||||
| 2025-08-04 | 13F | ArborFi Advisors, LLC | 0 | -100.00 | 0 | |||||
| 2025-08-13 | 13F | Beacon Pointe Advisors, LLC | 23,464 | 0.32 | 596 | 0.85 | ||||
| 2025-07-11 | 13F | Financial Advisory Corp | 27,255 | 693 | ||||||
| 2025-08-06 | 13F | Commonwealth Equity Services, Llc | 62,636 | 3.26 | 2 | 0.00 | ||||
| 2025-08-14 | 13F | Jane Street Group, Llc | 117,601 | 91.66 | 2,988 | 92.65 | ||||
| 2025-05-16 | 13F/A | Kestra Investment Management, LLC | 0 | -100.00 | 0 | |||||
| 2025-07-23 | 13F | Valmark Advisers, Inc. | 59,642 | 11.45 | 1,516 | 11.97 | ||||
| 2025-08-06 | 13F | Atlantic Union Bankshares Corp | 63,186 | 1,606 | ||||||
| 2025-08-14 | 13F | Glen Eagle Advisors, LLC | 2,725 | 0.00 | 69 | 1.47 | ||||
| 2025-08-08 | 13F | Wrapmanager Inc | 13,905 | -4.43 | 353 | -3.81 | ||||
| 2025-08-13 | 13F | Lido Advisors, LLC | 185,542 | 10.01 | 4,715 | 10.53 | ||||
| 2025-07-22 | 13F | Woodmont Investment Counsel Llc | 95,929 | 17.12 | 2,438 | 17.67 | ||||
| 2025-07-09 | 13F | Bank of New Hampshire | 4,770 | 0.00 | 121 | 0.83 | ||||
| 2025-07-21 | 13F | Crews Bank & Trust | 31,482 | 0.00 | 800 | 0.38 | ||||
| 2025-08-11 | 13F | CFS Investment Advisory Services, LLC | 24,308 | -0.32 | 1 | |||||
| 2025-07-30 | 13F | Phillips Financial Management, Llc | 48,020 | 106.27 | 1,220 | 107.48 | ||||
| 2025-08-01 | 13F | Envestnet Asset Management Inc | 841,032 | 4.56 | 21,371 | 5.06 | ||||
| 2025-08-11 | 13F | Private Advisor Group, LLC | 8,726 | 222 | ||||||
| 2025-08-13 | 13F | Jones Financial Companies Lllp | 9,776 | 22.31 | 248 | 23.38 | ||||
| 2025-07-25 | 13F | Cwm, Llc | 39,362 | 18.93 | 1 | |||||
| 2025-08-14 | 13F | Integrated Wealth Concepts LLC | 115,028 | 3.23 | 2,923 | 3.69 | ||||
| 2025-08-14 | 13F | GWM Advisors LLC | 434,996 | 2.27 | 11,053 | 2.75 | ||||
| 2025-07-29 | 13F | Private Trust Co Na | 8,883 | -3.31 | 226 | -3.02 | ||||
| 2025-08-14 | 13F | Stifel Financial Corp | 193,861 | 80.61 | 4,926 | 81.50 | ||||
| 2025-08-05 | 13F | American Capital Advisory, LLC | 2,217 | 0.00 | 56 | 0.00 | ||||
| 2025-08-14 | 13F | Bank Of America Corp /de/ | 2,070,507 | 7.45 | 52,612 | 7.96 | ||||
| 2025-08-07 | 13F | Gryphon Financial Partners LLC | 24,940 | 634 | ||||||
| 2025-08-13 | 13F | Cary Street Partners Financial Llc | 7,956 | 0.00 | 202 | 0.50 | ||||
| 2025-08-13 | 13F | Northwestern Mutual Wealth Management Co | 185,252 | 12.72 | 4,707 | 13.26 | ||||
| 2025-07-31 | 13F | Cambridge Investment Research Advisors, Inc. | 30,265 | 275.64 | 1 | |||||
| 2025-08-12 | 13F | Ameritas Investment Partners, Inc. | 18,062 | 0.03 | 459 | 0.44 | ||||
| 2025-07-21 | 13F | Barrett & Company, Inc. | 1,794 | 46 | ||||||
| 2025-07-28 | 13F | WJ Wealth Management, LLC | 39,200 | 996 | ||||||
| 2025-07-22 | 13F | Penobscot Investment Management Company, Inc. | 8,000 | 0.00 | 203 | 0.50 | ||||
| 2025-08-01 | 13F | Paradigm, Strategies in Wealth Management, LLC | 22,906 | -16.44 | 582 | -16.02 | ||||
| 2025-08-13 | 13F | Flow Traders U.s. Llc | 9,668 | 0 | ||||||
| 2025-08-14 | 13F | 10Elms LLP | 19,160 | 0.00 | 487 | 0.41 | ||||
| 2025-07-07 | 13F | Vishria Bird Financial Group, LLC | 15,929 | 405 | ||||||
| 2025-05-15 | 13F/A | Orion Portfolio Solutions, LLC | 21,107 | 534 | ||||||
| 2025-08-19 | 13F | Asset Dedication, LLC | 2,004 | 0.00 | 51 | 0.00 | ||||
| 2025-08-13 | 13F | Green Harvest Asset Management LLC | 11,385 | 289 | ||||||
| 2025-08-14 | 13F | Envision Financial Planning, LLC | 84,482 | -6.02 | 2,147 | -5.59 | ||||
| 2025-07-25 | 13F | Commonwealth Financial Services, LLC | 10,367 | -2.44 | 263 | -1.87 | ||||
| 2025-08-14 | 13F | Colony Group, LLC | 62,843 | 3.26 | 1,597 | 3.70 | ||||
| 2025-07-29 | 13F | Accretive Wealth Partners, LLC | 8,274 | 210 | ||||||
| 2025-08-14 | 13F | Raymond James Financial Inc | 239,730 | -35.92 | 6,092 | -35.62 | ||||
| 2025-08-11 | 13F | PFG Private Wealth Management, LLC | 11,649 | 0.00 | 296 | 0.68 | ||||
| 2025-07-21 | 13F | Atwater Malick LLC | 10,921 | 278 | ||||||
| 2025-09-04 | 13F/A | Advisor Group Holdings, Inc. | 36,609 | 16.11 | 930 | 16.69 | ||||
| 2025-07-22 | 13F | Blue Square Asset Management, Llc | 29,176 | -2.99 | 741 | -2.50 | ||||
| 2025-07-21 | 13F | Cliftonlarsonallen Wealth Advisors, Llc | 181,110 | 4.87 | 4,602 | 5.38 | ||||
| 2025-08-05 | 13F | Hills Bank & Trust Co | 382,180 | 15.54 | 9,711 | 16.09 | ||||
| 2025-08-12 | 13F | Wealthbridge Capital Management, Llc | 12,732 | 5.64 | 324 | 6.25 | ||||
| 2025-07-30 | 13F | Klingman & Associates, LLC | 18,088 | -11.47 | 460 | -11.05 | ||||
| 2025-07-30 | 13F | Brookstone Capital Management | 11,292 | 21.94 | 287 | 22.22 | ||||
| 2025-08-14 | 13F/A | Rockefeller Capital Management L.P. | 18,154 | 8.56 | 461 | 9.24 | ||||
| 2025-07-14 | 13F | Sentinel Pension Advisors Inc | 51,221 | 0.61 | 1,302 | 1.09 | ||||
| 2025-07-24 | 13F | Us Bancorp \de\ | 734,646 | 7.39 | 18,667 | 7.90 | ||||
| 2025-07-01 | 13F | Confluence Investment Management Llc | 98,908 | 200.29 | 2,513 | 202.04 | ||||
| 2025-07-29 | 13F | Regions Financial Corp | 27,089 | 24.18 | 688 | 24.86 | ||||
| 2025-08-11 | 13F | HighTower Advisors, LLC | 653,576 | -6.72 | 16,607 | -6.28 | ||||
| 2025-07-21 | 13F | Segment Wealth Management, LLC | 9,500 | 0.00 | 241 | 0.42 | ||||
| 2025-05-14 | 13F | Stonebridge Capital Advisors LLC | 0 | -100.00 | 0 | |||||
| 2025-08-07 | 13F | Addison Advisors LLC | 995 | 947.37 | 25 | 1,150.00 | ||||
| 2025-08-01 | 13F | James Investment Research Inc | 13,800 | -6.76 | 351 | -6.42 | ||||
| 2025-08-15 | 13F | Howland Capital Management Llc | 338,675 | 1.73 | 8,606 | 2.21 | ||||
| 2025-07-25 | 13F | Stephens Consulting, LLC | 313 | 0.00 | 8 | 0.00 | ||||
| 2025-07-21 | 13F | Cornell Pochily Investment Advisors, Inc. | 8,045 | 204 | ||||||
| 2025-08-13 | 13F | Baird Financial Group, Inc. | 10,000 | 0.00 | 254 | 0.79 | ||||
| 2025-08-12 | 13F | Coldstream Capital Management Inc | 83,958 | 2.41 | 2,133 | 2.89 | ||||
| 2025-05-07 | 13F | Mb, Levis & Associates, Llc | 0 | -100.00 | 0 | -100.00 | ||||
| 2025-07-18 | 13F | Newman Dignan & Sheerar, Inc. | 48,256 | 0.00 | 1,226 | 0.49 | ||||
| 2025-08-04 | 13F | Assetmark, Inc | 20,448 | 110.20 | 520 | 110.98 | ||||
| 2025-08-07 | 13F | Sound View Wealth Advisors Group, LLC | 112,390 | 26.63 | 2,856 | 27.23 | ||||
| 2025-08-14 | 13F | Goldman Sachs Group Inc | 8,456 | -26.21 | 215 | -25.95 | ||||
| 2025-07-10 | 13F | Cypress Point Wealth Management, LLC | 119,536 | 0.00 | 3,037 | 0.46 | ||||
| 2025-08-11 | 13F | Principal Securities, Inc. | 20 | -86.49 | 1 | -100.00 | ||||
| 2025-07-02 | 13F | Crumly & Associates Inc. | 0 | -100.00 | 0 | |||||
| 2025-08-07 | 13F | Hughes Financial Services, LLC | 5,930 | 0.00 | 152 | 1.34 | ||||
| 2025-08-12 | 13F | Jpmorgan Chase & Co | 81,923 | 2,082 | ||||||
| 2025-08-15 | 13F | Kestra Advisory Services, LLC | 19,081 | 45.82 | 485 | 46.67 | ||||
| 2025-07-09 | 13F | Lbmc Investment Advisors, Llc | 375,752 | 17.16 | 9,548 | 17.72 | ||||
| 2025-07-21 | 13F | Exchange Capital Management, Inc. | 14,484 | -6.67 | 368 | -6.12 | ||||
| 2025-08-01 | 13F | Schmidt P J Investment Management Inc | 8,562 | 218 | ||||||
| 2025-07-17 | 13F | Janney Montgomery Scott LLC | 14,809 | -7.68 | 0 | |||||
| 2025-08-01 | 13F | Signature Wealth Management Group | 47,520 | 1.96 | 1,207 | 2.46 | ||||
| 2025-08-14 | 13F | Glenview Trust Co | 36,400 | 0.00 | 925 | 0.43 | ||||
| 2025-07-18 | 13F | TPG Advisors LLC | 9,143 | 0.00 | 232 | 0.43 | ||||
| 2025-04-15 | 13F | Collier Financial | 402 | 0.50 | 10 | 0.00 | ||||
| 2025-05-05 | 13F | Creekmur Asset Management LLC | 0 | -100.00 | 0 | |||||
| 2025-08-14 | 13F | Godshalk Welsh Capital Management, Inc. | 25,750 | 128.89 | 654 | 130.28 |