Basic Stats
| Institutional Owners | 127 total, 123 long only, 1 short only, 3 long/short - change of 2.40% MRQ |
| Average Portfolio Allocation | 0.2807 % - change of 7.12% MRQ |
| Institutional Shares (Long) | 16,862,291 (ex 13D/G) - change of 0.51MM shares 3.09% MRQ |
| Institutional Value (Long) | $ 299,577 USD ($1000) |
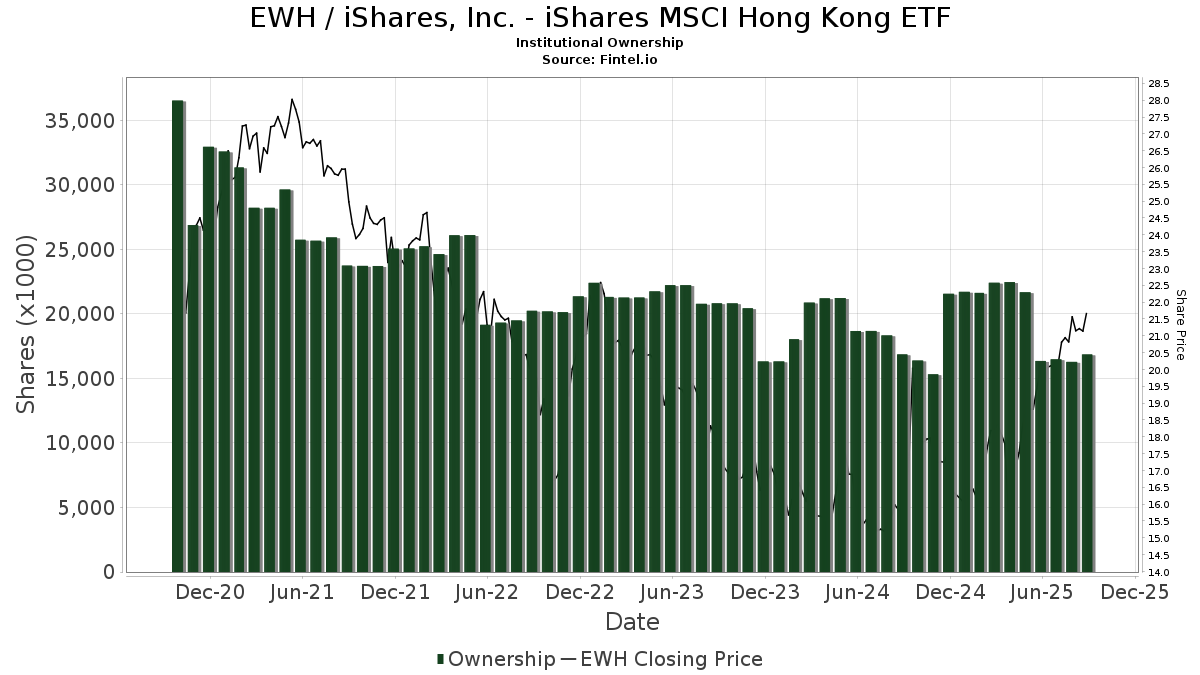
Institutional Ownership and Shareholders
iShares, Inc. - iShares MSCI Hong Kong ETF (US:EWH) has 127 institutional owners and shareholders that have filed 13D/G or 13F forms with the Securities Exchange Commission (SEC). These institutions hold a total of 16,862,291 shares. Largest shareholders include Wright Fund Managment, LLC, Morgan Stanley, Bank Julius Baer & Co. Ltd, Zurich, SG Americas Securities, LLC, D. E. Shaw & Co., Inc., Catalyst Capital Advisors LLC, MBXAX - Catalyst/Millburn Hedge Strategy Fund Class A, Millburn Ridgefield Corp, Northern Lights Fund Trust - Sierra Tactical Risk Spectrum 50 Fund Investor Class, and Quadrature Capital Ltd .
iShares, Inc. - iShares MSCI Hong Kong ETF (ARCA:EWH) institutional ownership structure shows current positions in the company by institutions and funds, as well as latest changes in position size. Major shareholders can include individual investors, mutual funds, hedge funds, or institutions. The Schedule 13D indicates that the investor holds (or held) more than 5% of the company and intends (or intended) to actively pursue a change in business strategy. Schedule 13G indicates a passive investment of over 5%.
The share price as of September 5, 2025 is 21.18 / share. Previously, on September 6, 2024, the share price was 15.82 / share. This represents an increase of 33.88% over that period.
Fund Sentiment Score
The Fund Sentiment Score (fka Ownership Accumulation Score) finds the stocks that are being most bought by funds. It is the result of a sophisticated, multi-factor quantitative model that identifies companies with the highest levels of institutional accumulation. The scoring model uses a combination of the total increase in disclosed owners, the changes in portfolio allocations in those owners and other metrics. The number ranges from 0 to 100, with higher numbers indicating a higher level of accumulation to its peers, and 50 being the average.
Update Frequency: Daily
See Ownership Explorer, which provides a list of highest-ranking companies.
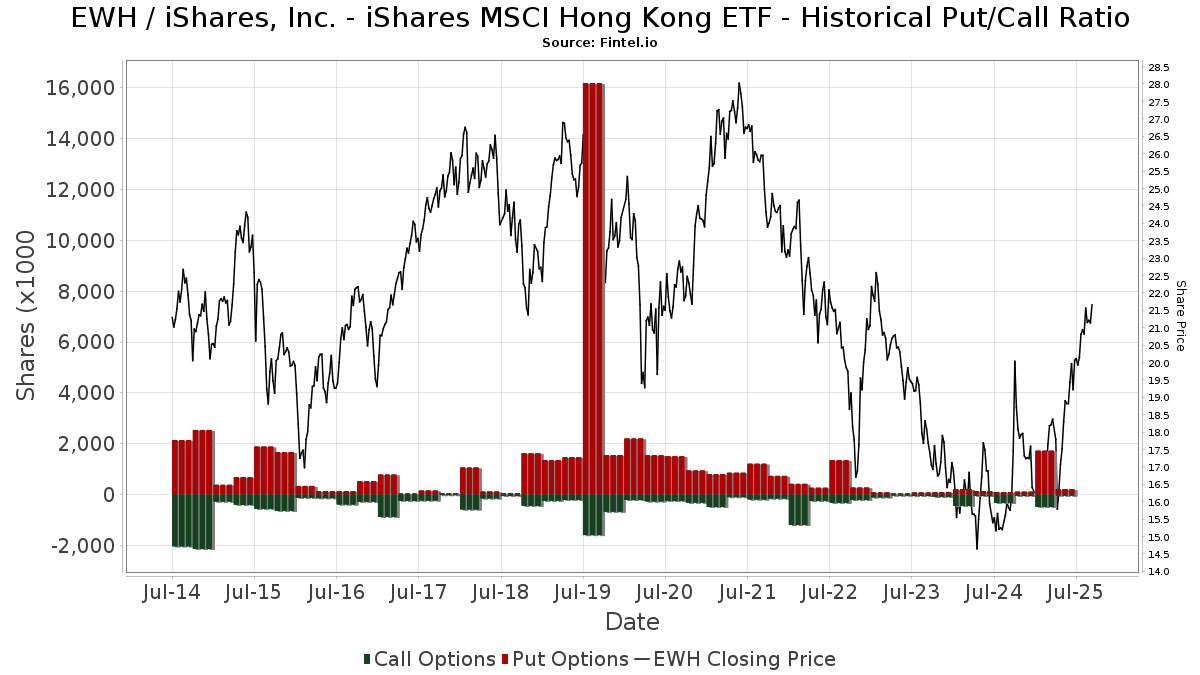
Institutional Put/Call Ratio
In addition to reporting standard equity and debt issues, institutions with more than 100MM assets under management must also disclose their put and call option holdings. Since put options generally indicate negative sentiment, and call options indicate positive sentiment, we can get a sense of the overall institutional sentiment by plotting the ratio of puts to calls. The chart to the right plots the historical put/call ratio for this instrument.
Using Put/Call Ratio as an indicator of investor sentiment overcomes one of the key deficiencies of using total institutional ownership, which is that a significant amount of assets under management are invested passively to track indices. Passively-managed funds do not typically buy options, so the put/call ratio indicator more closely tracks the sentiment of actively-managed funds.
13F and NPORT Filings
Detail on 13F filings are free. Detail on NP filings require a premium membership. Green rows indicate new positions. Red rows indicate closed positions. Click the link icon to see the full transaction history.
Upgrade
to unlock premium data and export to Excel ![]() .
.
| File Date | Source | Investor | Type | Avg Price (Est) |
Shares | Δ Shares (%) |
Reported Value ($1000) |
Δ Value (%) |
Port Alloc (%) |
|
|---|---|---|---|---|---|---|---|---|---|---|
| 2025-08-12 | 13F | MAI Capital Management | 208 | 1.96 | 4 | 33.33 | ||||
| 2025-07-08 | 13F | Parallel Advisors, LLC | 500 | 0.00 | 10 | 12.50 | ||||
| 2025-08-14 | 13F | SummitTX Capital, L.P. | 11,200 | 222 | ||||||
| 2025-08-14 | 13F | Wellington Management Group Llp | 54,028 | 243.62 | 1,073 | 289.82 | ||||
| 2025-08-13 | 13F | Barclays Plc | Put | 0 | -100.00 | 0 | ||||
| 2025-07-23 | 13F | Viewpoint Capital Management LLC | 6,241 | 0.00 | 124 | 12.84 | ||||
| 2025-08-14 | 13F | Ameriprise Financial Inc | 76,862 | -60.42 | 4,229 | 24.38 | ||||
| 2025-04-16 | 13F | Wealth Enhancement Advisory Services, Llc | Put | 0 | -100.00 | 0 | ||||
| 2025-08-12 | 13F | Zacks Investment Management | 21,664 | 430 | ||||||
| 2025-08-11 | 13F | Rahlfs Capital, Llc | 11,050 | 219 | ||||||
| 2025-07-10 | 13F | Wealth Enhancement Advisory Services, Llc | 15,937 | 0.31 | 321 | 15.47 | ||||
| 2025-08-14 | 13F | Fmr Llc | 5,916 | 8.91 | 117 | 23.16 | ||||
| 2025-08-13 | 13F | Scotia Capital Inc. | 16,352 | 325 | ||||||
| 2025-08-14 | 13F | Quantitative Investment Management, LLC | 59,004 | 1 | ||||||
| 2025-08-04 | 13F | JDM Financial Group LLC | 550 | 0.00 | 11 | 11.11 | ||||
| 2025-08-06 | 13F | Pekin Hardy Strauss, Inc. | 0 | -100.00 | 0 | |||||
| 2025-03-26 | NP | MNERX - MainStay Conservative ETF Allocation Fund Class R3 | 61,191 | 9.50 | 1,010 | 1.10 | ||||
| 2025-05-29 | NP | Northern Lights Fund Trust - Sierra Tactical Risk Spectrum 70 Fund Investor Class | 152,100 | 2,663 | ||||||
| 2025-08-13 | 13F | Korea Investment CORP | 132,000 | 0.00 | 2,622 | 13.41 | ||||
| 2025-07-21 | 13F | J. Safra Sarasin Holding AG | 0 | -100.00 | 0 | |||||
| 2025-07-31 | 13F | Wright Fund Managment, LLC | 1,407,375 | 0.00 | 24,643 | 0.00 | ||||
| 2025-08-12 | 13F | Elo Mutual Pension Insurance Co | 504,498 | 0.00 | 10,019 | 13.43 | ||||
| 2025-08-05 | 13F | Huntington National Bank | 0 | |||||||
| 2025-05-29 | NP | SIRAX - Sierra Tactical All Asset Fund Class A | 517,500 | 9,061 | ||||||
| 2025-07-29 | 13F | Tradewinds Capital Management, LLC | 102 | 0.00 | 2 | 100.00 | ||||
| 2025-07-31 | 13F | Glass Jacobson Investment Advisors llc | 1,925 | 0.00 | 38 | 18.75 | ||||
| 2025-08-14 | 13F/A | Bank Julius Baer & Co. Ltd, Zurich | 1,210,055 | 24,032 | ||||||
| 2025-07-22 | 13F | Chung Wu Investment Group, LLC | 8,500 | 169 | ||||||
| 2025-07-08 | 13F/A | Salem Investment Counselors Inc | 400 | 0.00 | 8 | 0.00 | ||||
| 2025-07-31 | 13F | Sharper & Granite LLC | 82,575 | -1.19 | 1,661 | 13.47 | ||||
| 2025-08-05 | 13F | Advisors Preferred, LLC | 1,411 | 28 | ||||||
| 2025-05-14 | 13F | Flow Traders U.s. Llc | 0 | -100.00 | 0 | |||||
| 2025-08-12 | 13F | CIBC Private Wealth Group, LLC | 0 | -100.00 | 0 | |||||
| 2025-08-14 | 13F | Federation des caisses Desjardins du Quebec | 144,176 | 3,780.92 | 2,863 | 4,373.44 | ||||
| 2025-08-13 | 13F | Mount Yale Investment Advisors, LLC | 138 | 3 | ||||||
| 2025-03-26 | NP | MWFQX - MainStay Equity ETF Allocation Fund Class R3 | 129,177 | 14.38 | 2,131 | 5.60 | ||||
| 2025-05-13 | 13F | HighTower Advisors, LLC | 0 | -100.00 | 0 | |||||
| 2025-05-02 | 13F | Whittier Trust Co | 0 | -100.00 | 0 | |||||
| 2025-08-14 | 13F | UBS Group AG | 428,667 | -45.34 | 8,513 | -38.01 | ||||
| 2025-07-07 | 13F | Upper Left Wealth Management, LLC | 14,066 | 2.55 | 279 | 16.25 | ||||
| 2025-04-22 | 13F | Cambridge Investment Research Advisors, Inc. | 0 | -100.00 | 0 | |||||
| 2025-07-30 | 13F | Exencial Wealth Advisors, Llc | 46,936 | 6.80 | 932 | 21.20 | ||||
| 2025-08-13 | 13F | Provida Pension Fund Administrator | 0 | -100.00 | 0 | -100.00 | ||||
| 2025-07-31 | 13F | Catalyst Capital Advisors LLC | 646,987 | -12.03 | 12,849 | -0.23 | ||||
| 2025-08-29 | NP | MBXAX - Catalyst/Millburn Hedge Strategy Fund Class A | 646,987 | -12.03 | 12,849 | -0.23 | ||||
| 2025-08-29 | NP | CGHIX - Timber Point Global Allocations Fund Institutional Class Shares | 10,000 | -50.00 | 199 | -43.43 | ||||
| 2025-08-15 | 13F | Morgan Stanley | 1,212,315 | -14.04 | 24,077 | -2.51 | ||||
| 2025-08-12 | 13F | Picton Mahoney Asset Management | 5,970 | -21.24 | 0 | |||||
| 2025-08-14 | 13F | Royal Bank Of Canada | 117,644 | 85.41 | 2,335 | 110.17 | ||||
| 2025-07-31 | 13F | United Community Bank | 0 | -100.00 | 0 | |||||
| 2025-08-12 | 13F | BlackRock, Inc. | 42,251 | -95.07 | 839 | -94.41 | ||||
| 2025-08-13 | 13F | Hsbc Holdings Plc | 12,720 | -4.68 | 253 | 8.15 | ||||
| 2025-08-13 | 13F | National Bank Of Canada /fi/ | 0 | -100.00 | 0 | |||||
| 2025-08-12 | 13F | LPL Financial LLC | 30,307 | -55.28 | 602 | -49.33 | ||||
| 2025-08-14 | 13F | Kovitz Investment Group Partners, LLC | 94,548 | 62.56 | 1,878 | 84.38 | ||||
| 2025-06-26 | NP | SSXU - Day Hagan/Ned Davis Research Smart Sector International ETF | 128,246 | 2,247 | ||||||
| 2025-07-11 | 13F | Farther Finance Advisors, LLC | 3,600 | 0.00 | 71 | 12.70 | ||||
| 2025-09-04 | 13F/A | Advisor Group Holdings, Inc. | 16,234 | 20.02 | 323 | 36.44 | ||||
| 2025-04-22 | 13F | Moisand Fitzgerald Tamayo, LLC | 0 | -100.00 | 0 | |||||
| 2025-08-12 | 13F | Prudential Plc | 199,443 | 3,961 | ||||||
| 2025-08-13 | 13F | Walleye Trading LLC | Put | 0 | -100.00 | 0 | ||||
| 2025-08-14 | 13F | D. E. Shaw & Co., Inc. | 742,520 | 284.26 | 14,746 | 335.89 | ||||
| 2025-08-08 | 13F | Larson Financial Group LLC | 0 | -100.00 | 0 | |||||
| 2025-08-11 | 13F | Aptus Capital Advisors, LLC | 268 | 5 | ||||||
| 2025-08-13 | 13F | Jones Financial Companies Lllp | 214 | -38.86 | 4 | -33.33 | ||||
| 2025-08-13 | 13F | Quadrature Capital Ltd | 564,759 | -13.02 | 11,219 | -1.39 | ||||
| 2025-08-14 | 13F | Prelude Capital Management, Llc | 0 | -100.00 | 0 | |||||
| 2025-08-14 | 13F | Citadel Advisors Llc | Put | 20,400 | 29.94 | 405 | 47.81 | |||
| 2025-05-08 | 13F | New York Life Investment Management Llc | 0 | -100.00 | 0 | |||||
| 2025-07-24 | 13F | Blair William & Co/il | 2,896 | -22.21 | 58 | -12.31 | ||||
| 2025-07-21 | 13F | Mirae Asset Global Investments Co., Ltd. | 27,834 | 316.74 | 553 | 371.79 | ||||
| 2025-07-10 | 13F | Contravisory Investment Management, Inc. | 25,720 | 511 | ||||||
| 2025-08-14 | 13F | Citadel Advisors Llc | Call | 16,800 | -93.32 | 334 | -92.44 | |||
| 2025-08-14 | 13F | Susquehanna International Group, Llp | Call | 0 | -100.00 | 0 | ||||
| 2025-08-28 | NP | TFAFX - Tactical Growth Allocation Fund Class I | 1,600 | 32 | ||||||
| 2025-08-05 | 13F | Harel Insurance Investments & Financial Services Ltd. | 5,000 | 108.33 | 0 | |||||
| 2025-08-14 | 13F | Raymond James Financial Inc | 322,199 | -16.08 | 6,399 | -4.82 | ||||
| 2025-07-16 | 13F | Banque Pictet & Cie Sa | 215,913 | 0.00 | 4,288 | 13.44 | ||||
| 2025-07-28 | 13F | Harbour Investments, Inc. | 556 | 0.00 | 11 | 22.22 | ||||
| 2025-08-06 | 13F | Golden State Wealth Management, LLC | 115 | 0.00 | 2 | 0.00 | ||||
| 2025-05-14 | 13F | Walleye Trading LLC | 0 | -100.00 | 0 | -100.00 | ||||
| 2025-08-12 | 13F | O'shaughnessy Asset Management, Llc | 220 | -37.85 | 4 | -33.33 | ||||
| 2025-08-06 | 13F | Commonwealth Equity Services, Llc | 26,525 | 12.75 | 1 | |||||
| 2025-08-08 | 13F | Foundations Investment Advisors, LLC | 0 | -100.00 | 0 | |||||
| 2025-06-26 | NP | BlackRock ETF Trust - iShares International Country Rotation Active ETF | 2,415 | -27.24 | 42 | -22.22 | ||||
| 2025-08-14 | 13F | CIBC World Markets Inc. | 476,469 | -1.35 | 9,463 | 11.88 | ||||
| 2025-08-28 | NP | ICCIX - Dynamic International Opportunity Fund Class I | 29,101 | -19.19 | 578 | -8.41 | ||||
| 2025-08-13 | 13F | Invesco Ltd. | 10,233 | -7.18 | 203 | 5.18 | ||||
| 2025-04-25 | 13F | Mmbg Investment Advisors Co. | 0 | -100.00 | 0 | |||||
| 2025-03-26 | NP | MDAKX - MainStay Moderate ETF Allocation Fund Class C | 194,616 | 11.09 | 3,211 | 2.59 | ||||
| 2025-08-18 | 13F | Wolverine Trading, Llc | Call | 0 | -100.00 | 0 | ||||
| 2025-07-23 | 13F | Vontobel Holding Ltd. | 333,736 | -1.18 | 6,628 | 12.08 | ||||
| 2025-07-28 | 13F | Twin Tree Management, LP | 0 | -100.00 | 0 | |||||
| 2025-08-06 | 13F | Texas Yale Capital Corp. | 0 | -100.00 | 0 | |||||
| 2025-08-12 | 13F | Rhumbline Advisers | 1,431 | 0.00 | 28 | 12.00 | ||||
| 2025-08-13 | 13F | Taikang Asset Management (Hong Kong) Co Ltd | 55,029 | 0.00 | 1,093 | 13.40 | ||||
| 2025-08-13 | 13F | Capital Fund Management S.a. | 33,788 | 49.29 | 671 | 69.44 | ||||
| 2025-08-05 | 13F | Sigma Planning Corp | 24,004 | 33.87 | 477 | 52.08 | ||||
| 2025-05-15 | 13F | Optiver Holding B.V. | 0 | -100.00 | 0 | -100.00 | ||||
| 2025-08-14 | 13F | Glen Eagle Advisors, LLC | 58 | 1 | ||||||
| 2025-08-11 | 13F | TD Waterhouse Canada Inc. | 1,455 | 0.00 | 29 | 12.00 | ||||
| 2025-08-12 | 13F | Steward Partners Investment Advisory, Llc | 616 | 0.00 | 12 | 20.00 | ||||
| 2025-07-22 | 13F | 4Thought Financial Group Inc. | 184 | 3.37 | 4 | 0.00 | ||||
| 2025-08-08 | 13F | Creative Planning | 10,553 | -0.01 | 210 | 13.59 | ||||
| 2025-08-14 | 13F | Susquehanna International Group, Llp | Put | 10,100 | -79.72 | 201 | -77.04 | |||
| 2025-08-05 | 13F | Castlekeep Investment Advisors Llc | 20,757 | -3.42 | 412 | 9.57 | ||||
| 2025-08-14 | 13F | Susquehanna International Group, Llp | 12,229 | -92.56 | 243 | -91.59 | ||||
| 2025-08-14 | 13F | Tudor Investment Corp Et Al | 0 | -100.00 | 0 | |||||
| 2025-08-13 | 13F | Capital Fund Management S.a. | Call | 14,400 | -54.29 | 286 | -48.28 | |||
| 2025-05-15 | 13F | Dai-ichi Life Holdings, Inc. | 0 | -100.00 | 0 | |||||
| 2025-08-14 | 13F | Hrt Financial Lp | 179,958 | 4 | ||||||
| 2025-08-08 | 13F | SG Americas Securities, LLC | 1,195,271 | 738.32 | 24 | 1,050.00 | ||||
| 2025-08-13 | 13F | Marshall Wace, Llp | 43,000 | 854 | ||||||
| 2025-07-14 | 13F | Legacy Capital Group California, Inc. | 25,470 | 506 | ||||||
| 2025-08-14 | 13F | Bnp Paribas Arbitrage, Sa | 63,032 | -49.05 | 1,252 | -42.24 | ||||
| 2025-08-11 | 13F | Covestor Ltd | 7 | 0.00 | 0 | |||||
| 2025-08-14 | 13F | Evergreen Capital Management Llc | 124,720 | 6.09 | 2,477 | 20.31 | ||||
| 2025-08-06 | 13F | Prospera Financial Services Inc | 0 | -100.00 | 0 | |||||
| 2025-08-12 | 13F | Barings Llc | 208,539 | -8.67 | 4,142 | 3.58 | ||||
| 2025-07-29 | 13F | Millburn Ridgefield Corp | 646,987 | -12.03 | 12,849 | -0.23 | ||||
| 2025-08-13 | 13F | Baker Avenue Asset Management, LP | Put | 150,000 | -55.88 | 8 | -97.92 | |||
| 2025-05-07 | 13F | Drive Wealth Management, Llc | 0 | -100.00 | 0 | |||||
| 2025-08-14 | 13F | Citadel Advisors Llc | 0 | -100.00 | 0 | |||||
| 2025-08-05 | 13F | Bank Of Montreal /can/ | 81,957 | 0.28 | 1,628 | 13.70 | ||||
| 2025-08-13 | 13F | Cresset Asset Management, LLC | 29,020 | 8.78 | 576 | 23.34 | ||||
| 2025-08-06 | 13F | Innealta Capital, Llc | 29,101 | -19.19 | 578 | -8.41 | ||||
| 2025-08-14 | 13F | Jane Street Group, Llc | 544,097 | -22.59 | 10,806 | -12.21 | ||||
| 2025-08-14 | 13F | Gotham Asset Management, LLC | 10,426 | 0.00 | 207 | 13.74 | ||||
| 2025-08-13 | 13F | Idaho Trust Bank | 29,514 | 25.87 | 586 | 42.93 | ||||
| 2025-08-14 | 13F | Group One Trading, L.p. | 9,036 | 179 | ||||||
| 2025-08-27 | 13F/A | Squarepoint Ops LLC | 48,311 | 29.52 | 959 | 46.86 | ||||
| 2025-08-14 | 13F | Old Mission Capital Llc | 0 | -100.00 | 0 | |||||
| 2025-08-15 | 13F | Tower Research Capital LLC (TRC) | 1,837 | -37.81 | 36 | -41.94 | ||||
| 2025-08-12 | 13F | Jpmorgan Chase & Co | 192,022 | -3.68 | 3,814 | 9.26 | ||||
| 2025-07-31 | 13F | GenTrust, LLC | 20,561 | 6.03 | 408 | 20.35 | ||||
| 2025-08-14 | 13F | Comerica Bank | 1,112 | 11.87 | 22 | 29.41 | ||||
| 2025-08-05 | 13F | Tsfg, Llc | 500 | 0.00 | 0 | |||||
| 2025-08-12 | 13F | Proequities, Inc. | 0 | 0 | ||||||
| 2025-08-13 | 13F | Walleye Trading LLC | Call | 0 | -100.00 | 0 | ||||
| 2025-08-08 | 13F | Abc Arbitrage Sa | 17,827 | -80.52 | 354 | -77.90 | ||||
| 2025-07-29 | NP | HFND - Unlimited HFND Multi-Strategy Return Tracker ETF | 2,959 | 866.99 | 56 | 1,020.00 | ||||
| 2025-08-14 | 13F | Qube Research & Technologies Ltd | 927 | -98.35 | 18 | -98.17 | ||||
| 2025-07-17 | 13F | Albion Financial Group /ut | 63,000 | 0.00 | 1,251 | 13.42 | ||||
| 2025-08-13 | 13F | Renaissance Technologies Llc | 434,900 | 76.22 | 8,637 | 99.88 | ||||
| 2025-08-11 | 13F | Citigroup Inc | 26,239 | -72.07 | 521 | -68.33 | ||||
| 2025-07-18 | 13F | USA Financial Portformulas Corp | 7,706 | -38.75 | 153 | -30.45 | ||||
| 2025-08-11 | 13F | Principal Securities, Inc. | 29 | 1 | ||||||
| 2025-03-26 | NP | MOEAX - MainStay Growth ETF Allocation Fund Class A | 163,359 | 11.17 | 2,695 | 2.67 | ||||
| 2025-08-05 | 13F | Gould Asset Management Llc /ca/ | 39,511 | -3.26 | 785 | 9.65 | ||||
| 2025-08-07 | 13F | Allworth Financial LP | 20 | 0.00 | 0 | |||||
| 2025-08-14 | 13F | Two Sigma Securities, Llc | 17,106 | -68.19 | 340 | -63.97 | ||||
| 2025-05-29 | NP | Northern Lights Fund Trust - Sierra Tactical Core Growth Fund Investor Class Shares | 26,075 | 457 | ||||||
| 2025-05-29 | NP | Northern Lights Fund Trust - Sierra Tactical Risk Spectrum 50 Fund Investor Class | 568,800 | 9,960 | ||||||
| 2025-08-14 | 13F | Jane Street Group, Llc | Put | 33,500 | 665 | |||||
| 2025-07-24 | 13F | Cyndeo Wealth Partners, LLC | 15,626 | -2.78 | 310 | 10.32 | ||||
| 2025-08-14 | 13F | Wells Fargo & Company/mn | 165,021 | 382.84 | 3,277 | 447.99 | ||||
| 2025-05-15 | 13F | Barclays Plc | 0 | -100.00 | 0 | |||||
| 2025-08-14 | 13F | Integrated Wealth Concepts LLC | 54,406 | -41.23 | 1,080 | -33.33 | ||||
| 2025-05-01 | 13F | Cwm, Llc | 0 | -100.00 | 0 | |||||
| 2025-08-12 | 13F | BlackRock, Inc. | Put | 0 | -100.00 | 0 | -100.00 | |||
| 2025-08-14 | 13F | Horizon Investments, LLC | 27 | 107.69 | 1 | |||||
| 2025-08-14 | 13F | Goldman Sachs Group Inc | 87,564 | -46.51 | 1,739 | -39.32 | ||||
| 2025-05-29 | NP | Northern Lights Fund Trust - Sierra Tactical Risk Spectrum 30 Fund Instl Class | 142,900 | 2,502 | ||||||
| 2025-08-08 | NP | QALTX - Quantified Alternative Investment Fund Investor Class Shares | 1,411 | 28 | ||||||
| 2025-08-13 | 13F | Amundi | 23,414 | 7.90 | 471 | 24.01 | ||||
| 2025-08-12 | 13F | Atlas Capital Advisors Llc | 0 | -100.00 | 0 | |||||
| 2025-08-14 | 13F | Bank Of America Corp /de/ | 70,005 | -21.62 | 1,390 | -11.07 | ||||
| 2025-08-12 | 13F | XTX Topco Ltd | 15,828 | 314 | ||||||
| 2025-08-14 | 13F | Headlands Technologies LLC | 0 | -100.00 | 0 | -100.00 | ||||
| 2025-04-28 | 13F | Pictet North America Advisors SA | 0 | -100.00 | 0 | |||||
| 2025-07-16 | 13F/A | CX Institutional | 584 | -32.56 | 0 | |||||
| 2025-05-15 | 13F | Crestline Management, LP | 0 | -100.00 | 0 |