Basic Stats
| Institutional Owners | 182 total, 181 long only, 0 short only, 1 long/short - change of 1.10% MRQ |
| Average Portfolio Allocation | 0.1502 % - change of 60.47% MRQ |
| Institutional Shares (Long) | 28,114,875 (ex 13D/G) - change of -3.65MM shares -11.50% MRQ |
| Institutional Value (Long) | $ 1,375,415 USD ($1000) |
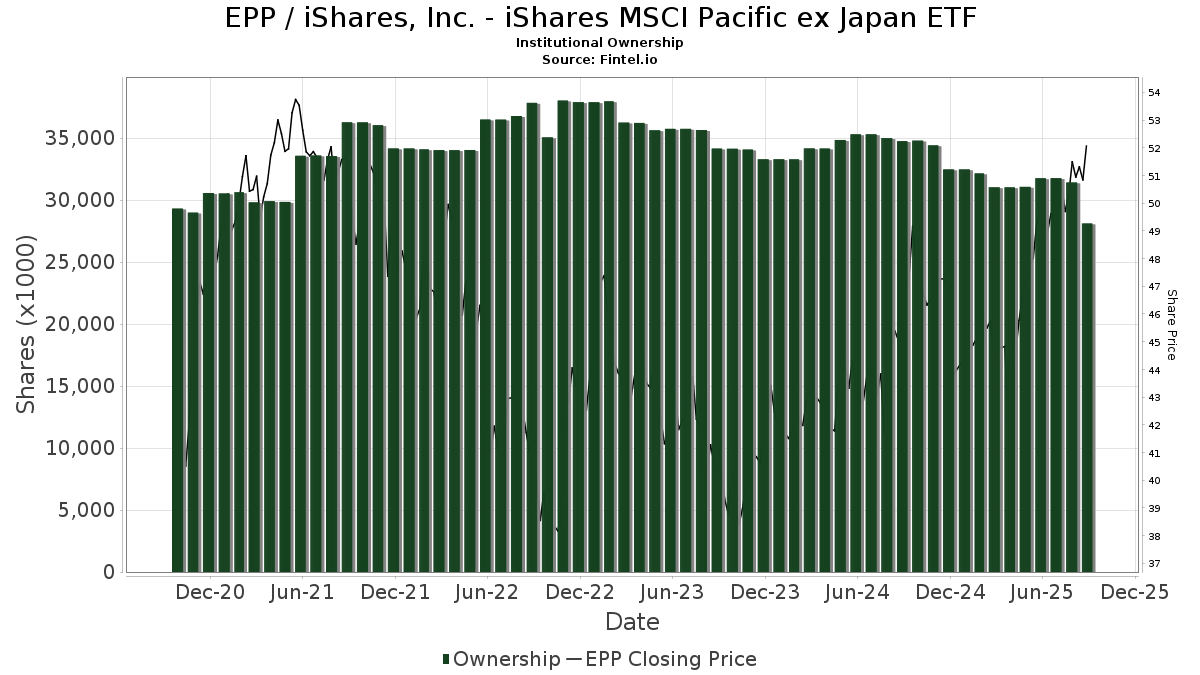
Institutional Ownership and Shareholders
iShares, Inc. - iShares MSCI Pacific ex Japan ETF (US:EPP) has 182 institutional owners and shareholders that have filed 13D/G or 13F forms with the Securities Exchange Commission (SEC). These institutions hold a total of 28,114,875 shares. Largest shareholders include Jpmorgan Chase & Co, Goldman Sachs Group Inc, Bank Of America Corp /de/, BlackRock, Inc., Asset Management One Co., Ltd., Morgan Stanley, UBS Group AG, Deutsche Bank Ag\, Prudential Plc, and Royal Bank Of Canada .
iShares, Inc. - iShares MSCI Pacific ex Japan ETF (ARCA:EPP) institutional ownership structure shows current positions in the company by institutions and funds, as well as latest changes in position size. Major shareholders can include individual investors, mutual funds, hedge funds, or institutions. The Schedule 13D indicates that the investor holds (or held) more than 5% of the company and intends (or intended) to actively pursue a change in business strategy. Schedule 13G indicates a passive investment of over 5%.
The share price as of September 5, 2025 is 51.42 / share. Previously, on September 9, 2024, the share price was 45.29 / share. This represents an increase of 13.53% over that period.
Fund Sentiment Score
The Fund Sentiment Score (fka Ownership Accumulation Score) finds the stocks that are being most bought by funds. It is the result of a sophisticated, multi-factor quantitative model that identifies companies with the highest levels of institutional accumulation. The scoring model uses a combination of the total increase in disclosed owners, the changes in portfolio allocations in those owners and other metrics. The number ranges from 0 to 100, with higher numbers indicating a higher level of accumulation to its peers, and 50 being the average.
Update Frequency: Daily
See Ownership Explorer, which provides a list of highest-ranking companies.
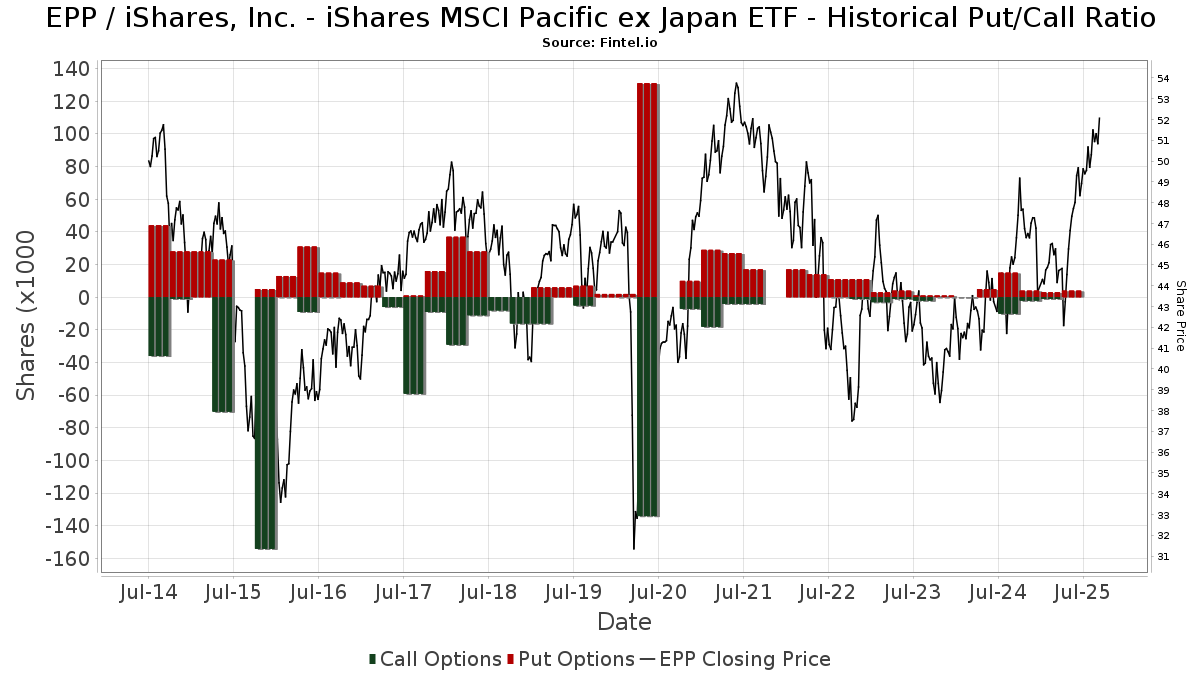
Institutional Put/Call Ratio
In addition to reporting standard equity and debt issues, institutions with more than 100MM assets under management must also disclose their put and call option holdings. Since put options generally indicate negative sentiment, and call options indicate positive sentiment, we can get a sense of the overall institutional sentiment by plotting the ratio of puts to calls. The chart to the right plots the historical put/call ratio for this instrument.
Using Put/Call Ratio as an indicator of investor sentiment overcomes one of the key deficiencies of using total institutional ownership, which is that a significant amount of assets under management are invested passively to track indices. Passively-managed funds do not typically buy options, so the put/call ratio indicator more closely tracks the sentiment of actively-managed funds.
13F and NPORT Filings
Detail on 13F filings are free. Detail on NP filings require a premium membership. Green rows indicate new positions. Red rows indicate closed positions. Click the link icon to see the full transaction history.
Upgrade
to unlock premium data and export to Excel ![]() .
.
| File Date | Source | Investor | Type | Avg Price (Est) |
Shares | Δ Shares (%) |
Reported Value ($1000) |
Δ Value (%) |
Port Alloc (%) |
|
|---|---|---|---|---|---|---|---|---|---|---|
| 2025-08-12 | 13F | MAI Capital Management | 90 | 4 | ||||||
| 2025-08-14 | 13F | BTG Pactual Asset Management US LLC | 79,459 | -0.17 | 3,923 | 11.74 | ||||
| 2025-08-12 | 13F | O'shaughnessy Asset Management, Llc | 561 | -8.33 | 28 | 3.85 | ||||
| 2025-08-13 | 13F | Flow Traders U.s. Llc | 114,179 | 6 | ||||||
| 2025-07-31 | 13F | Brinker Capital Investments, LLC | 0 | -100.00 | 0 | -100.00 | ||||
| 2025-07-10 | 13F | Wealth Enhancement Advisory Services, Llc | 5,945 | 0.00 | 295 | 12.60 | ||||
| 2025-08-13 | 13F | Forthright Family Wealth Advisory LLC | 0 | -100.00 | 0 | |||||
| 2025-07-24 | 13F | Us Bancorp \de\ | 3,283 | 1.64 | 162 | 14.08 | ||||
| 2025-09-04 | 13F/A | Advisor Group Holdings, Inc. | 39,846 | 16.84 | 1,967 | 30.87 | ||||
| 2025-08-14 | 13F | Raymond James Financial Inc | 74,480 | -40.01 | 3,677 | -32.84 | ||||
| 2025-08-14 | 13F | Wharton Business Group, LLC | 7,127 | -5.75 | 0 | |||||
| 2025-08-14 | 13F | Fmr Llc | 3,199 | 13.40 | 158 | 26.61 | ||||
| 2025-08-05 | 13F | Huntington National Bank | 296 | 12.12 | ||||||
| 2025-08-14 | 13F | Ancora Advisors, LLC | 1,100 | 0.00 | 54 | 12.50 | ||||
| 2025-07-31 | 13F | Glass Jacobson Investment Advisors llc | 225 | 0.00 | 11 | 22.22 | ||||
| 2025-07-17 | 13F | City Holding Co | 0 | -100.00 | 0 | |||||
| 2025-07-21 | 13F | Synergy Financial Management, LLC | 8,536 | 421 | ||||||
| 2025-08-14 | 13F | Syon Capital Llc | 147,298 | 48.08 | 7,272 | 65.80 | ||||
| 2025-08-14 | 13F | Aberdeen Wealth Management LLC | 300 | 15 | ||||||
| 2025-08-18 | 13F/A | National Bank Of Canada /fi/ | 190 | 0.00 | 9 | 12.50 | ||||
| 2025-07-31 | 13F | Asset Management One Co., Ltd. | 1,494,651 | 0.80 | 73,791 | 12.84 | ||||
| 2025-07-24 | 13F | Lmcg Investments, Llc | 90,740 | -4.86 | 4,480 | 6.49 | ||||
| 2025-08-13 | 13F | Northwestern Mutual Wealth Management Co | 5,426 | -73.90 | 268 | -70.85 | ||||
| 2025-07-08 | 13F/A | Salem Investment Counselors Inc | 40 | 0.00 | 2 | 0.00 | ||||
| 2025-08-08 | 13F | SBI Securities Co., Ltd. | 6,167 | 6.16 | 304 | 18.75 | ||||
| 2025-08-14 | 13F | Quantinno Capital Management LP | 5,841 | 4.62 | 288 | 17.07 | ||||
| 2025-05-14 | 13F | Renaissance Technologies Llc | 0 | -100.00 | 0 | -100.00 | ||||
| 2025-08-28 | NP | Northern Lights Fund Trust - Sierra Tactical Risk Spectrum 70 Fund Investor Class | 39,900 | 1,970 | ||||||
| 2025-07-09 | 13F | Massmutual Trust Co Fsb/adv | 15,320 | -4.00 | 756 | 7.54 | ||||
| 2025-08-07 | 13F/A | Curat Global, LLC | 9,368 | 0.00 | 462 | 11.86 | ||||
| 2025-08-12 | 13F | Stelac Advisory Services LLC | 48,101 | 0.00 | 2,375 | 11.82 | ||||
| 2025-08-01 | 13F | Biltmore Family Office, LLC | 5,178 | 0.00 | 256 | 11.84 | ||||
| 2025-08-14 | 13F | Federation des caisses Desjardins du Quebec | 270 | 0.00 | 13 | 18.18 | ||||
| 2025-08-14 | 13F | Hilltop Holdings Inc. | 40,077 | 1,979 | ||||||
| 2025-04-11 | 13F | Ehrlich Financial Group | 0 | -100.00 | 0 | -100.00 | ||||
| 2025-07-24 | 13F | Jfs Wealth Advisors, Llc | 250 | 0.00 | 12 | 9.09 | ||||
| 2025-08-11 | 13F | HighTower Advisors, LLC | 8,936 | -39.92 | 441 | -32.67 | ||||
| 2025-08-12 | 13F | LPL Financial LLC | 91,323 | 29.26 | 4,509 | 44.72 | ||||
| 2025-08-04 | 13F | Keybank National Association/oh | 14,587 | -7.72 | 720 | 3.30 | ||||
| 2025-08-08 | 13F | VERITY Wealth Advisors | 5,740 | 0.00 | 283 | 11.86 | ||||
| 2025-08-14 | 13F | Stifel Financial Corp | 17,523 | 865 | ||||||
| 2025-08-12 | 13F | Archer Investment Corp | 69 | 0.00 | 3 | 0.00 | ||||
| 2025-05-15 | 13F | GWM Advisors LLC | 0 | -100.00 | 0 | |||||
| 2025-08-19 | 13F | Delos Wealth Advisors, LLC | 112 | 6 | ||||||
| 2025-07-07 | 13F | Versant Capital Management, Inc | 12 | 0.00 | 1 | |||||
| 2025-08-12 | 13F | Prudential Plc | 293,500 | 14,490 | ||||||
| 2025-07-29 | 13F | Yoffe Investment Management, LLC | 8,163 | 0.00 | 403 | 12.26 | ||||
| 2025-07-08 | 13F | Parallel Advisors, LLC | 0 | -100.00 | 0 | |||||
| 2025-08-12 | 13F | Boreal Capital Management LLC | 545 | 27 | ||||||
| 2025-08-05 | 13F | Israel Discount Bank of New York | 6,740 | -1.12 | 333 | 10.67 | ||||
| 2025-08-13 | 13F | Northern Trust Corp | 7,319 | 361 | ||||||
| 2025-08-08 | 13F | Banco Bilbao Vizcaya Argentaria, S.a. | 40,615 | 0.00 | 2,004 | 11.65 | ||||
| 2025-08-12 | 13F | SRS Capital Advisors, Inc. | 250 | 0.00 | 12 | 9.09 | ||||
| 2025-07-24 | 13F | Blair William & Co/il | 11,035 | -5.61 | 545 | 5.63 | ||||
| 2025-04-22 | 13F | PFG Investments, LLC | 0 | -100.00 | 0 | |||||
| 2025-08-06 | 13F | Golden State Wealth Management, LLC | 54 | 3 | ||||||
| 2025-08-12 | 13F | Franklin Resources Inc | 2,000 | 99 | ||||||
| 2025-08-14 | 13F | Ameriprise Financial Inc | 93,302 | -13.05 | 4,605 | -2.72 | ||||
| 2025-08-14 | 13F/A | Skopos Labs, Inc. | 7,971 | 329 | ||||||
| 2025-08-12 | 13F | Insigneo Advisory Services, Llc | 4,768 | 235 | ||||||
| 2025-08-14 | 13F | DZ BANK AG Deutsche Zentral Genossenschafts Bank, Frankfurt am Main | 0 | -100.00 | 0 | |||||
| 2025-08-07 | 13F | Rathbone Brothers plc | 109,977 | -3.34 | 5,430 | 8.21 | ||||
| 2025-07-28 | 13F | BRYN MAWR TRUST Co | 2,806 | 10.08 | 139 | 23.21 | ||||
| 2025-05-09 | 13F | Wealthspire Advisors, LLC | 0 | -100.00 | 0 | |||||
| 2025-08-08 | 13F | Atlantic Trust, LLC | 43 | 2 | ||||||
| 2025-08-28 | NP | Northern Lights Fund Trust - Sierra Tactical Risk Spectrum 30 Fund Instl Class | 46,700 | 2,306 | ||||||
| 2025-08-08 | 13F | Gts Securities Llc | 11,538 | 7.23 | 570 | 20.04 | ||||
| 2025-07-23 | 13F | 1 North Wealth Services Llc | 1 | 0.00 | 0 | |||||
| 2025-08-14 | 13F | Susquehanna International Group, Llp | 29,134 | -66.15 | 1,438 | -62.11 | ||||
| 2025-07-23 | 13F | Integris Wealth Management, LLC | 39,577 | -1.34 | 1,954 | 10.40 | ||||
| 2025-08-14 | 13F | Susquehanna International Group, Llp | Put | 4,800 | 237 | |||||
| 2025-08-13 | 13F | Lido Advisors, LLC | 7,332 | -10.93 | 362 | -0.28 | ||||
| 2025-08-04 | 13F | AMG National Trust Bank | 5,451 | -3.11 | 269 | 8.47 | ||||
| 2025-08-07 | 13F | Resolute Advisors LLC | 21,145 | 1.79 | 1,044 | 13.86 | ||||
| 2025-08-05 | 13F | swisspartners Advisors Ltd | 11,225 | 5.75 | 554 | 33.57 | ||||
| 2025-07-08 | 13F | Nbc Securities, Inc. | 1,600 | -50.00 | 0 | |||||
| 2025-07-24 | 13F | Brandywine Oak Private Wealth Llc | 9,158 | 0.00 | 452 | 12.16 | ||||
| 2025-07-25 | 13F | Cwm, Llc | 491 | 29.89 | 0 | |||||
| 2025-07-24 | 13F | IFP Advisors, Inc | 579 | 0.00 | 29 | 12.00 | ||||
| 2025-08-14 | 13F | Blue Capital, Inc. | 0 | -100.00 | 0 | |||||
| 2025-07-17 | 13F | Park Place Capital Corp | 0 | -100.00 | 0 | |||||
| 2025-08-08 | 13F | Cetera Investment Advisers | 4,556 | 225 | ||||||
| 2025-08-15 | 13F | Kestra Advisory Services, LLC | 8,055 | -93.47 | 398 | -92.70 | ||||
| 2025-08-14 | 13F/A | Rockefeller Capital Management L.P. | 101,460 | -1.86 | 5,009 | 9.87 | ||||
| 2025-08-14 | 13F | Cooperman Leon G | 7,610 | 0.00 | 376 | 11.94 | ||||
| 2025-08-14 | 13F | Bnp Paribas Arbitrage, Sa | 12 | -99.95 | 1 | -100.00 | ||||
| 2025-08-14 | 13F | Citadel Advisors Llc | 74,919 | 278.25 | 3,699 | 323.60 | ||||
| 2025-08-01 | 13F | Bessemer Group Inc | 10,005 | 0.00 | 0 | |||||
| 2025-08-15 | 13F | CI Private Wealth, LLC | 48,503 | -42.93 | 2,395 | -36.13 | ||||
| 2025-04-23 | 13F | GHP Investment Advisors, Inc. | 0 | -100.00 | 0 | |||||
| 2025-08-14 | 13F | Citadel Advisors Llc | Call | 0 | -100.00 | 0 | ||||
| 2025-08-27 | 13F/A | Squarepoint Ops LLC | 10,809 | 534 | ||||||
| 2025-08-13 | 13F | Cerity Partners LLC | 26,786 | -1.84 | 1,322 | 9.89 | ||||
| 2025-08-05 | 13F | Tsfg, Llc | 31 | 0.00 | 0 | |||||
| 2025-07-24 | 13F | Robertson Stephens Wealth Management, LLC | 26,403 | 2.20 | 1,304 | 14.40 | ||||
| 2025-08-14 | 13F | Becker Capital Management Inc | 8,554 | 0.00 | 422 | 11.94 | ||||
| 2025-08-14 | 13F | Comerica Bank | 8,797 | -0.49 | 434 | 11.57 | ||||
| 2025-08-11 | 13F | TD Waterhouse Canada Inc. | 5,528 | 273 | ||||||
| 2025-08-12 | 13F | CIBC Private Wealth Group, LLC | 500 | 0.00 | 25 | 26.32 | ||||
| 2025-07-31 | 13F/A | Avion Wealth | 27 | 0.00 | 0 | |||||
| 2025-08-01 | 13F | Providence First Trust Co | 46,582 | -2.87 | 2,300 | 8.75 | ||||
| 2025-08-12 | 13F | Jpmorgan Chase & Co | 8,109,223 | -3.15 | 400,352 | 8.42 | ||||
| 2025-07-17 | 13F | Peoples Financial Services Corp. | 50 | 0.00 | 2 | 0.00 | ||||
| 2025-04-21 | 13F | Nelson, Van Denburg & Campbell Wealth Management Group, LLC | 0 | -100.00 | 0 | |||||
| 2025-08-08 | 13F | Pnc Financial Services Group, Inc. | 189,884 | -1.57 | 9,375 | 10.19 | ||||
| 2025-08-11 | 13F | Principal Securities, Inc. | 50 | 56.25 | 2 | 100.00 | ||||
| 2025-08-14 | 13F | Two Sigma Securities, Llc | 8,403 | 415 | ||||||
| 2025-05-15 | 13F | National Wealth Management Group, LLC | 0 | -100.00 | 0 | |||||
| 2025-08-14 | 13F | Bank Of America Corp /de/ | 3,131,894 | 29.72 | 154,622 | 45.22 | ||||
| 2025-07-25 | 13F | Johnson Investment Counsel Inc | 5,335 | 0.00 | 263 | 11.91 | ||||
| 2025-08-13 | 13F | Johnson Financial Group, Inc. | 21 | 1 | ||||||
| 2025-08-11 | 13F | Citigroup Inc | 167,455 | 20.71 | 8,267 | 35.15 | ||||
| 2025-07-31 | 13F | Money Design Co.,Ltd. | 0 | -100.00 | 0 | -100.00 | ||||
| 2025-08-13 | 13F | Amundi | 189,625 | 0.53 | 9,409 | 13.94 | ||||
| 2025-07-17 | 13F | Sound Income Strategies, LLC | 10 | -94.19 | 0 | -100.00 | ||||
| 2025-05-13 | 13F | Quadrature Capital Ltd | 0 | -100.00 | 0 | -100.00 | ||||
| 2025-08-26 | 13F/A | Thrivent Financial For Lutherans | 0 | -100.00 | 0 | -100.00 | ||||
| 2025-07-16 | 13F | Tru Independence Asset Management 2, Llc | 18,211 | 17.71 | 899 | 31.82 | ||||
| 2025-08-19 | 13F | Anchor Investment Management, LLC | 189 | 0.00 | 9 | 12.50 | ||||
| 2025-08-28 | NP | Northern Lights Fund Trust - Sierra Tactical Core Growth Fund Investor Class Shares | 8,265 | 408 | ||||||
| 2025-07-22 | 13F | Checchi Capital Advisers, LLC | 139,616 | 74.14 | 6,893 | 94.96 | ||||
| 2025-07-31 | 13F | Lee Danner & Bass Inc | 20,525 | 0.00 | 1,013 | 11.93 | ||||
| 2025-08-14 | 13F | Transamerica Financial Advisors, Inc. | 1,483 | -7.72 | 73 | |||||
| 2025-04-21 | 13F | Roman Butler Fullerton & Co | 0 | -100.00 | 0 | |||||
| 2025-04-23 | 13F | Professional Financial Advisors, LLC | 0 | -100.00 | 0 | |||||
| 2025-08-13 | 13F | Rsm Us Wealth Management Llc | 4,328 | 214 | ||||||
| 2025-08-14 | 13F | CoreCap Advisors, LLC | 0 | -100.00 | 0 | |||||
| 2025-08-28 | NP | Northern Lights Fund Trust - Sierra Tactical Risk Spectrum 50 Fund Investor Class | 138,600 | 6,843 | ||||||
| 2025-08-05 | 13F | Cherry Tree Wealth Management, LLC | 2,993 | 0.00 | 148 | 12.21 | ||||
| 2025-08-14 | 13F | Headlands Technologies LLC | 0 | -100.00 | 0 | -100.00 | ||||
| 2025-04-09 | 13F | Milestone Asset Management, Llc | 0 | -100.00 | 0 | |||||
| 2025-08-08 | 13F | Family Firm, Inc. | 0 | -100.00 | 0 | |||||
| 2025-08-07 | 13F | CENTRAL TRUST Co | 1,620 | 0.00 | 80 | 11.27 | ||||
| 2025-07-14 | 13F | Acropolis Investment Management, LLC | 0 | -100.00 | 0 | |||||
| 2025-08-01 | 13F | Envestnet Asset Management Inc | 70,037 | -3.12 | 3,458 | 8.47 | ||||
| 2025-08-15 | 13F | Tower Research Capital LLC (TRC) | 1,161 | 23,120.00 | 57 | |||||
| 2025-07-31 | 13F | Sharper & Granite LLC | 43,783 | 4.24 | 2,173 | 17.28 | ||||
| 2025-08-06 | 13F | First Horizon Advisors, Inc. | 9,285 | 0.00 | 458 | 11.98 | ||||
| 2025-07-10 | 13F | Global Financial Private Client, LLC | 0 | -100.00 | 0 | |||||
| 2025-07-15 | 13F | BigSur Wealth Management LLC | 1,730 | 0.00 | 85 | 11.84 | ||||
| 2025-08-06 | 13F | Savant Capital, LLC | 8,084 | 0.30 | 399 | 12.39 | ||||
| 2025-08-14 | 13F | Daiwa Securities Group Inc. | 15,660 | -10.15 | 1 | |||||
| 2025-08-08 | 13F | Fortis Group Advisors, LLC | 10 | 0.00 | 0 | |||||
| 2025-07-18 | 13F | SOA Wealth Advisors, LLC. | 493 | 1.86 | 24 | 14.29 | ||||
| 2025-08-07 | 13F | Montag A & Associates Inc | 6,900 | 0.00 | 341 | 11.84 | ||||
| 2025-07-16 | 13F | Signaturefd, Llc | 0 | -100.00 | 0 | -100.00 | ||||
| 2025-08-08 | 13F | Itau Unibanco Holding S.A. | 4,000 | -55.80 | 197 | |||||
| 2025-08-13 | 13F | Hsbc Holdings Plc | 86,496 | -0.05 | 4,270 | 11.90 | ||||
| 2025-08-12 | 13F | BlackRock, Inc. | 1,876,034 | -1.68 | 92,620 | 10.07 | ||||
| 2025-08-13 | 13F | EverSource Wealth Advisors, LLC | 6 | 0.00 | 0 | |||||
| 2025-07-18 | 13F | Truist Financial Corp | 39,527 | 1.68 | 1,951 | 13.83 | ||||
| 2025-08-14 | 13F | Kovitz Investment Group Partners, LLC | 55,581 | 2,744 | ||||||
| 2025-04-11 | 13F | Davis Capital Management | 90 | 0.00 | 4 | 0.00 | ||||
| 2025-08-12 | 13F | Coldstream Capital Management Inc | 0 | -100.00 | 0 | |||||
| 2025-08-13 | 13F | Jones Financial Companies Lllp | 90 | -71.43 | 4 | -69.23 | ||||
| 2025-07-11 | 13F | Farther Finance Advisors, LLC | 4,520 | -2.16 | 223 | 8.25 | ||||
| 2025-08-14 | 13F | Old Mission Capital Llc | 0 | -100.00 | 0 | |||||
| 2025-07-08 | 13F | Next Level Private LLC | 13,933 | -0.02 | 688 | 11.89 | ||||
| 2025-08-11 | 13F | Private Advisor Group, LLC | 4,741 | -8.49 | 234 | 2.63 | ||||
| 2025-07-25 | 13F | Hazlett, Burt & Watson, Inc. | 300 | 0.00 | 0 | |||||
| 2025-07-30 | 13F | Phillips Financial Management, Llc | 4,138 | 0.00 | 204 | 12.09 | ||||
| 2025-08-08 | 13F | Capital Investment Advisory Services, LLC | 63 | 0.00 | 3 | 50.00 | ||||
| 2025-08-13 | 13F | Invesco Ltd. | 14,755 | -8.11 | 728 | 2.82 | ||||
| 2025-07-07 | 13F | Investors Research Corp | 124 | 0.00 | 6 | 20.00 | ||||
| 2025-05-06 | 13F | Venturi Wealth Management, LLC | 0 | -100.00 | 0 | |||||
| 2025-07-14 | 13F | Park Avenue Securities Llc | 0 | -100.00 | 0 | |||||
| 2025-08-06 | 13F | Commonwealth Equity Services, Llc | 45,529 | -8.08 | 2 | 0.00 | ||||
| 2025-04-28 | 13F | Mutual Advisors, LLC | 0 | -100.00 | 0 | |||||
| 2025-07-24 | NP | PLUSX - DWS Multi-Asset Moderate Allocation Fund Class A | 6,529 | 15.89 | 315 | 25.00 | ||||
| 2025-08-14 | 13F | Goldman Sachs Group Inc | 6,955,810 | -32.53 | 343,408 | -24.46 | ||||
| 2025-07-29 | 13F | Activest Wealth Management | 11 | 0.00 | 1 | |||||
| 2025-08-14 | 13F | Glen Eagle Advisors, LLC | 10 | 0.00 | 0 | |||||
| 2025-04-28 | 13F | Resonant Capital Advisors, LLC | 0 | -100.00 | 0 | |||||
| 2025-07-23 | 13F | Vontobel Holding Ltd. | 5,250 | -5.23 | 259 | 6.15 | ||||
| 2025-08-13 | 13F | Vega Investment Solutions | 12,362 | 0.00 | 610 | 11.72 | ||||
| 2025-08-14 | 13F | Mml Investors Services, Llc | 48,294 | 0.81 | 2 | 0.00 | ||||
| 2025-07-14 | 13F | AdvisorNet Financial, Inc | 88 | 0.00 | 4 | 33.33 | ||||
| 2025-08-08 | 13F | Creative Planning | 16,101 | -13.17 | 795 | -2.82 | ||||
| 2025-08-12 | 13F | TCTC Holdings, LLC | 18,200 | 0.00 | 899 | 11.97 | ||||
| 2025-08-06 | 13F | AE Wealth Management LLC | 120 | 0.00 | 6 | 0.00 | ||||
| 2025-08-12 | 13F | Global Retirement Partners, LLC | 6,323 | 34.53 | 312 | 52.20 | ||||
| 2025-05-14 | 13F | Truvestments Capital Llc | 0 | -100.00 | 0 | |||||
| 2025-07-31 | 13F | CVA Family Office, LLC | 3,916 | 0.00 | 193 | 12.21 | ||||
| 2025-08-14 | 13F | Citadel Advisors Llc | Put | 0 | -100.00 | 0 | ||||
| 2025-08-11 | 13F | Hexagon Capital Partners LLC | 0 | -100.00 | 0 | |||||
| 2025-07-30 | 13F | Whittier Trust Co | 75 | 0.00 | 4 | 0.00 | ||||
| 2025-08-12 | 13F | Steward Partners Investment Advisory, Llc | 2,390 | -87.02 | 118 | -85.57 | ||||
| 2025-08-13 | 13F | Schroder Investment Management Group | 1,400 | 0.00 | 69 | 13.11 | ||||
| 2025-07-30 | 13F | Whittier Trust Co Of Nevada Inc | 4,275 | 66.67 | 211 | 86.73 | ||||
| 2025-08-01 | 13F | Banco Santander, S.A. | 160,399 | 54.59 | 7,919 | 73.07 | ||||
| 2025-08-14 | 13F | Royal Bank Of Canada | 203,991 | 87.01 | 10,072 | 109.40 | ||||
| 2025-08-14 | 13F | Partners Capital Investment Group, Llp | 138,569 | -48.12 | 6,841 | -41.91 | ||||
| 2025-07-15 | 13F | Fifth Third Bancorp | 550 | 0.00 | 27 | 12.50 | ||||
| 2025-08-13 | 13F | Cresset Asset Management, LLC | 0 | -100.00 | 0 | |||||
| 2025-08-14 | 13F | McIlrath & Eck, LLC | 0 | -100.00 | 0 | |||||
| 2025-07-22 | 13F | Highland Capital Management, Llc | 11,468 | 0.00 | 566 | 12.08 | ||||
| 2025-08-14 | 13F | Glenmede Investment Management, LP | 600 | 30 | ||||||
| 2025-07-24 | NP | SPDAX - DWS Multi-Asset Conservative Allocation Fund Class A | 9,818 | 0.00 | 474 | 7.74 | ||||
| 2025-08-14 | 13F | FIL Ltd | 25,983 | -39.45 | 1,283 | -32.24 | ||||
| 2025-07-11 | 13F | Afg Fiduciary Services Limited Partnership | 18,798 | 0.00 | 927 | 17.19 | ||||
| 2025-08-13 | 13F | Metlife Inc | 8,803 | -1.96 | 435 | 9.60 | ||||
| 2025-07-14 | 13F | GAMMA Investing LLC | 80 | 4 | ||||||
| 2025-08-08 | 13F | Abc Arbitrage Sa | 15,541 | 24.23 | 767 | 39.20 | ||||
| 2025-08-14 | 13F | Jane Street Group, Llc | 53,267 | -73.92 | 2,630 | -70.81 | ||||
| 2025-08-14 | 13F | UBS Group AG | 525,598 | 17.38 | 25,949 | 31.41 | ||||
| 2025-07-15 | 13F | Compagnie Lombard Odier SCmA | 6,150 | 0.00 | 304 | 11.81 | ||||
| 2025-07-09 | 13F | Breakwater Investment Management | 1,005 | 0.00 | 50 | 11.36 | ||||
| 2025-07-31 | 13F | GenTrust, LLC | 4,490 | -10.20 | 222 | 0.45 | ||||
| 2025-08-05 | 13F | Simplex Trading, Llc | 0 | -100.00 | 0 | |||||
| 2025-08-12 | 13F | Deutsche Bank Ag\ | 361,374 | -25.12 | 17,841 | -16.17 | ||||
| 2025-08-15 | 13F | Morgan Stanley | 1,266,672 | -26.40 | 62,536 | -17.60 | ||||
| 2025-05-15 | 13F | Glenmede Trust Co Na | 600 | 0.00 | 26 | 0.00 | ||||
| 2025-08-13 | 13F | Colonial Trust Advisors | 300 | 0.00 | 15 | 7.69 | ||||
| 2025-08-14 | 13F | Qube Research & Technologies Ltd | 32,505 | 419.83 | 1,605 | 483.27 | ||||
| 2025-08-07 | 13F | Allworth Financial LP | 220 | 340.00 | 11 | 400.00 | ||||
| 2025-08-05 | 13F | Bank Of Montreal /can/ | 4,555 | 9.52 | 225 | 22.40 | ||||
| 2025-08-11 | 13F | Brown Brothers Harriman & Co | 15 | 0.00 | 1 | |||||
| 2025-08-05 | 13F | Bank of New York Mellon Corp | 28,582 | 0.00 | 1,411 | 11.98 | ||||
| 2025-05-15 | 13F | Manufacturers Life Insurance Company, The | 0 | -100.00 | 0 | |||||
| 2025-08-14 | 13F | Engineers Gate Manager LP | 0 | -100.00 | 0 | |||||
| 2025-08-08 | 13F | Mv Capital Management, Inc. | 420 | 43.34 | 21 | 66.67 | ||||
| 2025-08-12 | 13F | Proequities, Inc. | 0 | 0 | ||||||
| 2025-08-13 | 13F | Green Harvest Asset Management LLC | 7,373 | -1.23 | 364 | 10.64 | ||||
| 2025-07-31 | 13F | Cambridge Investment Research Advisors, Inc. | 10,246 | -71.98 | 1 | -100.00 | ||||
| 2025-07-25 | 13F | Sequoia Financial Advisors, LLC | 5,355 | -8.70 | 264 | 2.33 | ||||
| 2025-08-14 | 13F | Wells Fargo & Company/mn | 134,878 | 0.92 | 6,659 | 12.98 | ||||
| 2025-07-18 | 13F | USA Financial Portformulas Corp | 3,061 | -35.30 | 151 | -27.40 | ||||
| 2025-05-14 | 13F | Oarsman Capital, Inc. | 0 | -100.00 | 0 |