Basic Stats
| Institutional Owners | 149 total, 149 long only, 0 short only, 0 long/short - change of -3.23% MRQ |
| Average Portfolio Allocation | 1.1951 % - change of -18.34% MRQ |
| Institutional Shares (Long) | 25,861,634 (ex 13D/G) - change of -8.50MM shares -24.73% MRQ |
| Institutional Value (Long) | $ 1,402,124 USD ($1000) |
Institutional Ownership and Shareholders
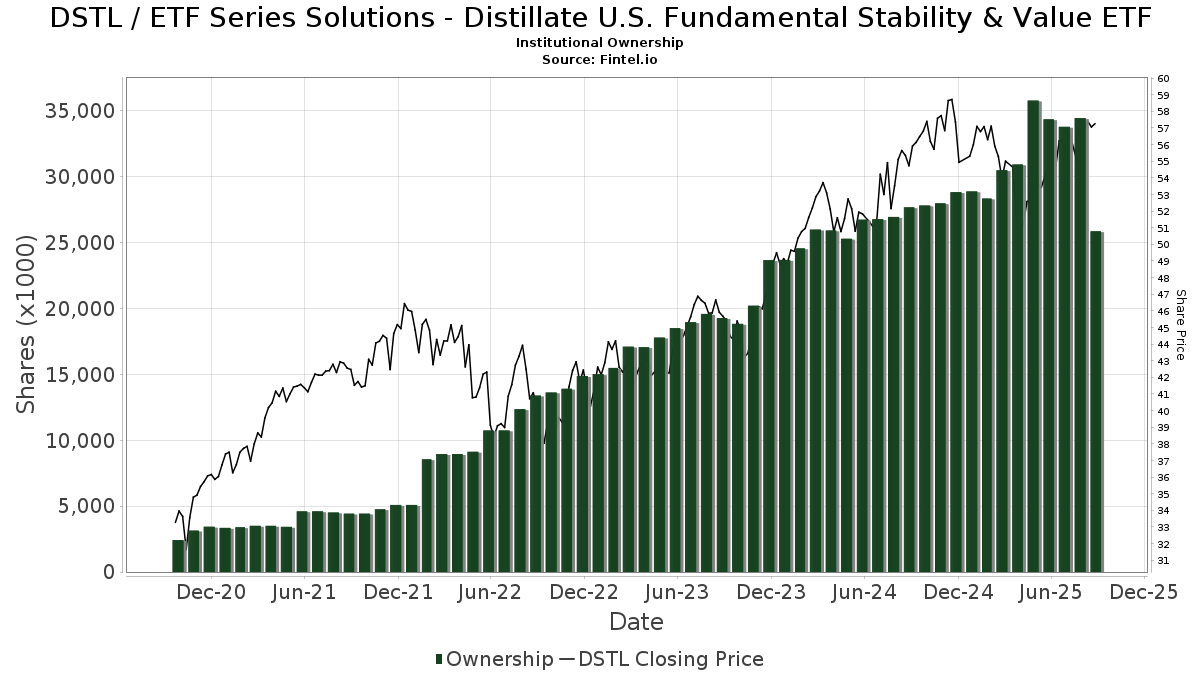
ETF Series Solutions - Distillate U.S. Fundamental Stability & Value ETF (US:DSTL) has 149 institutional owners and shareholders that have filed 13D/G or 13F forms with the Securities Exchange Commission (SEC). These institutions hold a total of 25,861,634 shares. Largest shareholders include Sequoia Financial Advisors, LLC, Wealth Enhancement Advisory Services, Llc, Oxford Financial Group Ltd, Abacus Planning Group, Inc., Madison Asset Management, LLC, Resonant Capital Advisors, LLC, AlphaCore Capital LLC, LPL Financial LLC, Avantax Advisory Services, Inc., and Raymond James Financial Inc .
ETF Series Solutions - Distillate U.S. Fundamental Stability & Value ETF (ARCA:DSTL) institutional ownership structure shows current positions in the company by institutions and funds, as well as latest changes in position size. Major shareholders can include individual investors, mutual funds, hedge funds, or institutions. The Schedule 13D indicates that the investor holds (or held) more than 5% of the company and intends (or intended) to actively pursue a change in business strategy. Schedule 13G indicates a passive investment of over 5%.
The share price as of September 5, 2025 is 57.70 / share. Previously, on September 6, 2024, the share price was 54.31 / share. This represents an increase of 6.25% over that period.
Fund Sentiment Score
The Fund Sentiment Score (fka Ownership Accumulation Score) finds the stocks that are being most bought by funds. It is the result of a sophisticated, multi-factor quantitative model that identifies companies with the highest levels of institutional accumulation. The scoring model uses a combination of the total increase in disclosed owners, the changes in portfolio allocations in those owners and other metrics. The number ranges from 0 to 100, with higher numbers indicating a higher level of accumulation to its peers, and 50 being the average.
Update Frequency: Daily
See Ownership Explorer, which provides a list of highest-ranking companies.
Institutional Put/Call Ratio
In addition to reporting standard equity and debt issues, institutions with more than 100MM assets under management must also disclose their put and call option holdings. Since put options generally indicate negative sentiment, and call options indicate positive sentiment, we can get a sense of the overall institutional sentiment by plotting the ratio of puts to calls. The chart to the right plots the historical put/call ratio for this instrument.
Using Put/Call Ratio as an indicator of investor sentiment overcomes one of the key deficiencies of using total institutional ownership, which is that a significant amount of assets under management are invested passively to track indices. Passively-managed funds do not typically buy options, so the put/call ratio indicator more closely tracks the sentiment of actively-managed funds.
13F and NPORT Filings
Detail on 13F filings are free. Detail on NP filings require a premium membership. Green rows indicate new positions. Red rows indicate closed positions. Click the link icon to see the full transaction history.
Upgrade
to unlock premium data and export to Excel ![]() .
.
| File Date | Source | Investor | Type | Avg Price (Est) |
Shares | Δ Shares (%) |
Reported Value ($1000) |
Δ Value (%) |
Port Alloc (%) |
|
|---|---|---|---|---|---|---|---|---|---|---|
| 2025-07-24 | 13F/A | TFR Capital, LLC. | 27,952 | -5.21 | 1,547 | -3.25 | ||||
| 2025-07-24 | 13F | IFP Advisors, Inc | 47,491 | 0.64 | 2,629 | 2.70 | ||||
| 2025-08-13 | 13F | Russell Investments Group, Ltd. | 2,020 | 0.35 | 112 | 1.83 | ||||
| 2025-08-06 | 13F | AE Wealth Management LLC | 71 | 0.00 | 4 | 0.00 | ||||
| 2025-08-12 | 13F | Gladstone Institutional Advisory LLC | 124,719 | 3.53 | 6,903 | 5.65 | ||||
| 2025-07-17 | 13F | Barry Investment Advisors, LLC | 25,477 | 14.99 | 1,410 | 17.40 | ||||
| 2025-07-25 | 13F | We Are One Seven, LLC | 42,435 | -5.78 | 2,349 | -3.85 | ||||
| 2025-08-07 | 13F | David R. Rahn & Associates Inc. | 0 | -100.00 | 0 | |||||
| 2025-08-05 | 13F | Landmark Wealth Management, Inc. | 10,225 | -68.07 | 566 | -67.45 | ||||
| 2025-07-22 | 13F | Merit Financial Group, LLC | 70,261 | 3,889 | ||||||
| 2025-07-14 | 13F | Clayton Financial Group LLC | 4,625 | -94.18 | 256 | -94.08 | ||||
| 2025-08-11 | 13F | Berkeley, Inc | 401,045 | 9.43 | 22,198 | 11.67 | ||||
| 2025-08-13 | 13F | Level Four Advisory Services, Llc | 276,377 | 1.75 | 15,298 | 3.84 | ||||
| 2025-08-15 | 13F | Equitable Holdings, Inc. | 116,103 | -11.98 | 6,426 | -10.18 | ||||
| 2025-08-07 | 13F | American Alpha Advisors, LLC | 12,005 | -4.39 | 664 | -2.50 | ||||
| 2025-07-18 | 13F | SimpliFi, Inc. | 203,772 | 0.82 | 11,279 | 2.88 | ||||
| 2025-08-14 | 13F | Integrated Wealth Concepts LLC | 14,867 | -0.17 | 823 | 1.86 | ||||
| 2025-08-11 | 13F | HighTower Advisors, LLC | 13,568 | -93.72 | 751 | -93.60 | ||||
| 2025-08-14 | 13F | Oxford Financial Group Ltd | 1,668,041 | 2.39 | 92,326 | 4.49 | ||||
| 2025-08-15 | 13F | Morgan Stanley | 10,426 | -26.64 | 577 | -25.06 | ||||
| 2025-07-25 | 13F | Cwm, Llc | 51 | 0 | ||||||
| 2025-07-14 | 13F | Park Avenue Securities Llc | 138,031 | 32.68 | 8 | 40.00 | ||||
| 2025-07-18 | 13F | Centricity Wealth Management, LLC | 639 | 0.00 | 35 | 2.94 | ||||
| 2025-08-14 | 13F | Mercer Global Advisors Inc /adv | 3,630 | 201 | ||||||
| 2025-08-12 | 13F | Soundwatch Capital LLC | 3,923 | 1,807 | ||||||
| 2025-06-17 | NP | MAGSX - Madison Aggressive Allocation Fund Aggressive Allocation Fund Class A | 92,013 | -0.00 | 4,837 | -7.50 | ||||
| 2025-08-07 | 13F | Allworth Financial LP | 700 | 0.00 | 39 | 5.56 | ||||
| 2025-08-14 | 13F/A | Rockefeller Capital Management L.P. | 420,618 | 1.20 | 23,281 | 3.27 | ||||
| 2025-06-17 | NP | MMDAX - Madison Moderate Allocation Fund Moderate Allocation Fund Class A | 116,208 | -5.65 | 6,109 | -12.72 | ||||
| 2025-08-14 | 13F | Colony Group, LLC | 204,363 | 0.07 | 11,312 | 2.11 | ||||
| 2025-07-23 | 13F | Hardy Reed LLC | 0 | -100.00 | 0 | |||||
| 2025-08-13 | 13F | EverSource Wealth Advisors, LLC | 1,643 | 5,565.52 | 91 | 8,900.00 | ||||
| 2025-07-31 | 13F | Resonant Capital Advisors, LLC | 985,505 | 5.71 | 54,548 | 7.88 | ||||
| 2025-08-05 | 13F | GHP Investment Advisors, Inc. | 60 | 0.00 | 3 | 0.00 | ||||
| 2025-07-11 | 13F | Farther Finance Advisors, LLC | 154 | -81.82 | 9 | -82.22 | ||||
| 2025-07-18 | 13F | BCU Wealth Advisors, LLC | 5,892 | 0.22 | 326 | 2.52 | ||||
| 2025-07-31 | 13F | Cambridge Investment Research Advisors, Inc. | 318,157 | -0.05 | 18 | 0.00 | ||||
| 2025-08-14 | 13F | Bank Of America Corp /de/ | 232,596 | -15.74 | 12,874 | -14.01 | ||||
| 2025-08-07 | 13F | FDx Advisors, Inc. | 0 | -100.00 | 0 | |||||
| 2025-07-31 | 13F | Brinker Capital Investments, LLC | 0 | -100.00 | 0 | -100.00 | ||||
| 2025-07-09 | 13F | WealthCare Investment Partners, LLC | 9,916 | 0.33 | 558 | 13.88 | ||||
| 2025-08-19 | 13F | Advisory Services Network, LLC | 24,538 | -12.55 | 1,345 | -11.57 | ||||
| 2025-08-04 | 13F | Assetmark, Inc | 216 | -42.25 | 12 | -45.00 | ||||
| 2025-08-13 | 13F | Northwestern Mutual Wealth Management Co | 2,453 | -40.20 | 136 | -39.19 | ||||
| 2025-08-18 | 13F | Geneos Wealth Management Inc. | 3,650 | 0.00 | 202 | 2.54 | ||||
| 2025-07-02 | 13F | Crumly & Associates Inc. | 360,414 | 4.02 | 19,949 | 6.15 | ||||
| 2025-08-14 | 13F | Goldman Sachs Group Inc | 107,252 | 405.00 | 5,936 | 415.73 | ||||
| 2025-08-14 | 13F | Operose Advisors LLC | 681 | 0.00 | 38 | 2.78 | ||||
| 2025-07-10 | 13F | Wealth Enhancement Advisory Services, Llc | 2,258,144 | 55.65 | 127,111 | 61.53 | ||||
| 2025-07-31 | 13F | Orion Capital Management LLC | 175,635 | 0.62 | 9,721 | 2.68 | ||||
| 2025-08-13 | 13F | Per Stirling Capital Management, LLC. | 11,361 | -8.01 | 629 | -6.13 | ||||
| 2025-07-25 | 13F | Envestnet Portfolio Solutions, Inc. | 0 | -100.00 | 0 | |||||
| 2025-08-12 | 13F | Tradition Wealth Management, LLC | 8,233 | -2.60 | 456 | -0.66 | ||||
| 2025-08-14 | 13F | Comerica Bank | 0 | -100.00 | 0 | |||||
| 2025-08-06 | 13F | Commonwealth Equity Services, Llc | 45,137 | -3.96 | 2 | 0.00 | ||||
| 2025-07-28 | 13F | Harbour Investments, Inc. | 34,746 | 20.34 | 1,923 | 22.88 | ||||
| 2025-07-25 | 13F | LRI Investments, LLC | 9,805 | 8.90 | 543 | 11.07 | ||||
| 2025-08-13 | 13F | Cerity Partners LLC | 659,583 | -0.35 | 36,508 | 1.69 | ||||
| 2025-08-15 | 13F | Global View Capital Management LLC | 8,450 | -5.44 | 468 | -3.51 | ||||
| 2025-08-12 | 13F | O'shaughnessy Asset Management, Llc | 5,912 | -4.31 | 327 | -2.39 | ||||
| 2025-07-30 | NP | ENDW - Cambria Endowment Style ETF | 2,164 | 116 | ||||||
| 2025-08-14 | 13F | Stifel Financial Corp | 15,084 | -41.57 | 835 | -40.43 | ||||
| 2025-07-11 | 13F | Adirondack Trust Co | 849 | 47 | ||||||
| 2025-08-12 | 13F | LPL Financial LLC | 852,766 | -13.21 | 47,201 | -11.43 | ||||
| 2025-08-13 | 13F | Quadrant Capital Group Llc | 0 | -100.00 | 0 | |||||
| 2025-08-04 | 13F | Spire Wealth Management | 2,060 | 0.00 | 114 | 2.70 | ||||
| 2025-08-18 | NP | ULTRA SERIES FUND - Madison Target Retirement 2040 Fund Class I | 98,548 | 1.33 | 5,455 | 3.41 | ||||
| 2025-08-14 | 13F | Mml Investors Services, Llc | 6,484 | -5.59 | 0 | |||||
| 2025-08-18 | NP | ULTRA SERIES FUND - Conservative Allocation Fund Class I | 17,446 | -40.44 | 966 | -39.23 | ||||
| 2025-08-07 | 13F | Weil Company, Inc. | 46,799 | -68.35 | 2,590 | -67.71 | ||||
| 2025-08-14 | 13F | Raymond James Financial Inc | 682,951 | -4.01 | 37,801 | -2.05 | ||||
| 2025-08-14 | 13F | Herold Advisors, Inc. | 91,377 | -6.35 | 5,058 | -4.44 | ||||
| 2025-08-14 | 13F | Wells Fargo & Company/mn | 15 | -99.99 | 1 | -100.00 | ||||
| 2025-08-14 | 13F | CIBC World Markets Inc. | 16,113 | -11.92 | 892 | -10.18 | ||||
| 2025-08-08 | 13F | Hibernia Wealth Partners, LLC | 23,396 | 100.21 | 1,295 | 104.42 | ||||
| 2025-08-14 | 13F/A | Perritt Capital Management Inc | 136,512 | 1.86 | 7,556 | 3.95 | ||||
| 2025-08-14 | 13F | Certified Advisory Corp | 6,794 | 0.00 | 376 | 2.17 | ||||
| 2025-08-05 | 13F | Bank of New York Mellon Corp | 0 | -100.00 | 0 | |||||
| 2025-08-14 | 13F | Hrt Financial Lp | 5,125 | 0 | ||||||
| 2025-08-18 | NP | ULTRA SERIES FUND - Aggressive Allocation Fund Class I | 50,636 | -12.52 | 2,803 | -10.74 | ||||
| 2025-07-17 | 13F | Vermillion Wealth Management, Inc. | 672 | 0.00 | 37 | 2.78 | ||||
| 2025-08-08 | 13F | Cetera Investment Advisers | 80,091 | -17.73 | 4,433 | -16.04 | ||||
| 2025-08-06 | 13F | SOUTH STATE Corp | 0 | -100.00 | 0 | |||||
| 2025-08-26 | 13F/A | Thrivent Financial For Lutherans | 7,528 | 0 | ||||||
| 2025-07-30 | 13F | Green Square Capital Advisors Llc | 606,155 | 1.92 | 33,551 | 4.00 | ||||
| 2025-08-12 | 13F | Richard W. Paul & Associates, LLC | 35,291 | 1.47 | 1,953 | 3.55 | ||||
| 2025-08-14 | 13F | Hilltop Holdings Inc. | 31,098 | -0.85 | 1,721 | 1.18 | ||||
| 2025-08-14 | 13F | Qube Research & Technologies Ltd | 17,085 | 0.86 | 946 | 2.94 | ||||
| 2025-08-01 | 13F | Envestnet Asset Management Inc | 70,992 | -79.81 | 3,929 | -79.40 | ||||
| 2025-08-14 | 13F | Ausdal Financial Partners, Inc. | 34,947 | -5.25 | 1,934 | -3.30 | ||||
| 2025-07-23 | 13F | Ameliora Wealth Management Ltd. | 0 | -100.00 | 0 | |||||
| 2025-08-13 | 13F | GeoWealth Management, LLC | 6,447 | -10.89 | 357 | -9.18 | ||||
| 2025-08-18 | NP | ULTRA SERIES FUND - Moderate Allocation Fund Class I | 66,002 | -30.14 | 3,653 | -28.71 | ||||
| 2025-08-18 | NP | ULTRA SERIES FUND - Madison Target Retirement 2020 Fund Class I | 6,477 | -30.23 | 359 | -28.83 | ||||
| 2025-07-24 | 13F | Us Bancorp \de\ | 5,777 | -8.04 | 320 | -6.18 | ||||
| 2025-07-29 | 13F | Oxbow Advisors, LLC | 220,693 | 0.04 | 12,215 | 2.08 | ||||
| 2025-07-17 | 13F | Oakworth Capital, Inc. | 672 | 0.00 | 37 | 2.78 | ||||
| 2025-04-15 | 13F | Members Wealth Llc | 6,742 | -28.15 | 366 | -30.87 | ||||
| 2025-07-22 | 13F | Apexium Financial, Lp | 236,184 | 10.31 | 13,073 | 12.56 | ||||
| 2025-08-12 | 13F | CIBC Private Wealth Group, LLC | 3,583 | -56.74 | 198 | -50.62 | ||||
| 2025-08-14 | 13F | Arete Wealth Advisors, LLC | 17,942 | -7.35 | 1 | -100.00 | ||||
| 2025-08-04 | 13F | Flagship Harbor Advisors, Llc | 73,229 | 0.89 | 4,053 | 2.95 | ||||
| 2025-08-14 | 13F | Harwood Advisory Group, LLC | 65,897 | 0.33 | 3,647 | 1.11 | ||||
| 2025-07-22 | 13F | Belpointe Asset Management LLC | 5,162 | -10.61 | 286 | -8.95 | ||||
| 2025-08-13 | 13F | Empire Financial Management Company, LLC | 246,129 | -1.99 | 13,623 | 0.01 | ||||
| 2025-08-12 | 13F | Proequities, Inc. | 0 | 0 | ||||||
| 2025-08-11 | 13F | Shufro Rose & Co Llc | 5,817 | -20.80 | 315 | -20.85 | ||||
| 2025-08-08 | 13F | Pnc Financial Services Group, Inc. | 626 | 35 | ||||||
| 2025-07-14 | 13F | U.S. Capital Wealth Advisors, LLC | 0 | -100.00 | 0 | |||||
| 2025-07-29 | 13F | ODonnell Financial Services, LLC | 474,625 | 0.03 | 26,270 | 2.08 | ||||
| 2025-08-06 | 13F | Stonebridge Financial Planning Group, LLC | 69,317 | -1.01 | 3,837 | 1.00 | ||||
| 2025-07-15 | 13F | Heritage Oak Wealth Advisors Llc | 18,868 | 1.34 | 1,044 | 3.47 | ||||
| 2025-08-12 | 13F | Steward Partners Investment Advisory, Llc | 1,627 | -75.33 | 90 | -74.79 | ||||
| 2025-08-14 | 13F | Jane Street Group, Llc | 7,185 | 398 | ||||||
| 2025-07-16 | 13F | Meridian Financial, LLC | 6,900 | 11.29 | 382 | 13.39 | ||||
| 2025-08-15 | 13F | Captrust Financial Advisors | 170,713 | -25.41 | 9,449 | -23.89 | ||||
| 2025-07-18 | 13F | Truist Financial Corp | 13,751 | -47.22 | 761 | -46.14 | ||||
| 2025-08-14 | 13F | Fmr Llc | 377 | -71.16 | 21 | -71.43 | ||||
| 2025-07-30 | 13F | Rehmann Capital Advisory Group | 25,065 | -1.02 | 1,387 | 1.02 | ||||
| 2025-08-13 | 13F | SCS Capital Management LLC | 7,310 | 405 | ||||||
| 2025-07-25 | 13F | Atria Wealth Solutions, Inc. | 0 | -100.00 | 0 | -100.00 | ||||
| 2025-07-15 | 13F | Oregon Pacific Wealth Management, LLC | 4,264 | -67.47 | 236 | -66.76 | ||||
| 2025-08-14 | 13F | Citadel Advisors Llc | 5,491 | 0.00 | 304 | 2.02 | ||||
| 2025-08-06 | 13F | Aspect Partners, LLC | 44,727 | 9.10 | 2,476 | 11.34 | ||||
| 2025-04-22 | 13F | Mendota Financial Group, LLC | 0 | -100.00 | 0 | -100.00 | ||||
| 2025-08-11 | 13F | Madison Asset Management, LLC | 1,115,963 | -17.07 | 61,769 | -15.37 | ||||
| 2025-08-18 | NP | ULTRA SERIES FUND - Madison Target Retirement 2050 Fund Class I | 100,329 | 0.03 | 5,553 | 2.08 | ||||
| 2025-07-09 | 13F | Fermata Advisors, LLC | 74,153 | 6.39 | 4,104 | 8.57 | ||||
| 2025-08-06 | 13F | Centerpoint Advisory Group | 75,505 | -1.68 | 4,179 | 0.34 | ||||
| 2025-08-12 | 13F | Allen Capital Group, LLC | 568,804 | -3.90 | 31,483 | -1.93 | ||||
| 2025-07-08 | 13F | Nbc Securities, Inc. | 0 | -100.00 | 0 | |||||
| 2025-07-14 | 13F | Opal Wealth Advisors, LLC | 3,076 | 3.57 | 170 | 5.59 | ||||
| 2025-04-21 | 13F | PSI Advisors, LLC | 0 | -100.00 | 0 | |||||
| 2025-07-15 | 13F | Accurate Wealth Management, LLC | 10,945 | -4.66 | 618 | 5.10 | ||||
| 2025-09-04 | 13F/A | Advisor Group Holdings, Inc. | 56,486 | -24.51 | 3,127 | -22.96 | ||||
| 2025-08-08 | 13F | Thoroughbred Financial Services, Llc | 43,032 | -15.32 | 2 | 0.00 | ||||
| 2025-08-11 | 13F | Aspen Investment Management Inc | 0 | -100.00 | 0 | |||||
| 2025-08-06 | 13F | Csenge Advisory Group | 66,990 | 1.63 | 3,587 | 7.20 | ||||
| 2025-08-14 | 13F | Mariner, LLC | 18,265 | 1,011 | ||||||
| 2025-08-06 | 13F | Legacy Investment Solutions, LLC | 5,407 | -66.37 | 299 | -66.96 | ||||
| 2025-05-15 | 13F | Glenmede Trust Co Na | 4,500 | 0.00 | 244 | -1.21 | ||||
| 2025-08-05 | 13F | Simplex Trading, Llc | 86 | 11.69 | 0 | |||||
| 2025-08-14 | 13F | Royal Bank Of Canada | 11,325 | -97.88 | 627 | -97.83 | ||||
| 2025-08-05 | 13F | Hutchens & Kramer Investment Management Group, LLC | 13,665 | 17.80 | 768 | 21.94 | ||||
| 2025-08-12 | 13F | BlackRock, Inc. | 1,185 | 0.00 | 66 | 1.56 | ||||
| 2025-06-17 | NP | MCNAX - Madison Conservative Allocation Fund Conservative Allocation Fund Class A | 34,691 | -8.12 | 1,824 | -15.01 | ||||
| 2025-08-14 | 13F | Susquehanna International Group, Llp | 8,281 | 458 | ||||||
| 2025-07-09 | 13F | Sapient Capital Llc | 29,412 | 0.00 | 1,628 | 2.01 | ||||
| 2025-08-12 | 13F | Global Retirement Partners, LLC | 0 | -100.00 | 0 | |||||
| 2025-08-14 | 13F | Two Sigma Securities, Llc | 4,583 | 254 | ||||||
| 2025-07-16 | 13F | Old Port Advisors | 128,578 | -1.76 | 7,117 | 0.25 | ||||
| 2025-08-06 | 13F | Sage Advisory Services, Ltd.Co. | 14,198 | -92.17 | 786 | -92.01 | ||||
| 2025-08-08 | 13F | Hartland & Co., LLC | 454 | 10.19 | 25 | 13.64 | ||||
| 2025-07-25 | 13F | Sequoia Financial Advisors, LLC | 5,403,637 | 2.71 | 299,091 | 4.81 | ||||
| 2025-08-08 | 13F | Avantax Advisory Services, Inc. | 801,110 | 3.67 | 44,341 | 5.79 | ||||
| 2025-05-09 | 13F | Keeler THomas Management LLC | 0 | -100.00 | 0 | -100.00 | ||||
| 2025-07-28 | 13F | Arlington Financial Advisors, LLC | 464,826 | 1.12 | 25,728 | 3.19 | ||||
| 2025-08-05 | 13F | Carolinas Wealth Consulting Llc | 0 | -100.00 | 0 | -100.00 | ||||
| 2025-08-14 | 13F | UBS Group AG | 4,669 | -4.05 | 258 | -1.90 | ||||
| 2025-07-21 | 13F/A | Abacus Planning Group, Inc. | 1,381,445 | -3.21 | 76,463 | -1.23 | ||||
| 2025-08-05 | 13F | Huntington National Bank | 1,232 | 2.07 | ||||||
| 2025-08-06 | 13F | Legacy Wealth Managment, LLC/ID | 5,407 | 7.62 | 299 | 9.93 | ||||
| 2025-08-19 | 13F | Anchor Investment Management, LLC | 7,164 | 0.00 | 397 | 2.06 | ||||
| 2025-04-22 | 13F | PFG Investments, LLC | 0 | -100.00 | 0 | |||||
| 2025-08-12 | 13F | AlphaCore Capital LLC | 959,896 | 0.70 | 53,130 | 2.77 | ||||
| 2025-07-01 | 13F | Park National Corp /oh/ | 52,402 | -91.43 | 2,900 | -91.26 | ||||
| 2025-07-17 | 13F | Cyr Financial Inc. | 0 | -100.00 | 0 | -100.00 | ||||
| 2025-07-21 | 13F | Ameritas Advisory Services, LLC | 2,602 | -41.12 | 144 | -40.00 | ||||
| 2025-07-23 | 13F | Sunbeam Capital Management, LLC | 155,720 | 17.51 | 8,619 | 19.92 | ||||
| 2025-05-13 | 13F | Hrc Wealth Management, Llc | 0 | -100.00 | 0 | |||||
| 2025-07-24 | 13F | Blair William & Co/il | 82 | 1.23 | 5 | 0.00 | ||||
| 2025-08-12 | 13F | Jpmorgan Chase & Co | 81,214 | 154.46 | 4,495 | 159.68 | ||||
| 2025-08-18 | NP | ULTRA SERIES FUND - Madison Target Retirement 2030 Fund Class I | 73,181 | -4.59 | 4,051 | -2.64 |