Basic Stats
| Institutional Owners | 82 total, 82 long only, 0 short only, 0 long/short - change of 86.36% MRQ |
| Average Portfolio Allocation | 0.2671 % - change of 80.88% MRQ |
| Institutional Shares (Long) | 9,634,411 (ex 13D/G) - change of 6.10MM shares 172.88% MRQ |
| Institutional Value (Long) | $ 231,376 USD ($1000) |
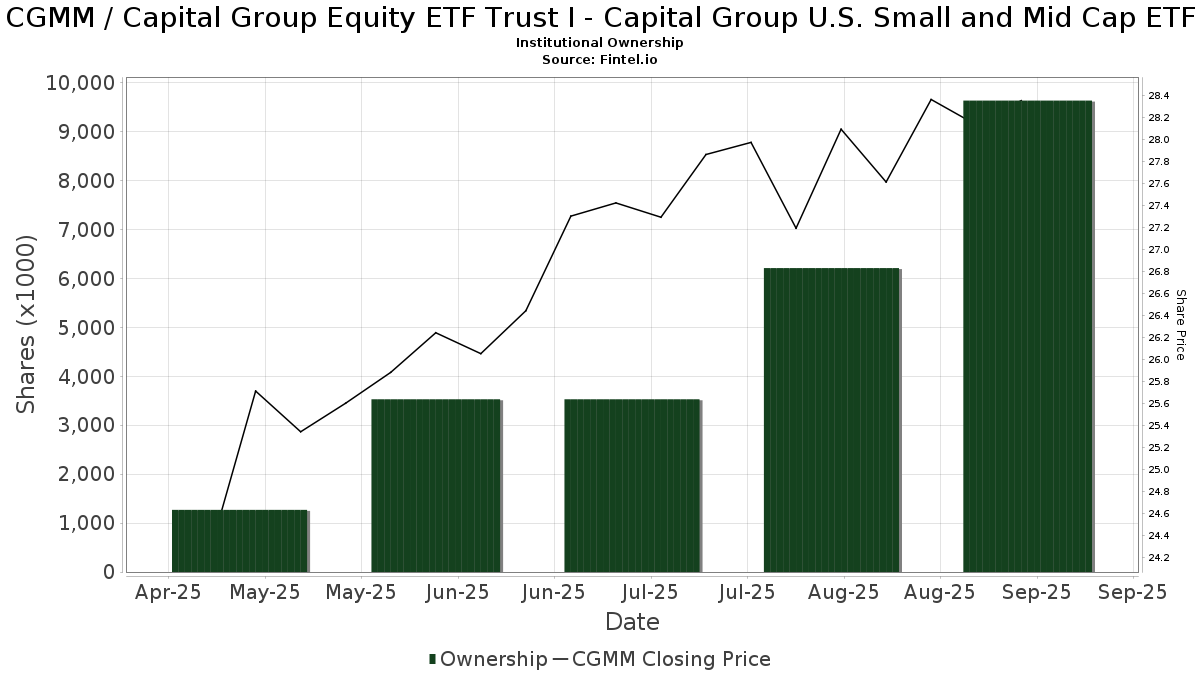
Institutional Ownership and Shareholders
Capital Group Equity ETF Trust I - Capital Group U.S. Small and Mid Cap ETF (US:CGMM) has 82 institutional owners and shareholders that have filed 13D/G or 13F forms with the Securities Exchange Commission (SEC). These institutions hold a total of 9,634,411 shares. Largest shareholders include Envestnet Asset Management Inc, Captrust Financial Advisors, Commonwealth Equity Services, Llc, GWM Advisors LLC, Main Line Retirement Advisors, LLC, Advisor Group Holdings, Inc., Strategic Blueprint, LLC, LPL Financial LLC, Cetera Investment Advisers, and Beta Wealth Group, Inc. .
Capital Group Equity ETF Trust I - Capital Group U.S. Small and Mid Cap ETF (ARCA:CGMM) institutional ownership structure shows current positions in the company by institutions and funds, as well as latest changes in position size. Major shareholders can include individual investors, mutual funds, hedge funds, or institutions. The Schedule 13D indicates that the investor holds (or held) more than 5% of the company and intends (or intended) to actively pursue a change in business strategy. Schedule 13G indicates a passive investment of over 5%.
The share price as of September 9, 2025 is 28.34 / share. Previously, on January 16, 2025, the share price was 25.98 / share. This represents an increase of 9.09% over that period.
Fund Sentiment Score
The Fund Sentiment Score (fka Ownership Accumulation Score) finds the stocks that are being most bought by funds. It is the result of a sophisticated, multi-factor quantitative model that identifies companies with the highest levels of institutional accumulation. The scoring model uses a combination of the total increase in disclosed owners, the changes in portfolio allocations in those owners and other metrics. The number ranges from 0 to 100, with higher numbers indicating a higher level of accumulation to its peers, and 50 being the average.
Update Frequency: Daily
See Ownership Explorer, which provides a list of highest-ranking companies.
Institutional Put/Call Ratio
In addition to reporting standard equity and debt issues, institutions with more than 100MM assets under management must also disclose their put and call option holdings. Since put options generally indicate negative sentiment, and call options indicate positive sentiment, we can get a sense of the overall institutional sentiment by plotting the ratio of puts to calls. The chart to the right plots the historical put/call ratio for this instrument.
Using Put/Call Ratio as an indicator of investor sentiment overcomes one of the key deficiencies of using total institutional ownership, which is that a significant amount of assets under management are invested passively to track indices. Passively-managed funds do not typically buy options, so the put/call ratio indicator more closely tracks the sentiment of actively-managed funds.
13F and NPORT Filings
Detail on 13F filings are free. Detail on NP filings require a premium membership. Green rows indicate new positions. Red rows indicate closed positions. Click the link icon to see the full transaction history.
Upgrade
to unlock premium data and export to Excel ![]() .
.
| File Date | Source | Investor | Type | Avg Price (Est) |
Shares | Δ Shares (%) |
Reported Value ($1000) |
Δ Value (%) |
Port Alloc (%) |
|
|---|---|---|---|---|---|---|---|---|---|---|
| 2025-07-30 | 13F | Cullen/frost Bankers, Inc. | 37,685 | 33.39 | 1,013 | 50.15 | ||||
| 2025-07-23 | 13F | Wise Wealth Partners | 59,905 | 1,610 | ||||||
| 2025-08-06 | 13F | Souders Financial Advisors | 9,724 | 261 | ||||||
| 2025-09-09 | 13F | NWF Advisory Services Inc. | 33,572 | 902 | ||||||
| 2025-07-10 | 13F | Sovran Advisors, LLC | 22,424 | 611 | ||||||
| 2025-07-22 | 13F | Merit Financial Group, LLC | 39,691 | 73.57 | 1,067 | 95.24 | ||||
| 2025-08-14 | 13F | Raymond James Financial Inc | 1,107 | 30 | ||||||
| 2025-07-31 | 13F | Moloney Securities Asset Management, LLC | 22,560 | 43.42 | 606 | 61.60 | ||||
| 2025-08-01 | 13F | Envestnet Asset Management Inc | 1,846,515 | 138.99 | 49,634 | 168.92 | ||||
| 2025-08-13 | 13F | Summit Wealth Group Llc / Co | 7,994 | 215 | ||||||
| 2025-08-12 | 13F | OneAscent Financial Services LLC | 23,506 | 100.32 | 1 | |||||
| 2025-08-27 | 13F/A | Brinker Capital Investments, LLC | 31,651 | 851 | ||||||
| 2025-08-13 | 13F | Capital International Investors | 174,909 | -82.59 | 4,702 | -80.42 | ||||
| 2025-09-04 | 13F/A | Advisor Group Holdings, Inc. | 414,909 | 1,090.90 | 11,153 | 1,240.38 | ||||
| 2025-08-01 | 13F | Gwn Securities Inc. | 0 | -100.00 | 0 | |||||
| 2025-08-06 | 13F | Founders Financial Securities Llc | 12,889 | 13.92 | 346 | 31.06 | ||||
| 2025-07-28 | 13F | JGP Wealth Management, LLC | 7,770 | 209 | ||||||
| 2025-08-14 | 13F | Susquehanna International Group, Llp | 21,754 | 118.63 | 585 | 146.41 | ||||
| 2025-08-04 | 13F | Pensionmark Financial Group, Llc | 10,812 | 18.16 | 291 | 33.03 | ||||
| 2025-07-10 | 13F | Wealth Enhancement Advisory Services, Llc | 83,792 | 35.04 | 2,302 | 55.26 | ||||
| 2025-08-14 | 13F | Mariner, LLC | 24,050 | 0.00 | 646 | 12.54 | ||||
| 2025-08-08 | 13F | Security Financial Services, INC. | 12,405 | 333 | ||||||
| 2025-07-29 | 13F | Balboa Wealth Partners | 10,102 | 272 | ||||||
| 2025-07-14 | 13F | AdvisorNet Financial, Inc | 295 | 8 | ||||||
| 2025-08-08 | 13F | Cetera Investment Advisers | 281,832 | 7,576 | ||||||
| 2025-08-15 | 13F | Morgan Stanley | 1,748 | 47 | ||||||
| 2025-08-11 | 13F | Private Advisor Group, LLC | 19,830 | 533 | ||||||
| 2025-08-14 | 13F | Mml Investors Services, Llc | 229,187 | 37.19 | 6 | 100.00 | ||||
| 2025-05-02 | 13F | Capital A Wealth Management, LLC | 520 | 12 | ||||||
| 2025-07-09 | 13F | Pines Wealth Management, LLC | 34,618 | 6.44 | 951 | 39.30 | ||||
| 2025-07-28 | 13F | Sagespring Wealth Partners, Llc | 25,750 | 692 | ||||||
| 2025-08-06 | 13F | Legacy Investment Solutions, LLC | 14 | 0 | ||||||
| 2025-08-04 | 13F | Assetmark, Inc | 37,334 | 1,004 | ||||||
| 2025-08-15 | 13F | Kestra Advisory Services, LLC | 12,630 | 339 | ||||||
| 2025-08-06 | 13F | Commonwealth Equity Services, Llc | 654,161 | 170.50 | 18 | 240.00 | ||||
| 2025-08-14 | 13F | Sei Investments Co | 242,983 | 1,613.32 | 6,531 | 1,832.25 | ||||
| 2025-08-11 | 13F | Rothschild Investment Llc | 27,690 | 744 | ||||||
| 2025-08-14 | 13F | Citadel Advisors Llc | 8,969 | 241 | ||||||
| 2025-07-30 | 13F | Smith Thornton Advisors LLC | 113,644 | 0.47 | 3,055 | 13.03 | ||||
| 2025-08-14 | 13F | Wiley Bros.-aintree Capital, Llc | 102,637 | 106.48 | 2,778 | 133.36 | ||||
| 2025-07-28 | 13F | Harbour Investments, Inc. | 21,010 | 143.79 | 565 | 175.12 | ||||
| 2025-08-14 | 13F | Stifel Financial Corp | 247,324 | 6,648 | ||||||
| 2025-07-16 | 13F | Essex Financial Services, Inc. | 23,334 | 131.14 | 627 | 160.17 | ||||
| 2025-07-29 | 13F | Latitude Advisors, LLC | 15,399 | 24.75 | 414 | 40.48 | ||||
| 2025-07-29 | 13F | Stephens Inc /ar/ | 260,608 | 7,005 | ||||||
| 2025-07-11 | 13F | Trinity Wealth Management, LLC | 19,473 | 523 | ||||||
| 2025-08-06 | 13F | Legacy Wealth Managment, LLC/ID | 14 | 0 | ||||||
| 2025-08-14 | 13F | GWM Advisors LLC | 505,750 | 13,595 | ||||||
| 2025-07-15 | 13F | StoneCrest Wealth Management, Inc. | 118,935 | 3,197 | ||||||
| 2025-07-18 | 13F | Truist Financial Corp | 21,242 | 6.19 | 571 | 19.50 | ||||
| 2025-08-13 | 13F | Capital Analysts, Inc. | 115 | 0.00 | 0 | |||||
| 2025-07-22 | 13F | Ergawealth Advisors, Inc. | 96,732 | 2,600 | ||||||
| 2025-07-17 | 13F | Janney Montgomery Scott LLC | 33,124 | 1 | ||||||
| 2025-08-06 | 13F | Mark Sheptoff Financial Planning, Llc | 390 | 0.00 | 10 | 11.11 | ||||
| 2025-07-24 | 13F | NavPoint Financial, Inc. | 50,983 | 195.38 | 1,370 | 232.52 | ||||
| 2025-07-31 | 13F | Cambridge Investment Research Advisors, Inc. | 89,344 | 767.67 | 2 | |||||
| 2025-07-14 | 13F | Main Line Retirement Advisors, LLC | 488,907 | 4,132.96 | 13,142 | 4,678.55 | ||||
| 2025-07-11 | 13F | LongView Wealth Management | 16,861 | 453 | ||||||
| 2025-07-30 | 13F | D.a. Davidson & Co. | 16,720 | 449 | ||||||
| 2025-07-14 | 13F | Ai Financial Services Llc | 52,617 | -4.16 | 1,414 | 7.86 | ||||
| 2025-08-13 | 13F | Capital Group Private Client Services, Inc. | 255,947 | 224.46 | 6,880 | 265.13 | ||||
| 2025-08-15 | 13F | Captrust Financial Advisors | 923,440 | 2,813.80 | 24,822 | 3,179.00 | ||||
| 2025-07-25 | 13F | Envestnet Portfolio Solutions, Inc. | 24,999 | -16.89 | 672 | -6.55 | ||||
| 2025-08-08 | 13F | Kingsview Wealth Management, LLC | 49,984 | 1,344 | ||||||
| 2025-07-23 | 13F | Valmark Advisers, Inc. | 12,610 | 339 | ||||||
| 2025-08-13 | 13F | Cary Street Partners Financial Llc | 193,673 | 5,206 | ||||||
| 2025-08-12 | 13F | LPL Financial LLC | 335,707 | 9,024 | ||||||
| 2025-08-08 | 13F | Avantax Advisory Services, Inc. | 64,937 | 1,746 | ||||||
| 2025-07-28 | 13F | RFG Advisory, LLC | 23,504 | 632 | ||||||
| 2025-08-05 | 13F | Sigma Planning Corp | 20,281 | 1.41 | 545 | 14.26 | ||||
| 2025-07-21 | 13F | Barrett & Company, Inc. | 5,675 | 10.73 | 153 | 24.59 | ||||
| 2025-08-14 | 13F | Benjamin Edwards Inc | 96,264 | 134.13 | 2,588 | 163.44 | ||||
| 2025-07-25 | 13F | Concurrent Investment Advisors, LLC | 96,946 | 139.00 | 2,606 | 168.83 | ||||
| 2025-07-16 | 13F | Midwest Heritage Bank, FSB | 13,574 | 365 | ||||||
| 2025-08-12 | 13F | Steward Partners Investment Advisory, Llc | 209 | 37.50 | 6 | 66.67 | ||||
| 2025-08-14 | 13F | Royal Bank Of Canada | 19,315 | 302.90 | 519 | 351.30 | ||||
| 2025-08-11 | 13F | HighTower Advisors, LLC | 31,636 | 850 | ||||||
| 2025-08-11 | 13F | Beta Wealth Group, Inc. | 267,824 | -1.09 | 7,199 | 11.30 | ||||
| 2025-07-24 | 13F | IFP Advisors, Inc | 1,242 | 0.00 | 33 | 13.79 | ||||
| 2025-08-12 | 13F | Tradition Wealth Management, LLC | 50,990 | 319.67 | 1,371 | 372.41 | ||||
| 2025-07-30 | 13F | Strategic Blueprint, LLC | 352,716 | 68.88 | 9,481 | 90.04 | ||||
| 2025-07-25 | 13F | Cwm, Llc | 299 | 0 | ||||||
| 2025-08-12 | 13F | Proequities, Inc. | 0 | 0 | ||||||
| 2025-07-16 | 13F | ORG Partners LLC | 10,189 | 1,071.15 | 276 | 1,280.00 |