Basic Stats
| Institutional Owners | 100 total, 100 long only, 0 short only, 0 long/short - change of -5.61% MRQ |
| Average Portfolio Allocation | 0.2928 % - change of -8.84% MRQ |
| Institutional Shares (Long) | 7,692,445 (ex 13D/G) - change of -0.23MM shares -2.86% MRQ |
| Institutional Value (Long) | $ 447,112 USD ($1000) |
Institutional Ownership and Shareholders
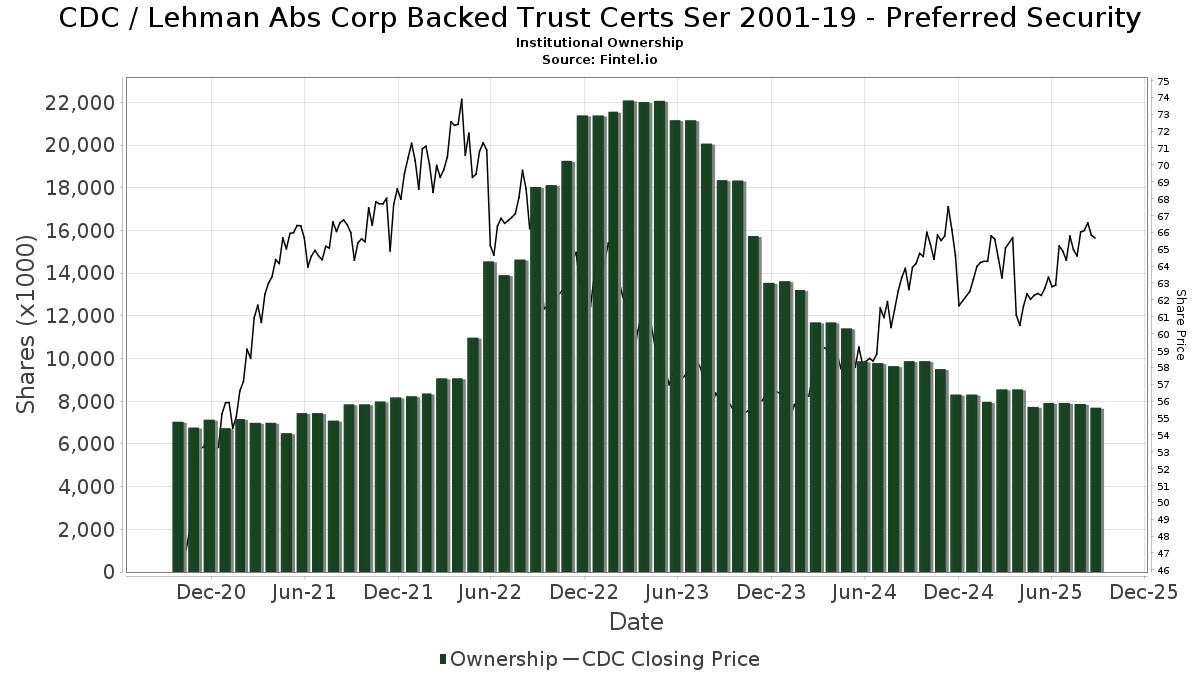
Lehman Abs Corp Backed Trust Certs Ser 2001-19 - Preferred Security (US:CDC) has 100 institutional owners and shareholders that have filed 13D/G or 13F forms with the Securities Exchange Commission (SEC). These institutions hold a total of 7,692,445 shares. Largest shareholders include Morgan Stanley, Raymond James Financial Inc, LPL Financial LLC, Bank Of America Corp /de/, Northwestern Mutual Wealth Management Co, SILVER OAK SECURITIES, Inc, Atlantic Family Wealth, Llc, Cwm, Llc, Royal Bank Of Canada, and Wells Fargo & Company/mn .
Lehman Abs Corp Backed Trust Certs Ser 2001-19 - Preferred Security (OTCPK:CDC) institutional ownership structure shows current positions in the company by institutions and funds, as well as latest changes in position size. Major shareholders can include individual investors, mutual funds, hedge funds, or institutions. The Schedule 13D indicates that the investor holds (or held) more than 5% of the company and intends (or intended) to actively pursue a change in business strategy. Schedule 13G indicates a passive investment of over 5%.
The share price as of September 5, 2025 is 66.04 / share. Previously, on September 9, 2024, the share price was 63.48 / share. This represents an increase of 4.03% over that period.
Fund Sentiment Score
The Fund Sentiment Score (fka Ownership Accumulation Score) finds the stocks that are being most bought by funds. It is the result of a sophisticated, multi-factor quantitative model that identifies companies with the highest levels of institutional accumulation. The scoring model uses a combination of the total increase in disclosed owners, the changes in portfolio allocations in those owners and other metrics. The number ranges from 0 to 100, with higher numbers indicating a higher level of accumulation to its peers, and 50 being the average.
Update Frequency: Daily
See Ownership Explorer, which provides a list of highest-ranking companies.
Institutional Put/Call Ratio
In addition to reporting standard equity and debt issues, institutions with more than 100MM assets under management must also disclose their put and call option holdings. Since put options generally indicate negative sentiment, and call options indicate positive sentiment, we can get a sense of the overall institutional sentiment by plotting the ratio of puts to calls. The chart to the right plots the historical put/call ratio for this instrument.
Using Put/Call Ratio as an indicator of investor sentiment overcomes one of the key deficiencies of using total institutional ownership, which is that a significant amount of assets under management are invested passively to track indices. Passively-managed funds do not typically buy options, so the put/call ratio indicator more closely tracks the sentiment of actively-managed funds.
13F and NPORT Filings
Detail on 13F filings are free. Detail on NP filings require a premium membership. Green rows indicate new positions. Red rows indicate closed positions. Click the link icon to see the full transaction history.
Upgrade
to unlock premium data and export to Excel ![]() .
.
| File Date | Source | Investor | Type | Avg Price (Est) |
Shares | Δ Shares (%) |
Reported Value ($1000) |
Δ Value (%) |
Port Alloc (%) |
|
|---|---|---|---|---|---|---|---|---|---|---|
| 2025-08-05 | 13F | Tiaa Trust, National Association | 3,556 | 227 | ||||||
| 2025-08-11 | 13F | HighTower Advisors, LLC | 32,324 | 3.81 | 2,059 | 0.64 | ||||
| 2025-07-22 | 13F | Unique Wealth, Llc | 7,573 | -33.03 | 482 | -35.13 | ||||
| 2025-08-12 | 13F | Proequities, Inc. | 0 | 0 | ||||||
| 2025-08-18 | 13F | Pacific Center for Financial Services | 227 | 0.00 | 14 | 0.00 | ||||
| 2025-07-31 | 13F | Brinker Capital Investments, LLC | 0 | -100.00 | 0 | -100.00 | ||||
| 2025-09-04 | 13F/A | Advisor Group Holdings, Inc. | 75,773 | 19.99 | 4,829 | 16.31 | ||||
| 2025-08-05 | 13F | Integrity Financial Corp /WA | 3,556 | 0.03 | 227 | -3.00 | ||||
| 2025-07-25 | 13F | Atria Wealth Solutions, Inc. | 7,442 | 474 | ||||||
| 2025-08-01 | 13F | Envestnet Asset Management Inc | 167,067 | -3.36 | 10,644 | -6.31 | ||||
| 2025-08-14 | 13F | Wiley Bros.-aintree Capital, Llc | 47,032 | -0.14 | 3,018 | -1.31 | ||||
| 2025-08-15 | 13F | Equitable Holdings, Inc. | 8,364 | -0.05 | 533 | -3.10 | ||||
| 2025-08-07 | 13F | PFG Advisors | 27,684 | 7.47 | 1,764 | 4.20 | ||||
| 2025-08-14 | 13F | Ameriprise Financial Inc | 143,382 | -12.49 | 9,139 | -15.15 | ||||
| 2025-07-15 | 13F | Axis Wealth Partners, LLC | 13,063 | -0.99 | 832 | -4.04 | ||||
| 2025-08-13 | 13F | EverSource Wealth Advisors, LLC | 384 | -83.28 | 24 | -84.00 | ||||
| 2025-07-09 | 13F | Dynamic Advisor Solutions LLC | 4,211 | 4.39 | 268 | 1.13 | ||||
| 2025-07-24 | 13F | IFP Advisors, Inc | 3,647 | -4.25 | 232 | -7.20 | ||||
| 2025-04-21 | 13F | Nelson, Van Denburg & Campbell Wealth Management Group, LLC | 0 | -100.00 | 0 | |||||
| 2025-08-08 | 13F | Gts Securities Llc | 7,771 | 495 | ||||||
| 2025-07-30 | 13F | Smith Thornton Advisors LLC | 8,480 | -1.17 | 540 | -4.09 | ||||
| 2025-08-08 | 13F | Larson Financial Group LLC | 69 | 0.00 | 4 | 0.00 | ||||
| 2025-08-14 | 13F | Royal Bank Of Canada | 310,273 | 2.05 | 19,768 | -1.07 | ||||
| 2025-08-06 | 13F | Commonwealth Equity Services, Llc | 181,300 | -0.45 | 12 | 0.00 | ||||
| 2025-08-12 | 13F | Garrett Wealth Advisory Group, LLC | 121,243 | -0.58 | 7,724 | -3.62 | ||||
| 2025-04-30 | 13F | Alpha Cubed Investments, LLC | 0 | -100.00 | 0 | -100.00 | ||||
| 2025-08-12 | 13F | one8zero8, LLC | 3,300 | -35.42 | 210 | -37.31 | ||||
| 2025-07-21 | 13F | Patriot Financial Group Insurance Agency, LLC | 7,901 | 0.43 | 503 | -2.71 | ||||
| 2025-07-31 | 13F | Cambridge Investment Research Advisors, Inc. | 170,500 | -19.20 | 11 | -23.08 | ||||
| 2025-08-11 | 13F | Private Advisor Group, LLC | 93,487 | -1.72 | 5,956 | -4.72 | ||||
| 2025-08-01 | 13F | Advisory Alpha, LLC | 4,598 | -0.07 | 293 | -3.31 | ||||
| 2025-08-08 | 13F | Comprehensive Financial Planning, Inc./PA | 7,304 | 0.93 | 465 | -2.11 | ||||
| 2025-04-15 | 13F | Noble Wealth Management PBC | 980 | -3.64 | 64 | 1.59 | ||||
| 2025-07-25 | 13F | Cwm, Llc | 318,509 | 6.73 | 20 | 5.26 | ||||
| 2025-08-14 | 13F | Citadel Advisors Llc | 41,620 | 1,062.25 | 2,652 | 1,028.09 | ||||
| 2025-08-08 | 13F | Avantax Advisory Services, Inc. | 24,647 | -19.33 | 1,570 | -21.77 | ||||
| 2025-08-14 | 13F | Goldman Sachs Group Inc | 60,972 | 16.84 | 3,885 | 13.27 | ||||
| 2025-04-23 | 13F | Crewe Advisors LLC | 0 | -100.00 | 0 | |||||
| 2025-08-12 | 13F | J.w. Cole Advisors, Inc. | 20,698 | -22.30 | 1,319 | -24.69 | ||||
| 2025-08-06 | 13F | Rps Advisory Solutions Llc | 4,373 | -17.51 | 279 | -20.11 | ||||
| 2025-07-15 | 13F | Mather Group, Llc. | 37,805 | -0.84 | 2,409 | -3.87 | ||||
| 2025-07-29 | 13F | Private Trust Co Na | 2,200 | 0.00 | 140 | -2.78 | ||||
| 2025-08-01 | 13F | Bessemer Group Inc | 0 | -100.00 | 0 | |||||
| 2025-08-13 | 13F | Russell Investments Group, Ltd. | 11,040 | 703 | ||||||
| 2025-08-11 | 13F | Beta Wealth Group, Inc. | 0 | -100.00 | 0 | |||||
| 2025-07-28 | 13F | Harbour Investments, Inc. | 158 | 0.00 | 10 | 0.00 | ||||
| 2025-08-14 | 13F | Money Concepts Capital Corp | 51,550 | -7.05 | 3,284 | -9.88 | ||||
| 2025-08-14 | 13F | Comerica Bank | 3,203 | -0.25 | 204 | -3.32 | ||||
| 2025-07-21 | 13F | DHJJ Financial Advisors, Ltd. | 901 | 0.00 | 57 | -3.39 | ||||
| 2025-08-15 | 13F | Keel Point, LLC | 0 | -100.00 | 0 | |||||
| 2025-08-14 | 13F | UBS Group AG | 106,084 | -24.40 | 6,759 | -26.71 | ||||
| 2025-08-14 | 13F | Fmr Llc | 434 | -32.50 | 28 | -35.71 | ||||
| 2025-08-05 | 13F | Huntington National Bank | 72 | -4.05 | ||||||
| 2025-08-13 | 13F | Northwestern Mutual Wealth Management Co | 507,659 | -1.88 | 32,343 | -4.88 | ||||
| 2025-05-12 | 13F | Independent Advisor Alliance | 0 | -100.00 | 0 | |||||
| 2025-08-14 | 13F | Jane Street Group, Llc | 9,456 | 132.56 | 602 | 125.47 | ||||
| 2025-07-25 | 13F | NorthRock Partners, LLC | 2,023 | 0.00 | 129 | -3.03 | ||||
| 2025-08-15 | 13F | Morgan Stanley | 1,258,993 | -2.55 | 80,211 | -5.53 | ||||
| 2025-07-16 | 13F | Signaturefd, Llc | 0 | -100.00 | 0 | |||||
| 2025-08-19 | 13F | Newbridge Financial Services Group, Inc. | 200 | 0.00 | 13 | -7.69 | ||||
| 2025-08-12 | 13F | LPL Financial LLC | 599,519 | -2.90 | 38,195 | -5.87 | ||||
| 2025-08-14 | 13F | Operose Advisors LLC | 136 | 0.00 | 9 | 0.00 | ||||
| 2025-08-15 | 13F | Koesten, Hirschmann & Crabtree, INC. | 24 | 0.00 | 2 | 0.00 | ||||
| 2025-07-29 | 13F | Salus Financial Advisors, LLC | 18,037 | -0.62 | 1,149 | -3.61 | ||||
| 2025-08-12 | 13F | CIBC Private Wealth Group, LLC | 300 | 0.00 | 19 | 11.76 | ||||
| 2025-08-14 | 13F | Susquehanna International Group, Llp | 27,693 | 90.82 | 1,764 | 85.10 | ||||
| 2025-07-29 | 13F | Stratos Wealth Partners, LTD. | 11,364 | -4.98 | 724 | -7.77 | ||||
| 2025-08-14 | 13F | Wells Fargo & Company/mn | 238,715 | -0.53 | 15,209 | -3.57 | ||||
| 2025-07-23 | 13F | Prime Capital Investment Advisors, LLC | 0 | -100.00 | 0 | |||||
| 2025-08-14 | 13F | Old Mission Capital Llc | 4,634 | 295 | ||||||
| 2025-08-07 | 13F | Allworth Financial LP | 4,303 | 0.00 | 274 | 3.01 | ||||
| 2025-08-12 | 13F | Steward Partners Investment Advisory, Llc | 5,427 | -3.67 | 346 | -6.76 | ||||
| 2025-08-14 | 13F/A | Rockefeller Capital Management L.P. | 21,978 | -6.88 | 1,400 | -9.74 | ||||
| 2025-08-15 | 13F | Tower Research Capital LLC (TRC) | 17 | -29.17 | 1 | 0.00 | ||||
| 2025-08-11 | 13F | Advisor Resource Council | 0 | -100.00 | 0 | |||||
| 2025-03-17 | 13F/A | Wealth Enhancement Advisory Services, Llc | 0 | -100.00 | 0 | |||||
| 2025-08-12 | 13F | NWF Advisory Services Inc. | 0 | -100.00 | 0 | |||||
| 2025-08-06 | 13F | Vantage Financial Partners, LLC | 6,595 | -26.86 | 420 | -29.05 | ||||
| 2025-07-14 | 13F | Strategic Planning Group, Llc | 22,367 | 9.43 | 1,425 | 6.11 | ||||
| 2025-07-21 | 13F | Ameritas Advisory Services, LLC | 637 | 41 | ||||||
| 2025-08-12 | 13F | Park Square Financial Group, LLC | 34 | 0.00 | 2 | 0.00 | ||||
| 2025-08-14 | 13F | Bank Of America Corp /de/ | 577,860 | 1.03 | 36,815 | -2.06 | ||||
| 2025-08-14 | 13F | Sunbelt Securities, Inc. | 313 | 66.49 | 20 | 58.33 | ||||
| 2025-08-08 | 13F | Cetera Investment Advisers | 50,661 | 3.59 | 3,228 | 0.40 | ||||
| 2025-08-07 | 13F | Kestra Private Wealth Services, Llc | 9,124 | 0.39 | 581 | -2.68 | ||||
| 2025-08-11 | 13F | Aptus Capital Advisors, LLC | 248 | 0.81 | 16 | -6.25 | ||||
| 2025-08-15 | 13F | First Heartland Consultants, Inc. | 5,474 | 0.00 | 349 | -3.06 | ||||
| 2025-08-13 | 13F | Rsm Us Wealth Management Llc | 5,491 | 0.00 | 350 | -3.06 | ||||
| 2025-08-14 | 13F | Two Sigma Investments, Lp | 0 | -100.00 | 0 | |||||
| 2025-07-30 | 13F | Strategic Blueprint, LLC | 54,597 | 0.98 | 3,478 | -2.11 | ||||
| 2025-08-14 | 13F | Great Valley Advisor Group, Inc. | 9,758 | -18.59 | 622 | -21.09 | ||||
| 2025-07-30 | 13F/A | KPP Advisory Services LLC | 25,207 | -1.83 | 1,606 | -4.86 | ||||
| 2025-08-14 | 13F | Integrated Wealth Concepts LLC | 113,394 | -2.69 | 7,224 | -5.67 | ||||
| 2025-07-11 | 13F | Farther Finance Advisors, LLC | 413 | 0.00 | 26 | -3.70 | ||||
| 2025-08-14 | 13F | Becker Capital Management Inc | 0 | -100.00 | 0 | |||||
| 2025-07-11 | 13F | SILVER OAK SECURITIES, Inc | 499,265 | -2.64 | 31,808 | -4.46 | ||||
| 2025-08-14 | 13F | CoreCap Advisors, LLC | 6,789 | -2.05 | 433 | -5.05 | ||||
| 2025-08-14 | 13F | Mariner, LLC | 6,108 | 0.59 | 389 | -2.51 | ||||
| 2025-08-05 | 13F | GPS Wealth Strategies Group, LLC | 11,919 | -0.96 | 759 | -3.92 | ||||
| 2025-08-12 | 13F | Jpmorgan Chase & Co | 241 | -61.38 | 15 | -63.41 | ||||
| 2025-07-21 | 13F | Ameriflex Group, Inc. | 6,096 | 0.25 | 386 | -3.26 | ||||
| 2025-08-12 | 13F | Global Retirement Partners, LLC | 5,404 | -0.07 | 344 | 1.78 | ||||
| 2025-08-12 | 13F | Atlantic Family Wealth, Llc | 374,605 | 1.09 | 23,866 | -1.85 | ||||
| 2025-08-13 | 13F | StoneX Group Inc. | 12,570 | -0.56 | 801 | -3.61 | ||||
| 2025-08-13 | 13F | Keystone Financial Group | 33,906 | -3.97 | 2,160 | -6.90 | ||||
| 2025-08-14 | 13F | Hrt Financial Lp | 5,455 | 77.11 | 0 | |||||
| 2025-08-14 | 13F | GWM Advisors LLC | 41,889 | -4.96 | 2,669 | -7.87 | ||||
| 2025-07-08 | 13F | Nbc Securities, Inc. | 400 | 0.00 | 0 | |||||
| 2025-08-12 | 13F | Calton & Associates, Inc. | 6,161 | -7.17 | 393 | -10.09 | ||||
| 2025-07-24 | 13F | Capital Advisors, Ltd. LLC | 162 | 0.00 | 0 | |||||
| 2025-08-04 | 13F | Atria Investments Llc | 0 | -100.00 | 0 | |||||
| 2025-08-04 | 13F | Flagship Harbor Advisors, Llc | 8,571 | 0.86 | 546 | -2.15 | ||||
| 2025-08-14 | 13F | Stifel Financial Corp | 72,661 | 4.39 | 4,629 | 1.20 | ||||
| 2025-08-18 | 13F | Geneos Wealth Management Inc. | 2,682 | 22.30 | 171 | 18.06 | ||||
| 2025-05-12 | 13F | Claro Advisors LLC | 0 | -100.00 | 0 | -100.00 | ||||
| 2025-08-14 | 13F | Raymond James Financial Inc | 758,693 | -9.09 | 48,336 | -11.87 | ||||
| 2025-08-15 | 13F | Kestra Advisory Services, LLC | 18,321 | 15.07 | 1,167 | 11.57 | ||||
| 2025-05-15 | 13F | CAPROCK Group, Inc. | 43,162 | 0.33 | 2,837 | 5.35 | ||||
| 2025-07-18 | 13F | Truist Financial Corp | 38,049 | -1.24 | 2,424 | -4.23 |