Basic Stats
| Institutional Owners | 164 total, 164 long only, 0 short only, 0 long/short - change of -4.07% MRQ |
| Average Portfolio Allocation | 0.1232 % - change of -8.22% MRQ |
| Institutional Shares (Long) | 32,658,930 (ex 13D/G) - change of -0.30MM shares -0.91% MRQ |
| Institutional Value (Long) | $ 433,203 USD ($1000) |
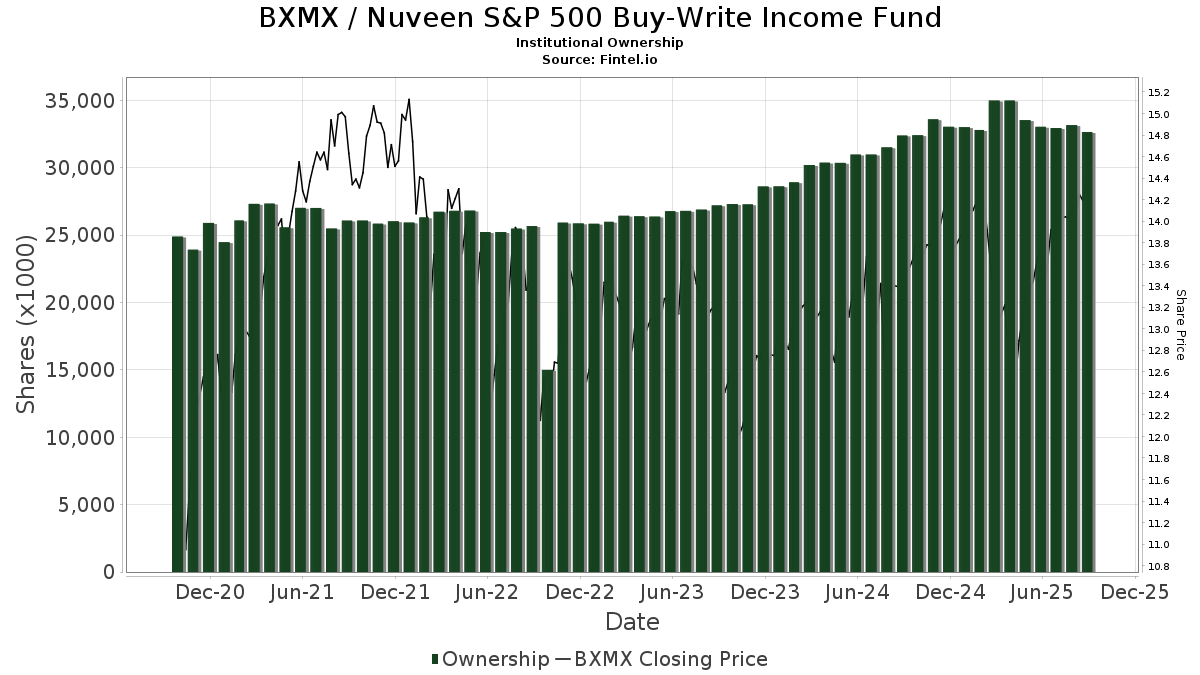
Institutional Ownership and Shareholders
Nuveen S&P 500 Buy-Write Income Fund (US:BXMX) has 164 institutional owners and shareholders that have filed 13D/G or 13F forms with the Securities Exchange Commission (SEC). These institutions hold a total of 32,658,930 shares. Largest shareholders include Morgan Stanley, Wells Fargo & Company/mn, LPL Financial LLC, Invesco Ltd., UBS Group AG, PCEF - Invesco CEF Income Composite ETF, Raymond James Financial Inc, Advisors Asset Management, Inc., Allspring Global Investments Holdings, LLC, and Bank Of America Corp /de/ .
Nuveen S&P 500 Buy-Write Income Fund (NYSE:BXMX) institutional ownership structure shows current positions in the company by institutions and funds, as well as latest changes in position size. Major shareholders can include individual investors, mutual funds, hedge funds, or institutions. The Schedule 13D indicates that the investor holds (or held) more than 5% of the company and intends (or intended) to actively pursue a change in business strategy. Schedule 13G indicates a passive investment of over 5%.
The share price as of September 10, 2025 is 14.37 / share. Previously, on September 11, 2024, the share price was 13.44 / share. This represents an increase of 6.92% over that period.
Fund Sentiment Score
The Fund Sentiment Score (fka Ownership Accumulation Score) finds the stocks that are being most bought by funds. It is the result of a sophisticated, multi-factor quantitative model that identifies companies with the highest levels of institutional accumulation. The scoring model uses a combination of the total increase in disclosed owners, the changes in portfolio allocations in those owners and other metrics. The number ranges from 0 to 100, with higher numbers indicating a higher level of accumulation to its peers, and 50 being the average.
Update Frequency: Daily
See Ownership Explorer, which provides a list of highest-ranking companies.
Institutional Put/Call Ratio
In addition to reporting standard equity and debt issues, institutions with more than 100MM assets under management must also disclose their put and call option holdings. Since put options generally indicate negative sentiment, and call options indicate positive sentiment, we can get a sense of the overall institutional sentiment by plotting the ratio of puts to calls. The chart to the right plots the historical put/call ratio for this instrument.
Using Put/Call Ratio as an indicator of investor sentiment overcomes one of the key deficiencies of using total institutional ownership, which is that a significant amount of assets under management are invested passively to track indices. Passively-managed funds do not typically buy options, so the put/call ratio indicator more closely tracks the sentiment of actively-managed funds.
13F and NPORT Filings
Detail on 13F filings are free. Detail on NP filings require a premium membership. Green rows indicate new positions. Red rows indicate closed positions. Click the link icon to see the full transaction history.
Upgrade
to unlock premium data and export to Excel ![]() .
.
| File Date | Source | Investor | Type | Avg Price (Est) |
Shares | Δ Shares (%) |
Reported Value ($1000) |
Δ Value (%) |
Port Alloc (%) |
|
|---|---|---|---|---|---|---|---|---|---|---|
| 2025-07-15 | 13F | World Equity Group, Inc. | 26,750 | 102.65 | 371 | 114.45 | ||||
| 2025-07-10 | 13F | Oliver Lagore Vanvalin Investment Group | 9,597 | 0.00 | 126 | -6.72 | ||||
| 2025-08-14 | 13F | Hilltop Holdings Inc. | 39,598 | -11.90 | 550 | -6.79 | ||||
| 2025-08-18 | 13F | Hollencrest Capital Management | 8,609 | 0.00 | 119 | 6.25 | ||||
| 2025-07-16 | 13F | Signaturefd, Llc | 2,511 | 35 | ||||||
| 2025-08-14 | 13F | Polar Asset Management Partners Inc. | 156,696 | 2,175 | ||||||
| 2025-07-16 | 13F | Twelve Points Wealth Management LLC | 432,690 | 4.27 | 6,006 | 10.30 | ||||
| 2025-08-12 | 13F | Wealth Dimensions Group, Ltd. | 10,943 | -10.69 | 152 | -5.62 | ||||
| 2025-07-24 | 13F | IFP Advisors, Inc | 5,200 | -7.14 | 72 | -1.37 | ||||
| 2025-07-29 | 13F | International Assets Investment Management, Llc | 47,367 | 10.33 | 657 | 16.70 | ||||
| 2025-08-14 | 13F | GWM Advisors LLC | 87,831 | 102.31 | 1,219 | 114.24 | ||||
| 2025-08-11 | 13F | Delta Asset Management Llc/tn | 1,800 | 0.00 | 25 | 4.35 | ||||
| 2025-03-12 | 13F/A | Private Capital Management Llc | 0 | -100.00 | 0 | |||||
| 2025-08-12 | 13F | Advisors Asset Management, Inc. | 927,730 | 18.19 | 12,877 | 25.03 | ||||
| 2025-08-07 | 13F | BOK Financial Private Wealth, Inc. | 1,957 | 0.00 | 28 | 3.85 | ||||
| 2025-08-14 | 13F | Apriem Advisors | 17,968 | 0.00 | 249 | 5.96 | ||||
| 2025-07-17 | 13F | Janney Montgomery Scott LLC | 269,380 | 27.32 | 4 | 50.00 | ||||
| 2025-08-06 | 13F | Maltin Wealth Management, Inc. | 18,291 | 1.72 | 254 | 7.66 | ||||
| 2025-07-25 | 13F | Hazlett, Burt & Watson, Inc. | 7,594 | -21.89 | 0 | |||||
| 2025-07-23 | 13F | Joel Isaacson & Co., LLC | 0 | -100.00 | 0 | |||||
| 2025-07-24 | 13F | Costello Asset Management, INC | 100 | 0.00 | 1 | 0.00 | ||||
| 2025-08-14 | 13F | Mml Investors Services, Llc | 17,905 | 5.32 | 0 | |||||
| 2025-08-07 | 13F | Readystate Asset Management Lp | 0 | -100.00 | 0 | |||||
| 2025-08-08 | 13F | Cornerstone Advisors, LLC | 380,684 | -45.66 | 5,284 | -42.52 | ||||
| 2025-08-13 | 13F | StoneX Group Inc. | 26,437 | -20.26 | 373 | -16.03 | ||||
| 2025-07-25 | 13F | Cwm, Llc | 1,748 | 0.00 | 0 | |||||
| 2025-07-08 | 13F | Nbc Securities, Inc. | 28,864 | -0.71 | 0 | |||||
| 2025-07-17 | 13F | Venture Visionary Partners LLC | 52,681 | -3.03 | 731 | 2.67 | ||||
| 2025-08-14 | 13F | Wiley Bros.-aintree Capital, Llc | 87,808 | 67.66 | 1,219 | 78.59 | ||||
| 2025-07-29 | 13F | Hoese & Co LLP | 875 | -50.00 | 12 | -45.45 | ||||
| 2025-08-01 | 13F | Envestnet Asset Management Inc | 167,022 | -4.50 | 2,318 | 1.05 | ||||
| 2025-08-13 | 13F | Kayne Anderson Rudnick Investment Management Llc | 465 | 0.00 | 6 | 0.00 | ||||
| 2025-08-12 | 13F | Steward Partners Investment Advisory, Llc | 50,446 | 1.03 | 700 | 6.87 | ||||
| 2025-08-14 | 13F | Two Sigma Investments, Lp | 169,380 | 2,351 | ||||||
| 2025-08-13 | 13F | Global Endowment Management, LP | 0 | -100.00 | 0 | |||||
| 2025-05-08 | 13F | Plante Moran Financial Advisors, LLC | 0 | -100.00 | 0 | |||||
| 2025-04-29 | 13F | Pensionmark Financial Group, Llc | 0 | -100.00 | 0 | |||||
| 2025-08-12 | 13F | LPL Financial LLC | 1,629,051 | 0.85 | 22,611 | 6.69 | ||||
| 2025-08-12 | 13F | Proequities, Inc. | 0 | 0 | ||||||
| 2025-08-07 | 13F | Hennion & Walsh Asset Management, Inc. | 104,200 | 99.24 | 1,446 | 110.79 | ||||
| 2025-08-14 | 13F | Royal Bank Of Canada | 479,512 | -3.25 | 6,656 | 2.37 | ||||
| 2025-08-12 | 13F | Pathstone Holdings, LLC | 17,537 | 0.00 | 243 | 5.65 | ||||
| 2025-08-15 | 13F | Kestra Advisory Services, LLC | 74,671 | 11.09 | 1,036 | 17.59 | ||||
| 2025-08-04 | 13F | Carret Asset Management, Llc | 10,000 | 0.00 | 139 | 5.34 | ||||
| 2025-08-15 | 13F | Captrust Financial Advisors | 15,769 | 219 | ||||||
| 2025-08-13 | 13F | Invesco Ltd. | 1,507,507 | -0.41 | 20,924 | 5.36 | ||||
| 2025-07-15 | 13F | Bay Capital Advisors, LLC | 15,950 | 0.00 | 221 | 5.74 | ||||
| 2025-08-15 | 13F | Puff Wealth Management, Llc | 81,552 | 3.15 | 1,132 | 9.06 | ||||
| 2025-08-12 | 13F | Wood Tarver Financial Group, LLC | 21 | 0.00 | 0 | |||||
| 2025-07-25 | 13F | Northwest Capital Management Inc | 978 | 0.00 | 14 | 8.33 | ||||
| 2025-07-31 | 13F | Cambridge Investment Research Advisors, Inc. | 567,331 | 1.63 | 8 | 0.00 | ||||
| 2025-07-25 | 13F | Stephens Consulting, LLC | 0 | -100.00 | 0 | |||||
| 2025-05-12 | 13F | Independent Advisor Alliance | 0 | -100.00 | 0 | -100.00 | ||||
| 2025-08-07 | 13F | Kestra Private Wealth Services, Llc | 18,292 | 5.02 | 254 | 10.96 | ||||
| 2025-08-14 | 13F | Wells Fargo & Company/mn | 1,689,550 | 1.44 | 23,451 | 7.32 | ||||
| 2025-07-28 | 13F | BRYN MAWR TRUST Co | 504 | 0.00 | 7 | 0.00 | ||||
| 2025-03-11 | 13F/A | Elequin Capital Lp | 0 | -100.00 | 0 | |||||
| 2025-07-14 | 13F | Matrix Trust Co | 57,855 | 0.67 | 1 | |||||
| 2025-07-09 | 13F | Triumph Capital Management | 17,432 | 0.00 | 242 | 5.70 | ||||
| 2025-05-15 | 13F | Talon Private Wealth, LLC | 0 | -100.00 | 0 | -100.00 | ||||
| 2025-05-05 | 13F | Lindbrook Capital, Llc | 690,062 | 0.00 | 9,054 | -6.22 | ||||
| 2025-07-14 | 13F | Park Avenue Securities Llc | 122,039 | -4.13 | 2 | 0.00 | ||||
| 2025-08-11 | 13F | Blue Bell Private Wealth Management, Llc | 5,680 | 2.64 | 79 | 8.33 | ||||
| 2025-08-06 | 13F | Commonwealth Equity Services, Llc | 327,849 | -6.20 | 5 | 0.00 | ||||
| 2025-08-07 | 13F | Commerce Bank | 15,819 | 0.00 | 220 | 5.80 | ||||
| 2025-05-06 | 13F | MCF Advisors LLC | 0 | -100.00 | 0 | |||||
| 2025-08-05 | 13F | Bank of New York Mellon Corp | 12,762 | 8.09 | 177 | 14.94 | ||||
| 2025-08-14 | 13F | Susquehanna International Group, Llp | 0 | -100.00 | 0 | |||||
| 2025-07-21 | 13F | Ameritas Advisory Services, LLC | 3,090 | 43 | ||||||
| 2025-08-12 | 13F | Landscape Capital Management, L.l.c. | 0 | -100.00 | 0 | |||||
| 2025-05-08 | 13F | Private Advisory Group LLC | 0 | -100.00 | 0 | |||||
| 2025-08-11 | 13F | Rothschild Investment Llc | 693 | 0.00 | 10 | 0.00 | ||||
| 2025-08-14 | 13F | Atomi Financial Group, Inc. | 77,062 | -5.89 | 1,070 | -0.47 | ||||
| 2025-08-11 | 13F | Citigroup Inc | 2,650 | 0.00 | 37 | 5.88 | ||||
| 2025-08-27 | NP | RYDEX VARIABLE TRUST - Multi-Hedge Strategies Fund Variable Annuity | 230 | -19.30 | 3 | 0.00 | ||||
| 2025-07-15 | 13F | Focused Wealth Management, Inc | 333,887 | 1.57 | 4,634 | 7.47 | ||||
| 2025-08-05 | 13F | Key FInancial Inc | 37 | 0.00 | 1 | |||||
| 2025-07-24 | 13F | Leo Wealth, LLC | 34,991 | 0.00 | 486 | 5.66 | ||||
| 2025-08-14 | 13F | Mariner, LLC | 16,381 | 12.93 | 227 | 19.47 | ||||
| 2025-08-19 | 13F | Newbridge Financial Services Group, Inc. | 1,061 | 15 | ||||||
| 2025-04-15 | 13F | Fiduciary Financial Group, Llc | 0 | -100.00 | 0 | |||||
| 2025-07-28 | NP | PCEF - Invesco CEF Income Composite ETF This fund is a listed as child fund of Invesco Ltd. and if that institution has disclosed ownership in this security, then these positions will not be double counted when calculating total shares and total value | 1,465,087 | -0.51 | 19,735 | -3.24 | ||||
| 2025-08-13 | 13F | Rsm Us Wealth Management Llc | 17,671 | -0.82 | 250 | 5.04 | ||||
| 2025-05-06 | 13F | Venturi Wealth Management, LLC | 0 | -100.00 | 0 | |||||
| 2025-07-22 | 13F | DAVENPORT & Co LLC | 13,927 | 0.00 | 193 | 6.04 | ||||
| 2025-07-30 | 13F | D.a. Davidson & Co. | 48,594 | 0.70 | 674 | 6.48 | ||||
| 2025-08-14 | 13F | UBS Group AG | 1,488,300 | -4.04 | 20,658 | 1.52 | ||||
| 2025-08-04 | 13F | Spire Wealth Management | 37,364 | 10.23 | 519 | 16.67 | ||||
| 2025-08-08 | 13F | Avantax Advisory Services, Inc. | 22,147 | 18.73 | 307 | 25.82 | ||||
| 2025-08-05 | 13F | Prosperity Wealth Management, Inc. | 123,745 | 1.21 | 1,718 | 7.04 | ||||
| 2025-08-06 | 13F | Marco Investment Management Llc | 27,300 | 0.00 | 379 | 5.59 | ||||
| 2025-08-12 | 13F | Founders Financial Alliance, LLC | 12,908 | -0.20 | 179 | 5.92 | ||||
| 2025-08-14 | 13F | Kovitz Investment Group Partners, LLC | 105,731 | 39.30 | 1,468 | 47.54 | ||||
| 2025-08-14 | 13F | Bank Of America Corp /de/ | 823,947 | 2.94 | 11,436 | 8.90 | ||||
| 2025-08-12 | 13F | Armor Investment Advisors, LLC | 19,673 | -0.07 | 273 | 5.81 | ||||
| 2025-07-28 | 13F | Harbour Investments, Inc. | 1,825 | 25 | ||||||
| 2025-08-19 | 13F | National Asset Management, Inc. | 31,119 | -70.37 | 432 | -70.66 | ||||
| 2025-07-29 | 13F | Private Trust Co Na | 2,000 | -12.78 | 28 | -10.00 | ||||
| 2025-07-25 | 13F | Allspring Global Investments Holdings, LLC | 905,057 | 42.10 | 12,562 | 50.34 | ||||
| 2025-07-14 | 13F | Farmers & Merchants Investments Inc | 1,850 | 0.00 | 26 | 4.17 | ||||
| 2025-08-14 | 13F | NCP Inc. | 127,332 | 0.82 | 1,767 | 6.64 | ||||
| 2025-07-29 | 13F | Sims Investment Management, Llc | 60,100 | 0.00 | 834 | 5.84 | ||||
| 2025-08-14 | 13F | Glen Eagle Advisors, LLC | 15,970 | -21.96 | 222 | -17.54 | ||||
| 2025-08-14 | 13F | Cnh Partners Llc | 361,193 | -23.44 | 4,992 | -18.61 | ||||
| 2025-08-13 | 13F | Baird Financial Group, Inc. | 29,808 | -4.34 | 414 | 1.23 | ||||
| 2025-08-05 | 13F | Shaker Financial Services, LLC | 77,595 | -62.94 | 1,106 | -60.77 | ||||
| 2025-08-13 | 13F | Colonial Trust Co / SC | 254 | 0.00 | 3 | 0.00 | ||||
| 2025-08-04 | 13F | Horizon Wealth Management, LLC | 11,660 | 0.00 | 162 | 5.92 | ||||
| 2025-07-16 | 13F | St Germain D J Co Inc | 187 | 0.00 | 3 | 0.00 | ||||
| 2025-08-13 | 13F | Colonial Trust Advisors | 2,200 | 31 | ||||||
| 2025-08-27 | NP | RYMSX - Guggenheim Multi-Hedge Strategies Fund Class P | 137 | -37.44 | 2 | -50.00 | ||||
| 2025-08-11 | 13F | Annis Gardner Whiting Capital Advisors, LLC | 3,000 | 0.00 | 42 | 5.13 | ||||
| 2025-08-12 | 13F | CIBC Private Wealth Group, LLC | 33 | 0.00 | 0 | |||||
| 2025-08-18 | 13F | Arq Wealth Advisors, Llc | 0 | -100.00 | 0 | |||||
| 2025-08-05 | 13F | Sage Capital Management, LLC | 255,095 | 2.35 | 3,541 | 8.26 | ||||
| 2025-08-12 | 13F | Coldstream Capital Management Inc | 0 | -100.00 | 0 | |||||
| 2025-08-06 | 13F | SOUTH STATE Corp | 978 | 0.00 | 14 | 8.33 | ||||
| 2025-07-25 | 13F | Integrated Capital Management, Inc. | 23,069 | 2.70 | 320 | 8.84 | ||||
| 2025-08-11 | 13F | Nations Financial Group Inc, /ia/ /adv | 20,877 | -6.92 | 290 | -1.70 | ||||
| 2025-08-14 | 13F | Wealth Preservation Advisors, LLC | 7,655 | 0.00 | 106 | 6.00 | ||||
| 2025-08-05 | 13F | Huntington National Bank | 35 | 0.00 | ||||||
| 2025-07-15 | 13F | Financial Management Professionals, Inc. | 314 | 0.00 | 4 | 0.00 | ||||
| 2025-08-04 | 13F | Kovack Advisors, Inc. | 12,778 | -3.77 | 177 | 1.72 | ||||
| 2025-04-22 | 13F | Castleview Partners, Llc | 0 | -100.00 | 0 | |||||
| 2025-07-24 | 13F | Us Bancorp \de\ | 5,000 | 0.00 | 69 | 6.15 | ||||
| 2025-07-18 | 13F | Truist Financial Corp | 41,249 | -0.07 | 573 | 5.73 | ||||
| 2025-07-07 | 13F | Bangor Savings Bank | 1,057 | -45.99 | 15 | -44.00 | ||||
| 2025-08-13 | 13F | Summit Financial, LLC | 26,414 | 116.45 | 373 | 133.13 | ||||
| 2025-08-06 | 13F | Prospera Financial Services Inc | 100,783 | 1.49 | 1,399 | 7.37 | ||||
| 2025-07-08 | 13F | Apella Capital, LLC | 15,035 | 0.00 | 209 | 8.33 | ||||
| 2025-07-21 | 13F | Pflug Koory, LLC | 33,682 | 0.00 | 468 | 5.90 | ||||
| 2025-07-17 | 13F | Jackson, Grant Investment Advisers, Inc. | 31,103 | 1.49 | 432 | 7.21 | ||||
| 2025-08-14 | 13F | Ameriprise Financial Inc | 313,236 | -21.45 | 4,334 | -17.17 | ||||
| 2025-08-20 | NP | ADANX - AQR Diversified Arbitrage Fund Class N | 119,046 | -13.55 | 1,652 | -8.53 | ||||
| 2025-08-06 | 13F | Moors & Cabot, Inc. | 73,052 | -44.65 | 1,014 | -41.48 | ||||
| 2025-08-08 | 13F | Cetera Investment Advisers | 153,547 | 8.89 | 2,131 | 15.19 | ||||
| 2025-08-18 | 13F | Geneos Wealth Management Inc. | 9,252 | -1.76 | 128 | 4.07 | ||||
| 2025-07-08 | 13F | Arlington Trust Co LLC | 6,000 | 0.00 | 83 | 6.41 | ||||
| 2025-07-23 | 13F | Tyche Wealth Partners LLC | 25,640 | 0.07 | 356 | 5.65 | ||||
| 2025-08-14 | 13F | CoreFirst Bank & Trust | 930 | 13 | ||||||
| 2025-08-22 | NP | Cornerstone Total Return Fund Inc | 87,486 | -63.05 | 1,214 | -60.91 | ||||
| 2025-07-16 | 13F | Encompass Wealth Advisors, Llc | 14,207 | -37.20 | 197 | -33.45 | ||||
| 2025-04-23 | 13F | Continuum Advisory, LLC | 0 | -100.00 | 0 | |||||
| 2025-08-13 | 13F | Northwestern Mutual Wealth Management Co | 47,387 | 3.15 | 658 | 9.14 | ||||
| 2025-05-15 | 13F | Gwn Securities Inc. | 0 | -100.00 | 0 | |||||
| 2025-08-14 | 13F | Raymond James Financial Inc | 951,409 | -0.65 | 13,206 | 5.11 | ||||
| 2025-08-07 | 13F | Allworth Financial LP | 36,858 | 244.79 | 512 | 278.52 | ||||
| 2025-08-11 | 13F | HighTower Advisors, LLC | 37,334 | -13.43 | 518 | -8.32 | ||||
| 2025-07-07 | 13F | Centurion Wealth Management LLC | 12,318 | 0.00 | 171 | -1.16 | ||||
| 2025-07-10 | 13F | Global Financial Private Client, LLC | 0 | -100.00 | 0 | |||||
| 2025-07-29 | 13F | Commons Capital, Llc | 15,127 | 1.34 | 210 | 7.18 | ||||
| 2025-07-24 | 13F | Eastern Bank | 2,199 | 0.00 | 31 | 7.14 | ||||
| 2025-08-11 | 13F | Alteri Wealth LLC | 47,955 | 10.48 | 666 | 16.87 | ||||
| 2025-06-04 | 13F | Pvg Asset Management Corp | 0 | -100.00 | 0 | |||||
| 2025-07-01 | 13F | Harbor Investment Advisory, Llc | 2,468 | 0.00 | 34 | 6.25 | ||||
| 2025-07-25 | 13F | Atria Wealth Solutions, Inc. | 14,914 | -69.25 | 211 | -67.34 | ||||
| 2025-07-21 | 13F | Patriot Financial Group Insurance Agency, LLC | 27,630 | 0.93 | 384 | 6.69 | ||||
| 2025-08-08 | 13F | Pnc Financial Services Group, Inc. | 32,256 | 29.21 | 448 | 36.70 | ||||
| 2025-05-14 | 13F | ICONIQ Capital, LLC | 0 | -100.00 | 0 | |||||
| 2025-07-16 | 13F | Investment Partners Asset Management, Inc. | 37,219 | -0.24 | 517 | 5.52 | ||||
| 2025-08-08 | 13F | Fortis Group Advisors, LLC | 250 | 0.00 | 3 | 0.00 | ||||
| 2025-08-14 | 13F/A | Rockefeller Capital Management L.P. | 34,524 | 1.75 | 479 | 7.64 | ||||
| 2025-04-25 | 13F | Smallwood Wealth Investment Management, LLC | 4,027 | 53 | ||||||
| 2025-08-13 | 13F | MONECO Advisors, LLC | 257,967 | -2.18 | 3,581 | 3.50 | ||||
| 2025-08-12 | 13F | Bokf, Na | 0 | -100.00 | 0 | |||||
| 2025-08-12 | 13F | Richmond Investment Services, LLC | 114,171 | 95.73 | 1,585 | 107.06 | ||||
| 2025-05-08 | 13F | Essential Planning, LLC. | 0 | -100.00 | 0 | |||||
| 2025-05-07 | 13F | Sheaff Brock Investment Advisors, LLC | 13,188 | -0.08 | 173 | -5.98 | ||||
| 2025-09-04 | 13F/A | Advisor Group Holdings, Inc. | 380,959 | 3.05 | 5,288 | 9.03 | ||||
| 2025-08-14 | 13F | Quantedge Capital Pte Ltd | 0 | -100.00 | 0 | |||||
| 2025-07-18 | 13F | TPG Advisors LLC | 138,713 | -0.49 | 1,925 | 5.31 | ||||
| 2025-08-05 | 13F | Palogic Value Management, L.P. | 21,371 | -2.29 | 297 | 3.50 | ||||
| 2025-05-06 | 13F | Atria Investments Llc | 0 | -100.00 | 0 | |||||
| 2025-07-15 | 13F | Shulman DeMeo Asset Management LLC | 96,095 | -0.12 | 1,334 | 5.63 | ||||
| 2025-07-11 | 13F | Pinnacle Bancorp, Inc. | 2,895 | 40 | ||||||
| 2025-08-08 | 13F | Creative Planning | 0 | -100.00 | 0 | |||||
| 2025-08-11 | 13F | WPG Advisers, LLC | 683 | -35.63 | 9 | -30.77 | ||||
| 2025-08-13 | 13F | Green Harvest Asset Management LLC | 15,760 | 0.00 | 219 | 5.83 | ||||
| 2025-08-08 | 13F | Islay Capital Management, Llc | 76,317 | -4.91 | 1,059 | 0.67 | ||||
| 2025-08-14 | 13F | Comerica Bank | 92,866 | 3.05 | 1,289 | 8.97 | ||||
| 2025-08-14 | 13F | CoreCap Advisors, LLC | 20,656 | 55.19 | 287 | 64.37 | ||||
| 2025-06-12 | 13F/A | Deutsche Bank Ag\ | 0 | -100.00 | 0 | |||||
| 2025-08-14 | 13F | Great Valley Advisor Group, Inc. | 0 | -100.00 | 0 | |||||
| 2025-08-14 | 13F | Wetherby Asset Management Inc | 26,302 | 109.85 | 365 | 108.57 | ||||
| 2025-04-16 | 13F | Fortitude Family Office, LLC | 0 | -100.00 | 0 | |||||
| 2025-08-12 | 13F | Jpmorgan Chase & Co | 2,528 | 4.08 | 35 | 12.90 | ||||
| 2025-08-13 | 13F | Guggenheim Capital Llc | 723,627 | 8.17 | 10,044 | 14.44 | ||||
| 2025-05-02 | 13F | Legacy Capital Wealth Partners, LLC | 0 | -100.00 | 0 | -100.00 | ||||
| 2025-08-14 | 13F | Stifel Financial Corp | 302,608 | 7.54 | 4,200 | 13.79 | ||||
| 2025-07-30 | 13F | FNY Investment Advisers, LLC | 5,000 | 0.00 | 0 | |||||
| 2025-08-14 | 13F | Jane Street Group, Llc | 0 | -100.00 | 0 | |||||
| 2025-08-15 | 13F | Morgan Stanley | 11,835,003 | 2.03 | 164,270 | 7.94 | ||||
| 2025-08-04 | 13F | Wolverine Asset Management Llc | 0 | -100.00 | 0 | |||||
| 2025-07-16 | 13F | Instrumental Wealth, Llc | 25,251 | 5.92 | 353 | 15.41 | ||||
| 2025-08-14 | 13F | Colony Group, LLC | 30,143 | 21.39 | 418 | 28.62 | ||||
| 2025-07-30 | 13F | Patten Group, Inc. | 58,215 | -0.73 | 808 | 5.07 | ||||
| 2025-07-31 | 13F | Blake Schutter Theil Wealth Advisors, LLC | 68,604 | 0.24 | 952 | 6.13 | ||||
| 2025-08-07 | 13F | Clarity Wealth Advisors, LLC | 10,091 | -17.10 | 140 | -11.95 | ||||
| 2025-07-11 | 13F | Farther Finance Advisors, LLC | 3,600 | 380.00 | 50 | 444.44 | ||||
| 2025-07-23 | 13F | Ameliora Wealth Management Ltd. | 200 | 0.00 | 3 | 0.00 | ||||
| 2025-08-22 | NP | Cornerstone Strategic Value Fund Inc | 293,198 | -36.79 | 4,070 | -33.13 |