Basic Stats
| Institutional Owners | 116 total, 116 long only, 0 short only, 0 long/short - change of 10.48% MRQ |
| Average Portfolio Allocation | 0.1732 % - change of -16.84% MRQ |
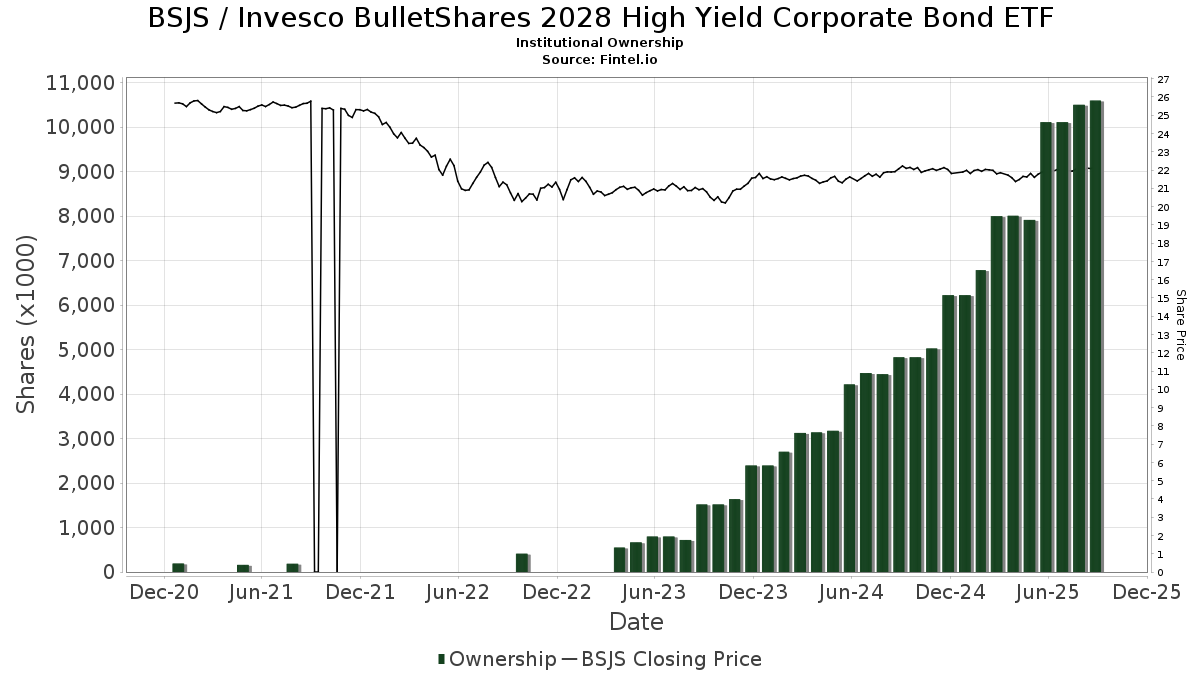
| Institutional Shares (Long) | 10,575,822 (ex 13D/G) - change of 0.47MM shares 4.61% MRQ |
| Institutional Value (Long) | $ 221,372 USD ($1000) |
Institutional Ownership and Shareholders
Invesco BulletShares 2028 High Yield Corporate Bond ETF (US:BSJS) has 116 institutional owners and shareholders that have filed 13D/G or 13F forms with the Securities Exchange Commission (SEC). These institutions hold a total of 10,575,822 shares. Largest shareholders include LPL Financial LLC, Wells Fargo & Company/mn, Morgan Stanley, Envestnet Asset Management Inc, Cetera Investment Advisers, UBS Group AG, SFE Investment Counsel, Equitable Holdings, Inc., Mercer Global Advisors Inc /adv, and Steward Partners Investment Advisory, Llc .
Invesco BulletShares 2028 High Yield Corporate Bond ETF (NasdaqGM:BSJS) institutional ownership structure shows current positions in the company by institutions and funds, as well as latest changes in position size. Major shareholders can include individual investors, mutual funds, hedge funds, or institutions. The Schedule 13D indicates that the investor holds (or held) more than 5% of the company and intends (or intended) to actively pursue a change in business strategy. Schedule 13G indicates a passive investment of over 5%.
The share price as of September 5, 2025 is 22.17 / share. Previously, on September 6, 2024, the share price was 21.98 / share. This represents an increase of 0.86% over that period.
Fund Sentiment Score
The Fund Sentiment Score (fka Ownership Accumulation Score) finds the stocks that are being most bought by funds. It is the result of a sophisticated, multi-factor quantitative model that identifies companies with the highest levels of institutional accumulation. The scoring model uses a combination of the total increase in disclosed owners, the changes in portfolio allocations in those owners and other metrics. The number ranges from 0 to 100, with higher numbers indicating a higher level of accumulation to its peers, and 50 being the average.
Update Frequency: Daily
See Ownership Explorer, which provides a list of highest-ranking companies.
Institutional Put/Call Ratio
In addition to reporting standard equity and debt issues, institutions with more than 100MM assets under management must also disclose their put and call option holdings. Since put options generally indicate negative sentiment, and call options indicate positive sentiment, we can get a sense of the overall institutional sentiment by plotting the ratio of puts to calls. The chart to the right plots the historical put/call ratio for this instrument.
Using Put/Call Ratio as an indicator of investor sentiment overcomes one of the key deficiencies of using total institutional ownership, which is that a significant amount of assets under management are invested passively to track indices. Passively-managed funds do not typically buy options, so the put/call ratio indicator more closely tracks the sentiment of actively-managed funds.
13F and NPORT Filings
Detail on 13F filings are free. Detail on NP filings require a premium membership. Green rows indicate new positions. Red rows indicate closed positions. Click the link icon to see the full transaction history.
Upgrade
to unlock premium data and export to Excel ![]() .
.
| File Date | Source | Investor | Type | Avg Price (Est) |
Shares | Δ Shares (%) |
Reported Value ($1000) |
Δ Value (%) |
Port Alloc (%) |
|
|---|---|---|---|---|---|---|---|---|---|---|
| 2025-08-01 | 13F | Envestnet Asset Management Inc | 485,597 | 4.84 | 10,707 | 6.82 | ||||
| 2025-04-17 | 13F | Rebalance, Llc | 0 | -100.00 | 0 | |||||
| 2025-08-05 | 13F | Pacific Wealth Strategies Group, Inc. | 31,328 | 172.42 | 687 | 177.02 | ||||
| 2025-04-21 | 13F | Nelson, Van Denburg & Campbell Wealth Management Group, LLC | 0 | -100.00 | 0 | |||||
| 2025-08-12 | 13F | Proequities, Inc. | 0 | 0 | ||||||
| 2025-07-29 | 13F | Tradewinds Capital Management, LLC | 1,215 | 1.76 | 27 | 4.00 | ||||
| 2025-07-28 | 13F | Harbour Investments, Inc. | 48,227 | 2.12 | 1,063 | 4.11 | ||||
| 2025-07-22 | 13F | Net Worth Advisory Group | 17,403 | 21.52 | 384 | 23.95 | ||||
| 2025-07-24 | 13F | IFP Advisors, Inc | 0 | -100.00 | 0 | |||||
| 2025-08-14 | 13F | Arete Wealth Advisors, LLC | 13,923 | 0.00 | 0 | |||||
| 2025-04-22 | 13F | Tassel Capital Management, Inc. | 0 | -100.00 | 0 | |||||
| 2025-08-13 | 13F | VestGen Advisors, LLC | 20,337 | 35.48 | 448 | 37.96 | ||||
| 2025-07-25 | 13F | We Are One Seven, LLC | 9,228 | 203 | ||||||
| 2025-08-14 | 13F | Royal Bank Of Canada | 197,775 | 3.89 | 4,361 | 5.88 | ||||
| 2025-08-18 | 13F | Geneos Wealth Management Inc. | 9,751 | 3.32 | 215 | 5.39 | ||||
| 2025-08-19 | 13F | Anchor Investment Management, LLC | 1,425 | 235.29 | 31 | 244.44 | ||||
| 2025-08-12 | 13F | BlackRock, Inc. | 0 | -100.00 | 0 | |||||
| 2025-08-14 | 13F | Integrated Wealth Concepts LLC | 32,804 | 6.52 | 723 | 8.56 | ||||
| 2025-08-08 | 13F | Cetera Investment Advisers | 423,448 | -10.59 | 9,337 | -8.89 | ||||
| 2025-08-12 | 13F | Fca Corp /tx | 49,014 | 1.90 | 1,081 | 3.85 | ||||
| 2025-08-11 | 13F | Aptus Capital Advisors, LLC | 450 | 0.00 | 10 | 0.00 | ||||
| 2025-08-07 | 13F | Private Advisory Group LLC | 22,960 | -2.71 | 506 | -0.78 | ||||
| 2025-07-29 | 13F | BXM Wealth LLC | 10,025 | 221 | ||||||
| 2025-07-11 | 13F | Farther Finance Advisors, LLC | 8,423 | 186 | ||||||
| 2025-09-04 | 13F/A | Advisor Group Holdings, Inc. | 173,216 | 45.01 | 3,820 | 47.79 | ||||
| 2025-07-31 | 13F | Glass Jacobson Investment Advisors llc | 21,559 | 89.30 | 475 | 93.09 | ||||
| 2025-07-09 | 13F | Sarver Vrooman Wealth Advisors | 1,328 | 0.00 | 29 | 3.57 | ||||
| 2025-08-08 | 13F | Foundations Investment Advisors, LLC | 27,282 | 143.52 | 602 | 148.35 | ||||
| 2025-07-22 | 13F | Siligmueller & Norvid Wealth Advisors LLC | 22,520 | -5.74 | 495 | -4.26 | ||||
| 2025-08-06 | 13F | Valtinson Bruner Financial Planning LLC | 19,471 | 0.65 | 429 | 2.63 | ||||
| 2025-08-14 | 13F | Wells Fargo & Company/mn | 747,270 | 0.25 | 16,477 | 2.15 | ||||
| 2025-08-14 | 13F | TCG Advisory Services, LLC | 299,313 | 9.51 | 6,600 | 11.58 | ||||
| 2025-08-14 | 13F | Jane Street Group, Llc | 27,714 | -42.91 | 611 | -41.81 | ||||
| 2025-08-15 | 13F | WFA of San Diego, LLC | 2,294 | 51 | ||||||
| 2025-07-30 | 13F | Brookstone Capital Management | 27,104 | -5.29 | 598 | -3.55 | ||||
| 2025-07-31 | 13F | Oppenheimer & Co Inc | 12,006 | -2.78 | 265 | -1.12 | ||||
| 2025-05-12 | 13F | Fmr Llc | 0 | -100.00 | 0 | |||||
| 2025-08-01 | 13F | Advisory Alpha, LLC | 265,313 | 18.99 | 5,850 | 21.24 | ||||
| 2025-08-12 | 13F | Horizon Financial Services, Llc | 1,582 | -8.87 | 35 | -8.11 | ||||
| 2025-07-10 | 13F | Wealth Enhancement Advisory Services, Llc | 38,571 | -19.98 | 850 | -18.50 | ||||
| 2025-08-12 | 13F | Jpmorgan Chase & Co | 169 | -99.29 | 4 | -99.42 | ||||
| 2025-08-14 | 13F | Susquehanna International Group, Llp | 25,348 | 559 | ||||||
| 2025-08-12 | 13F | J.w. Cole Advisors, Inc. | 11,412 | 0.98 | 252 | 2.87 | ||||
| 2025-07-11 | 13F | AA Financial Advisors, LLC | 15,797 | 348 | ||||||
| 2025-08-07 | 13F | Hennion & Walsh Asset Management, Inc. | 72,463 | 3.98 | 1,598 | 5.90 | ||||
| 2025-08-12 | 13F | Steward Partners Investment Advisory, Llc | 307,039 | -5.26 | 6,770 | -3.46 | ||||
| 2025-07-31 | 13F | Topsail Wealth Management, LLC | 16,060 | 21.76 | 354 | 24.21 | ||||
| 2025-08-08 | 13F | IMA Wealth, Inc. | 32,491 | 0.75 | 716 | 2.73 | ||||
| 2025-07-22 | 13F | 4Thought Financial Group Inc. | 20,899 | -3.25 | 461 | -1.50 | ||||
| 2025-08-13 | 13F | Vermillion & White Wealth Management Group, LLC | 21,269 | -27.28 | 469 | -25.95 | ||||
| 2025-07-29 | 13F | Kraft, Davis & Associates, LLC | 24,925 | 7.57 | 547 | 10.30 | ||||
| 2025-07-24 | 13F | Leo Wealth, LLC | 217,208 | 4,789 | ||||||
| 2025-08-13 | 13F | Capital Analysts, Inc. | 14,703 | 1.15 | 0 | |||||
| 2025-08-15 | 13F | Morgan Stanley | 506,340 | -15.96 | 11,165 | -14.37 | ||||
| 2025-05-12 | 13F | Independent Advisor Alliance | 0 | -100.00 | 0 | |||||
| 2025-08-01 | 13F | MorganRosel Wealth Management, LLC | 5,911 | 0.00 | 130 | 2.36 | ||||
| 2025-08-06 | 13F | Prospera Financial Services Inc | 130,790 | 2.41 | 2,884 | 4.34 | ||||
| 2025-08-06 | 13F | Commonwealth Equity Services, Llc | 95,458 | 24.76 | 2 | 100.00 | ||||
| 2025-07-21 | 13F | Empirical Financial Services, LLC d.b.a. Empirical Wealth Management | 33,891 | 2.64 | 747 | 4.62 | ||||
| 2025-08-14 | 13F | Comerica Bank | 15,260 | -2.40 | 336 | -0.59 | ||||
| 2025-08-07 | 13F | SFE Investment Counsel | 355,613 | 2.05 | 7,841 | 3.99 | ||||
| 2025-07-11 | 13F | Meriwether Wealth & Planning, LLC | 23,005 | 3.93 | 507 | 5.85 | ||||
| 2025-08-05 | 13F | Key FInancial Inc | 18,835 | 41.88 | 415 | 44.60 | ||||
| 2025-07-14 | 13F | Sound Stewardship, LLC | 53,005 | 11.47 | 1,169 | 13.51 | ||||
| 2025-07-31 | 13F | Cambridge Investment Research Advisors, Inc. | 83,117 | 4.18 | 2 | 0.00 | ||||
| 2025-08-18 | 13F | Tyler-Stone Wealth Management | 38,707 | 3.65 | 853 | 5.57 | ||||
| 2025-04-17 | 13F | Missouri Trust & Investment Co | 0 | -100.00 | 0 | |||||
| 2025-04-25 | 13F | Albion Financial Group /ut | 0 | -100.00 | 0 | |||||
| 2025-07-08 | 13F | S.E.E.D. Planning Group LLC | 74,566 | 3.15 | 1,644 | 5.12 | ||||
| 2025-07-24 | 13F | Vantage Point Financial LLC | 46,375 | -1.98 | 1,023 | -0.10 | ||||
| 2025-08-15 | 13F | Captrust Financial Advisors | 259,885 | 6.03 | 5,730 | 8.03 | ||||
| 2025-07-14 | 13F | GAMMA Investing LLC | 4,311 | -92.30 | 95 | -92.15 | ||||
| 2025-08-05 | 13F | Summit Investment Advisory Services, LLC | 112,928 | 2,490 | ||||||
| 2025-08-14 | 13F | UBS Group AG | 391,338 | -15.19 | 8,629 | -13.57 | ||||
| 2025-08-01 | 13F | GPM Growth Investors, Inc. | 210,775 | 11.94 | 4,648 | 14.06 | ||||
| 2025-07-25 | 13F | Cwm, Llc | 0 | -100.00 | 0 | |||||
| 2025-08-01 | 13F | Koss-Olinger Consulting, LLC | 15,643 | -7.43 | 345 | -6.01 | ||||
| 2025-08-04 | 13F | IFG Advisory, LLC | 16,307 | 20.79 | 360 | 22.95 | ||||
| 2025-07-29 | 13F | Alaska Permanent Capital Management | 6,933 | 152 | ||||||
| 2025-08-11 | 13F | Principal Securities, Inc. | 2,926 | 58.76 | 65 | 64.10 | ||||
| 2025-08-14 | 13F | Old Mission Capital Llc | 0 | -100.00 | 0 | |||||
| 2025-08-14 | 13F | Mercer Global Advisors Inc /adv | 341,181 | -2.78 | 7,523 | -0.93 | ||||
| 2025-08-14 | 13F | GWM Advisors LLC | 61,387 | 0.15 | 1,354 | 2.04 | ||||
| 2025-07-23 | 13F | Ironwood Financial, llc | 88,704 | 0.00 | 1,920 | 0.00 | ||||
| 2025-08-04 | 13F | AlphaStar Capital Management, LLC | 16,836 | 1.21 | 371 | 3.34 | ||||
| 2025-07-08 | 13F | Ballew Advisors, Inc | 25,316 | 0.00 | 558 | 4.10 | ||||
| 2025-08-13 | 13F | Brown Advisory Inc | 29,062 | 0.00 | 641 | 1.91 | ||||
| 2025-07-14 | 13F | AdvisorNet Financial, Inc | 28 | 0.00 | 1 | |||||
| 2025-07-29 | 13F | APCM Wealth Management for Individuals | 9,114 | 201 | ||||||
| 2025-08-12 | 13F | SRS Capital Advisors, Inc. | 471 | 10 | ||||||
| 2025-08-13 | 13F | Jones Financial Companies Lllp | 138,195 | 23.01 | 3,035 | 24.70 | ||||
| 2025-08-14 | 13F | Atomi Financial Group, Inc. | 43,273 | 13.51 | 954 | 15.78 | ||||
| 2025-08-07 | 13F | Allworth Financial LP | 300 | 7 | ||||||
| 2025-07-21 | 13F | Ashton Thomas Securities, Llc | 57,764 | 0.38 | 1,274 | 2.25 | ||||
| 2025-08-12 | 13F | Kaye Capital Management | 0 | -100.00 | 0 | |||||
| 2025-08-14 | 13F | Ameriprise Financial Inc | 209,104 | 5.52 | 4,611 | 7.66 | ||||
| 2025-07-18 | 13F | Consolidated Portfolio Review Corp | 42,491 | 8.19 | 937 | 10.25 | ||||
| 2025-08-05 | 13F | Bank Of Montreal /can/ | 0 | -100.00 | 0 | |||||
| 2025-08-14 | 13F | Stifel Financial Corp | 83,155 | 15.18 | 1,834 | 17.35 | ||||
| 2025-07-11 | 13F | Quad-Cities Investment Group, LLC | 9,161 | 202 | ||||||
| 2025-08-14 | 13F | Bank Of America Corp /de/ | 91,342 | 34.77 | 2,014 | 37.38 | ||||
| 2025-07-29 | 13F | Stephens Inc /ar/ | 16,006 | -18.49 | 353 | -16.98 | ||||
| 2025-08-06 | 13F | Summit Investment Advisors, Inc. | 121,173 | 10.19 | 2,662 | 11.99 | ||||
| 2025-08-11 | 13F | Oder Investment Management, LLC | 29,059 | 5.54 | 641 | 7.56 | ||||
| 2025-08-19 | 13F | Asset Dedication, LLC | 4,350 | 96 | ||||||
| 2025-08-11 | 13F | Cornerstone Planning Group LLC | 93 | 2 | ||||||
| 2025-08-14 | 13F | Mml Investors Services, Llc | 124,541 | 18.26 | 3 | 0.00 | ||||
| 2025-08-11 | 13F | Private Advisor Group, LLC | 21,742 | 6.55 | 479 | 8.62 | ||||
| 2025-07-31 | 13F | Strait & Sound Wealth Management LLC | 65,231 | 33.61 | 1,438 | 36.17 | ||||
| 2025-07-31 | 13F | Turning Point Benefit Group, Inc. | 33,075 | 64.45 | 729 | 72.75 | ||||
| 2025-08-08 | 13F | Larson Financial Group LLC | 7,866 | 1.69 | 173 | 3.59 | ||||
| 2025-08-11 | 13F | Shufro Rose & Co Llc | 10,000 | 0.00 | 216 | 0.00 | ||||
| 2025-07-31 | 13F | Carnegie Capital Asset Management, LLC | 14,350 | 316 | ||||||
| 2025-08-06 | 13F | Altrius Capital Management Inc | 30,679 | 50.57 | 676 | 53.64 | ||||
| 2025-07-07 | 13F | Horizons Wealth Management | 3,069 | 0.00 | 68 | 1.52 | ||||
| 2025-07-21 | 13F | Segment Wealth Management, LLC | 52,060 | -1.42 | 1,148 | 0.44 | ||||
| 2025-08-14 | 13F | Raymond James Financial Inc | 156,154 | -47.81 | 3,443 | -46.82 | ||||
| 2025-07-17 | 13F | Wolff Wiese Magana Llc | 1,025 | 48.12 | 23 | 57.14 | ||||
| 2025-05-07 | 13F | Vista Private Wealth Partners. LLC | 0 | -100.00 | 0 | |||||
| 2025-08-11 | 13F | Howard Wealth Management, Llc | 97,735 | -0.53 | 2,155 | 1.36 | ||||
| 2025-08-13 | 13F | Invesco Ltd. | 124,113 | 29.12 | 2,737 | 31.54 | ||||
| 2025-07-15 | 13F | Legacy Financial Group LLC | 27,076 | 6.28 | 597 | 8.35 | ||||
| 2025-08-12 | 13F | LPL Financial LLC | 1,382,592 | 21.46 | 30,486 | 23.76 | ||||
| 2025-04-10 | 13F | Retireful, LLC | 0 | -100.00 | 0 | |||||
| 2025-08-15 | 13F | Equitable Holdings, Inc. | 343,562 | -4.26 | 7,576 | -2.45 | ||||
| 2025-07-29 | 13F | Latitude Advisors, LLC | 10,760 | 237 | ||||||
| 2025-07-18 | 13F | Ledgewood Wealth Advisors, LLC | 17,332 | 0.57 | 382 | 2.69 | ||||
| 2025-08-13 | 13F | MONECO Advisors, LLC | 25,499 | -26.02 | 562 | -24.56 | ||||
| 2025-05-15 | 13F | Ancora Advisors, LLC | 0 | -100.00 | 0 | -100.00 | ||||
| 2025-08-14 | 13F | Guardian Wealth Advisors, Llc / Nc | 450 | 0.00 | 10 | 0.00 | ||||
| 2025-07-25 | 13F | Astoria Portfolio Advisors LLC. | 57,742 | 1.26 | 1,268 | 3.59 | ||||
| 2025-08-06 | 13F | Financial Advisory Corp /ut/ /adv | 199,085 | -1.14 | 4 | 0.00 | ||||
| 2025-07-29 | 13F | Private Trust Co Na | 941 | 159.23 | 21 | 185.71 |