Basic Stats
| Institutional Owners | 39 total, 39 long only, 0 short only, 0 long/short - change of 15.00% MRQ |
| Average Portfolio Allocation | 0.0127 % - change of 355.60% MRQ |
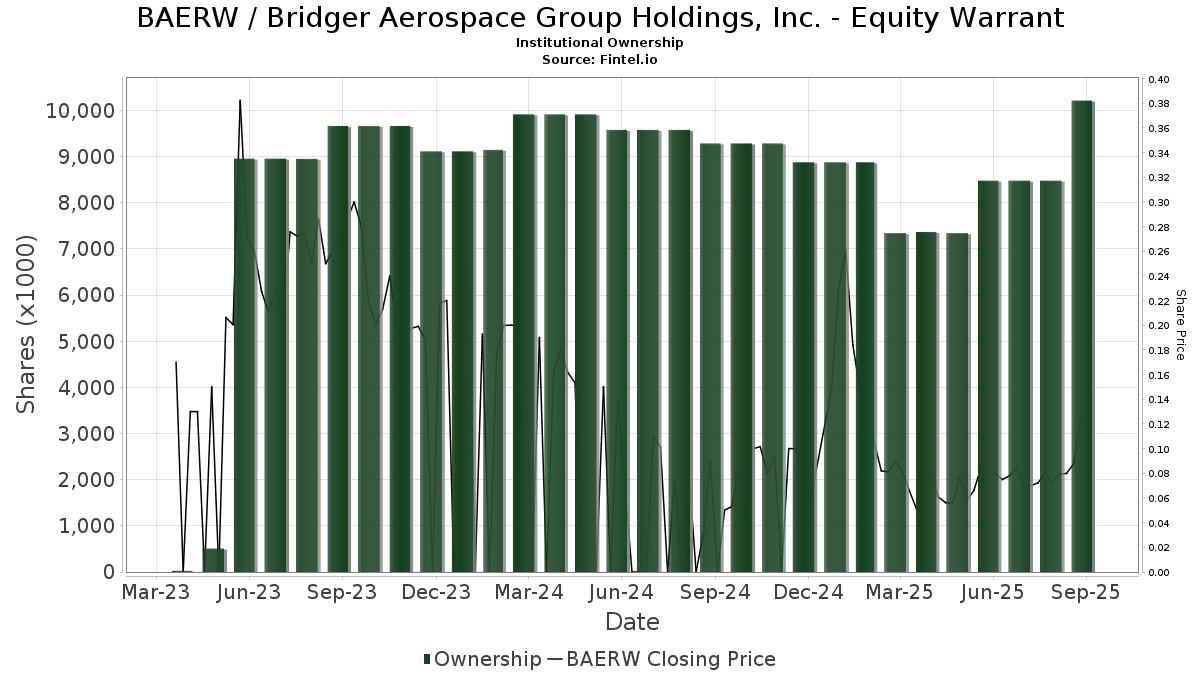
| Institutional Shares (Long) | 10,216,156 (ex 13D/G) - change of 1.74MM shares 20.47% MRQ |
| Institutional Value (Long) | $ 755 USD ($1000) |
Institutional Ownership and Shareholders
Bridger Aerospace Group Holdings, Inc. - Equity Warrant (US:BAERW) has 39 institutional owners and shareholders that have filed 13D/G or 13F forms with the Securities Exchange Commission (SEC). These institutions hold a total of 10,216,156 shares. Largest shareholders include LMR Partners LLP, Aristeia Capital Llc, Toronto Dominion Bank, Driehaus Capital Management Llc, Clear Street Derivatives LLC, Clear Street Llc, DMSFX - Destinations Multi Strategy Alternatives Fund Class I, Millennium Management Llc, TENOR CAPITAL MANAGEMENT Co., L.P., and Davidson Kempner Capital Management Lp .
Bridger Aerospace Group Holdings, Inc. - Equity Warrant (NasdaqGM:BAERW) institutional ownership structure shows current positions in the company by institutions and funds, as well as latest changes in position size. Major shareholders can include individual investors, mutual funds, hedge funds, or institutions. The Schedule 13D indicates that the investor holds (or held) more than 5% of the company and intends (or intended) to actively pursue a change in business strategy. Schedule 13G indicates a passive investment of over 5%.
The share price as of September 11, 2025 is 0.12 / share. Previously, on September 12, 2024, the share price was 0.08 / share. This represents an increase of 46.75% over that period.
Fund Sentiment Score
The Fund Sentiment Score (fka Ownership Accumulation Score) finds the stocks that are being most bought by funds. It is the result of a sophisticated, multi-factor quantitative model that identifies companies with the highest levels of institutional accumulation. The scoring model uses a combination of the total increase in disclosed owners, the changes in portfolio allocations in those owners and other metrics. The number ranges from 0 to 100, with higher numbers indicating a higher level of accumulation to its peers, and 50 being the average.
Update Frequency: Daily
See Ownership Explorer, which provides a list of highest-ranking companies.
Institutional Put/Call Ratio
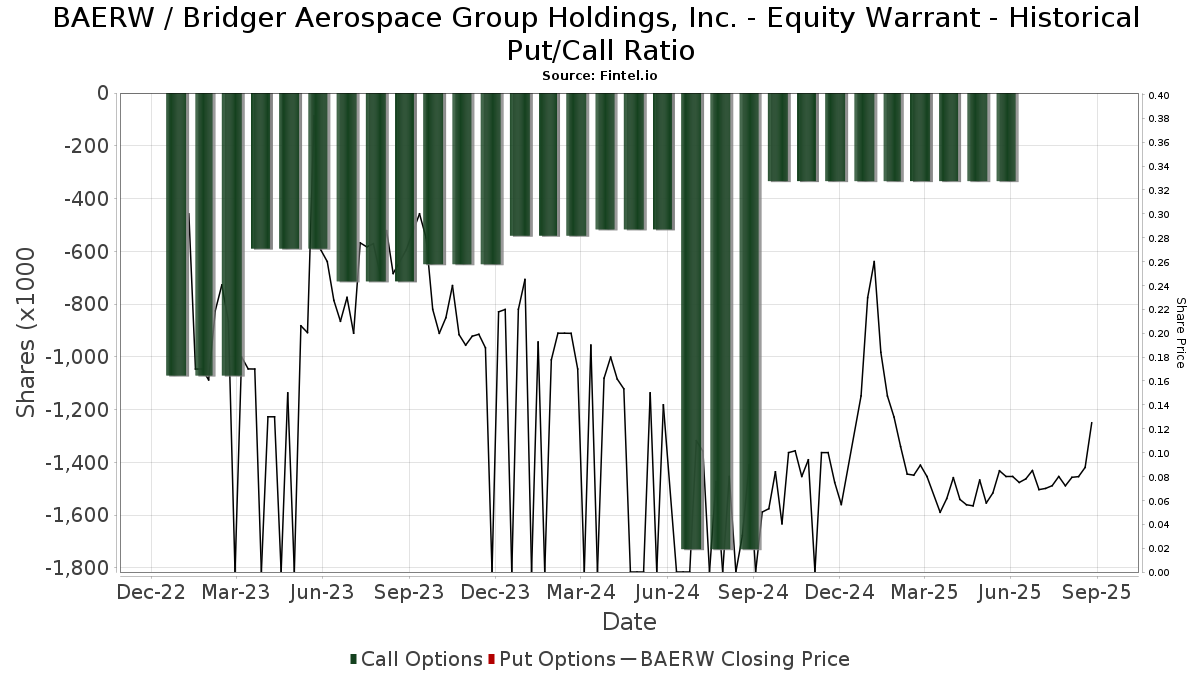
In addition to reporting standard equity and debt issues, institutions with more than 100MM assets under management must also disclose their put and call option holdings. Since put options generally indicate negative sentiment, and call options indicate positive sentiment, we can get a sense of the overall institutional sentiment by plotting the ratio of puts to calls. The chart to the right plots the historical put/call ratio for this instrument.
Using Put/Call Ratio as an indicator of investor sentiment overcomes one of the key deficiencies of using total institutional ownership, which is that a significant amount of assets under management are invested passively to track indices. Passively-managed funds do not typically buy options, so the put/call ratio indicator more closely tracks the sentiment of actively-managed funds.
13F and NPORT Filings
Detail on 13F filings are free. Detail on NP filings require a premium membership. Green rows indicate new positions. Red rows indicate closed positions. Click the link icon to see the full transaction history.
Upgrade
to unlock premium data and export to Excel ![]() .
.
| File Date | Source | Investor | Type | Avg Price (Est) |
Shares | Δ Shares (%) |
Reported Value ($1000) |
Δ Value (%) |
Port Alloc (%) |
|
|---|---|---|---|---|---|---|---|---|---|---|
| 2025-08-14 | 13F | Susquehanna International Group, Llp | 16,629 | 1 | ||||||
| 2025-08-14 | 13F | Sculptor Capital LP | 96,000 | 0.00 | 7 | 40.00 | ||||
| 2025-08-14 | 13F | TENOR CAPITAL MANAGEMENT Co., L.P. | 274,854 | 0.00 | 21 | 50.00 | ||||
| 2025-08-14 | 13F | Davidson Kempner Capital Management Lp | 195,399 | 0.00 | 15 | 50.00 | ||||
| 2025-08-14 | 13F | Adage Capital Partners Gp, L.l.c. | 183,333 | 0.00 | 14 | 55.56 | ||||
| 2025-05-15 | 13F | Shaolin Capital Management LLC | 0 | -100.00 | 0 | |||||
| 2025-08-14 | 13F | Toronto Dominion Bank | 1,483,444 | 115 | ||||||
| 2025-08-27 | NP | JNL SERIES TRUST - JNL/Westchester Capital Event Driven Fund (A) | 11,750 | 0.00 | 1 | |||||
| 2025-08-14 | 13F | Peak6 Llc | 40,000 | 0.00 | 3 | 50.00 | ||||
| 2025-08-26 | NP | WCFIX - WCM Alternatives: Credit Event Fund Institutional Class | 0 | |||||||
| 2025-08-13 | 13F | Clear Street Derivatives LLC | 586,117 | 0.00 | 45 | 45.16 | ||||
| 2025-08-14 | 13F | Canyon Capital Advisors Llc | 14 | 44.44 | ||||||
| 2025-08-04 | 13F | Wolverine Asset Management Llc | 37,270 | -13.21 | 3 | 0.00 | ||||
| 2025-08-12 | 13F | Proequities, Inc. | 0 | 0 | ||||||
| 2025-08-13 | 13F | Diametric Capital, LP | 17,690 | 0.00 | 1 | |||||
| 2025-08-13 | 13F | Healthcare Of Ontario Pension Plan Trust Fund | 101,400 | 0.00 | 8 | 40.00 | ||||
| 2025-08-11 | 13F | Greenland Capital Management LP | 86,791 | 0.00 | 7 | 50.00 | ||||
| 2025-08-11 | 13F | Elequin Capital Lp | 47,317 | 0.00 | 4 | 50.00 | ||||
| 2025-08-14 | 13F | Aristeia Capital Llc | 1,620,086 | 0.00 | 122 | 27.37 | ||||
| 2025-08-26 | NP | MERFX - The Merger Fund - Investor Class Shares | 5 | 33.33 | ||||||
| 2025-08-14 | 13F | Moore Capital Management, Lp | 100,000 | 0.00 | 8 | 40.00 | ||||
| 2025-08-14 | 13F | Driehaus Capital Management Llc | 620,220 | 0.00 | 48 | 45.45 | ||||
| 2025-08-12 | 13F | Jpmorgan Chase & Co | 8 | 40.00 | ||||||
| 2025-08-14 | 13F | Parallax Volatility Advisers, L.P. | 100,000 | 8 | ||||||
| 2025-08-14 | 13F | Sandia Investment Management LP | 17,690 | 0.00 | 1 | |||||
| 2025-05-09 | 13F | Warberg Asset Management LLC | 0 | -100.00 | 0 | |||||
| 2025-08-08 | 13F | Creative Planning | 50,000 | 376.19 | 4 | |||||
| 2025-08-13 | 13F | Clear Street Llc | 472,012 | -0.06 | 37 | 44.00 | ||||
| 2025-08-15 | 13F | SkyView Investment Advisors, LLC | 12,500 | 0 | ||||||
| 2025-08-14 | 13F | Millennium Management Llc | Call | 334,890 | 0.00 | 26 | 47.06 | |||
| 2025-08-12 | 13F | Highbridge Capital Management Llc | 50 | -35.06 | ||||||
| 2025-08-14 | 13F | Foursixthree Capital Lp | 10,000 | 1 | ||||||
| 2025-08-14 | 13F | LMR Partners LLP | 2,977,952 | 2.39 | 231 | 48.39 | ||||
| 2025-08-14 | 13F | Whitebox Advisors Llc | 41,500 | 0.00 | 3 | 50.00 | ||||
| 2025-08-14 | 13F | Two Sigma Securities, Llc | 23,308 | -38.53 | 2 | -50.00 | ||||
| 2025-08-14 | 13F | Athos Capital Ltd | 66,062 | 0.00 | 0 | |||||
| 2025-06-27 | NP | CVSIX - Calamos Market Neutral Income Fund Class A | 25,000 | 0.00 | 1 | -66.67 | ||||
| 2025-08-14 | 13F | Westchester Capital Management, LLC | 100,000 | 0.00 | 8 | 40.00 | ||||
| 2025-08-14 | 13F | Goldman Sachs Group Inc | 11,008 | 0.00 | 1 | |||||
| 2025-05-05 | 13F | Context Capital Management, LLC | 0 | -100.00 | 0 | |||||
| 2025-08-13 | 13F | StoneX Group Inc. | 24,770 | 2 | ||||||
| 2025-08-14 | 13F | Saba Capital Management, L.P. | 18,752 | 0.00 | 1 | 0.00 | ||||
| 2025-08-14 | 13F | Cantor Fitzgerald, L. P. | 38,849 | 0.00 | 3 | 50.00 | ||||
| 2025-08-26 | NP | MERVX - The Merger Fund VL | 0 | |||||||
| 2025-07-22 | NP | DMSFX - Destinations Multi Strategy Alternatives Fund Class I | 468,723 | 0.00 | 30 | -18.92 | ||||
| 2025-08-08 | 13F | Calamos Advisors LLC | 25,000 | 0.00 | 2 | 0.00 | ||||
| 2025-08-14 | 13F | Jane Street Group, Llc | 158,252 | 0.00 | 12 | 50.00 | ||||
| 2025-08-20 | 13F/A | Thompson Davis & Co., Inc. | 20,000 | 0.00 | 2 | 0.00 | ||||
| 2025-05-15 | 13F | Tower Research Capital LLC (TRC) | 0 | -100.00 | 0 | |||||
| 2025-08-26 | NP | WCERX - WCM Alternatives: Event-Driven Fund - Investor Class Shares | 2 | 100.00 | ||||||
| 2025-08-14 | 13F | Css Llc/il | 36,478 | 0.00 | 3 | 100.00 |