Basic Stats
| Institutional Owners | 211 total, 211 long only, 0 short only, 0 long/short - change of 3.92% MRQ |
| Average Portfolio Allocation | 0.3484 % - change of -2.33% MRQ |
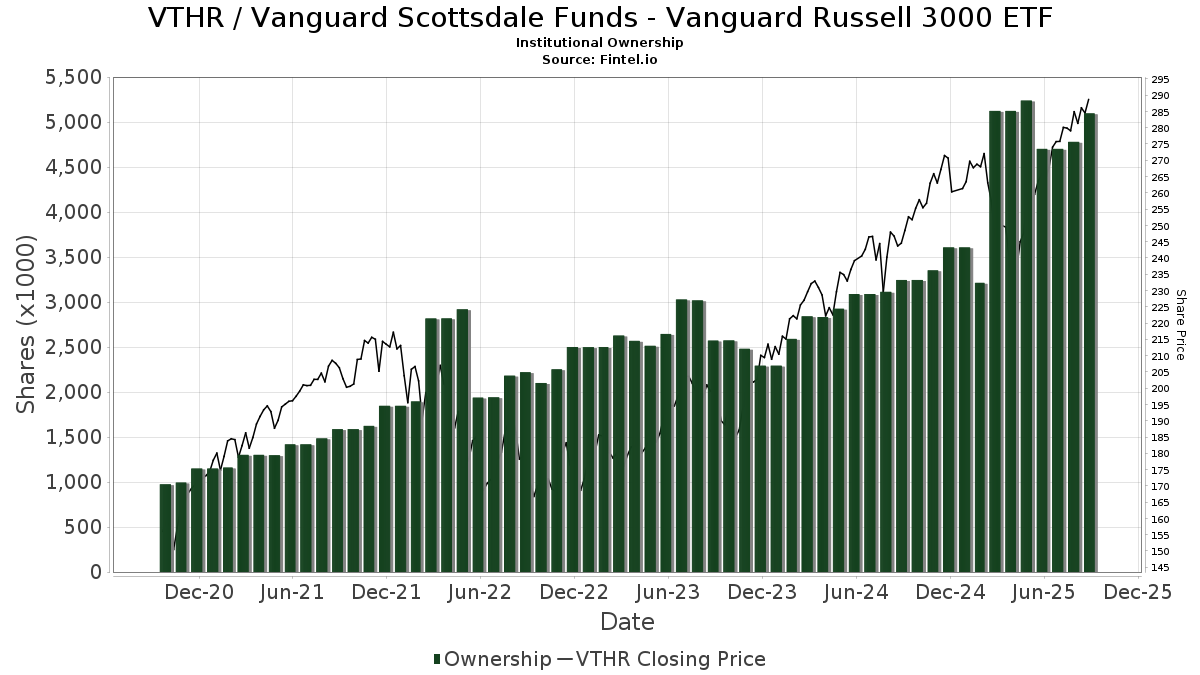
| Institutional Shares (Long) | 5,098,998 (ex 13D/G) - change of 0.43MM shares 9.14% MRQ |
| Institutional Value (Long) | $ 1,273,948 USD ($1000) |
Institutional Ownership and Shareholders
Vanguard Scottsdale Funds - Vanguard Russell 3000 ETF (US:VTHR) has 211 institutional owners and shareholders that have filed 13D/G or 13F forms with the Securities Exchange Commission (SEC). These institutions hold a total of 5,098,998 shares. Largest shareholders include Ameriprise Financial Inc, Lincoln National Corp, LINCOLN VARIABLE INSURANCE PRODUCTS TRUST - LVIP Vanguard Domestic Equity ETF Fund Standard Class, Cliffwater LLC, Morgan Stanley, Colony Group, LLC, Natixis Advisors, L.p., Tompkins Financial Corp, Cerity Partners LLC, and Fund Evaluation Group, LLC .
Vanguard Scottsdale Funds - Vanguard Russell 3000 ETF (NasdaqGM:VTHR) institutional ownership structure shows current positions in the company by institutions and funds, as well as latest changes in position size. Major shareholders can include individual investors, mutual funds, hedge funds, or institutions. The Schedule 13D indicates that the investor holds (or held) more than 5% of the company and intends (or intended) to actively pursue a change in business strategy. Schedule 13G indicates a passive investment of over 5%.
The share price as of September 8, 2025 is 287.42 / share. Previously, on September 9, 2024, the share price was 241.29 / share. This represents an increase of 19.12% over that period.
Fund Sentiment Score
The Fund Sentiment Score (fka Ownership Accumulation Score) finds the stocks that are being most bought by funds. It is the result of a sophisticated, multi-factor quantitative model that identifies companies with the highest levels of institutional accumulation. The scoring model uses a combination of the total increase in disclosed owners, the changes in portfolio allocations in those owners and other metrics. The number ranges from 0 to 100, with higher numbers indicating a higher level of accumulation to its peers, and 50 being the average.
Update Frequency: Daily
See Ownership Explorer, which provides a list of highest-ranking companies.
Institutional Put/Call Ratio
In addition to reporting standard equity and debt issues, institutions with more than 100MM assets under management must also disclose their put and call option holdings. Since put options generally indicate negative sentiment, and call options indicate positive sentiment, we can get a sense of the overall institutional sentiment by plotting the ratio of puts to calls. The chart to the right plots the historical put/call ratio for this instrument.
Using Put/Call Ratio as an indicator of investor sentiment overcomes one of the key deficiencies of using total institutional ownership, which is that a significant amount of assets under management are invested passively to track indices. Passively-managed funds do not typically buy options, so the put/call ratio indicator more closely tracks the sentiment of actively-managed funds.

13F and NPORT Filings
Detail on 13F filings are free. Detail on NP filings require a premium membership. Green rows indicate new positions. Red rows indicate closed positions. Click the link icon to see the full transaction history.
Upgrade
to unlock premium data and export to Excel ![]() .
.
| File Date | Source | Investor | Type | Avg Price (Est) |
Shares | Δ Shares (%) |
Reported Value ($1000) |
Δ Value (%) |
Port Alloc (%) |
|
|---|---|---|---|---|---|---|---|---|---|---|
| 2025-07-31 | 13F | City State Bank | 50 | 0.00 | 14 | 8.33 | ||||
| 2025-08-08 | 13F | Firestone Capital Management | 1,000 | 0.00 | 273 | 10.57 | ||||
| 2025-08-13 | 13F | Quadrant Capital Group Llc | 0 | -100.00 | 0 | |||||
| 2025-08-01 | 13F | Chilton Capital Management Llc | 203 | 0.00 | 55 | 10.00 | ||||
| 2025-07-25 | 13F | NorthRock Partners, LLC | 41 | -73.55 | 11 | -71.05 | ||||
| 2025-08-11 | 13F | Wealthspire Advisors, LLC | 3,417 | 0.00 | 932 | 10.56 | ||||
| 2025-08-14 | 13F | Mariner, LLC | 74,648 | 214.84 | 20,360 | 248.03 | ||||
| 2025-08-15 | 13F | Kestra Advisory Services, LLC | 10,327 | 30.89 | 2,817 | 44.71 | ||||
| 2025-07-21 | 13F | Verus Financial Partners, Inc. | 8,358 | 1.31 | 2,305 | 18.09 | ||||
| 2025-08-08 | 13F | Pnc Financial Services Group, Inc. | 10,046 | -16.66 | 2,740 | -7.87 | ||||
| 2025-08-14 | 13F | Raymond James Financial Inc | 78,929 | -0.10 | 21,528 | 10.42 | ||||
| 2025-07-16 | 13F | Dakota Wealth Management | 903 | 0.00 | 246 | 10.81 | ||||
| 2025-08-14 | 13F | Glenmede Investment Management, LP | 21,100 | 5,755 | ||||||
| 2025-08-14 | 13F | Old Mission Capital Llc | 1,966 | 0.31 | 536 | 10.97 | ||||
| 2025-08-07 | 13F | Kestra Private Wealth Services, Llc | 883 | 241 | ||||||
| 2025-08-13 | 13F | Natixis Advisors, L.p. | 222,295 | 0.36 | 61 | 11.11 | ||||
| 2025-07-15 | 13F | Main Street Group, LTD | 0 | -100.00 | 0 | |||||
| 2025-08-11 | 13F | Lowe Brockenbrough & Co Inc | 36,664 | 10,000 | ||||||
| 2025-08-07 | 13F | Evoke Wealth, Llc | 10,182 | 2,777 | ||||||
| 2025-08-12 | 13F | SRS Capital Advisors, Inc. | 50 | 14 | ||||||
| 2025-08-28 | 13F/A | Tolleson Wealth Management, Inc. | 16,701 | 0.00 | 4,555 | 10.53 | ||||
| 2025-09-04 | 13F/A | Advisor Group Holdings, Inc. | 2,580 | -11.76 | 703 | -2.63 | ||||
| 2025-07-09 | 13F | Bowman & Co S.C. | 1,045 | 14.33 | 285 | 26.67 | ||||
| 2025-08-13 | 13F | Virtue Capital Management, LLC | 0 | -100.00 | 0 | |||||
| 2025-07-28 | 13F | Corundum Trust Company, INC | 1,892 | 0.00 | 516 | 10.73 | ||||
| 2025-08-07 | 13F | Tacita Capital Inc | 625 | 0.00 | 170 | 10.39 | ||||
| 2025-08-13 | 13F | Jones Financial Companies Lllp | 551 | 1,024.49 | 150 | 1,141.67 | ||||
| 2025-08-14 | 13F | GWM Advisors LLC | 3,377 | -14.01 | 921 | -4.95 | ||||
| 2025-07-24 | 13F | Lokken Investment Group LLC | 1,905 | 520 | ||||||
| 2025-07-22 | 13F | Evensky & Katz LLC | 44,464 | 429.40 | 12 | 500.00 | ||||
| 2025-07-07 | 13F | Global Wealth Strategies & Associates | 0 | -100.00 | 0 | |||||
| 2025-07-31 | 13F | Mycio Wealth Partners, Llc | 314 | 86 | ||||||
| 2025-08-14 | 13F | Wells Fargo & Company/mn | 17,779 | 46.32 | 4,849 | 61.74 | ||||
| 2025-08-04 | 13F | Linscomb & Williams, Inc. | 26,427 | -1.73 | 7,208 | 8.62 | ||||
| 2025-07-18 | 13F | Centricity Wealth Management, LLC | 287 | 0.00 | 78 | 11.43 | ||||
| 2025-08-15 | 13F | Koesten, Hirschmann & Crabtree, INC. | 452 | 0.22 | 123 | 10.81 | ||||
| 2025-08-12 | 13F | Steward Partners Investment Advisory, Llc | 14,447 | 0.38 | 3,940 | 10.95 | ||||
| 2025-07-29 | 13F | Stratos Wealth Advisors, LLC | 16,417 | 1.40 | 4,478 | 12.07 | ||||
| 2025-07-21 | 13F | Precedent Wealth Partners, Llc | 1,820 | 9.84 | 496 | 21.57 | ||||
| 2025-07-31 | 13F | Sage Mountain Advisors LLC | 420 | 0.00 | 115 | 10.68 | ||||
| 2025-07-09 | 13F | Radnor Capital Management, LLC | 1,100 | 0.00 | 0 | |||||
| 2025-08-07 | 13F | Allworth Financial LP | 586 | 0.34 | 160 | 12.77 | ||||
| 2025-08-07 | 13F | Fund Evaluation Group, LLC | 139,081 | 37,934 | ||||||
| 2025-07-30 | 13F | Arbor Investment Advisors, LLC | 1,787 | -11.80 | 487 | -2.40 | ||||
| 2025-08-05 | 13F | Lincoln National Corp | 466,325 | 1.42 | 127,190 | 12.10 | ||||
| 2025-08-14 | 13F | Gould Capital, LLC | 13 | 8.33 | 4 | 50.00 | ||||
| 2025-08-13 | 13F | Lido Advisors, LLC | 12,533 | 0.01 | 3,418 | 10.54 | ||||
| 2025-07-31 | 13F | Fiduciary Wealth Partners, LLC | 0 | -100.00 | 0 | -100.00 | ||||
| 2025-08-14 | 13F | Ieq Capital, Llc | 21,194 | -22.13 | 5,781 | -13.92 | ||||
| 2025-08-19 | 13F/A | Pitcairn Co | 23,421 | -18.27 | 6,388 | -9.66 | ||||
| 2025-07-25 | 13F | Johnson Investment Counsel Inc | 4,802 | 0.00 | 1,310 | 10.56 | ||||
| 2025-07-25 | 13F | Investment Advisory Group, LLC | 5,978 | -0.91 | 1,631 | 9.54 | ||||
| 2025-07-31 | 13F | Nilsine Partners, LLC | 1,498 | -5.96 | 409 | 3.82 | ||||
| 2025-08-11 | 13F | Diversified Portfolios, Inc. | 53,527 | 1.70 | 14,599 | 12.41 | ||||
| 2025-07-09 | 13F | Inspirion Wealth Advisors, Llc | 0 | -100.00 | 0 | |||||
| 2025-07-02 | 13F | Central Pacific Bank - Trust Division | 24 | 0.00 | 7 | 20.00 | ||||
| 2025-07-28 | 13F | Harbour Investments, Inc. | 0 | -100.00 | 0 | |||||
| 2025-08-05 | 13F | Bank Of Montreal /can/ | 136 | 0.00 | 37 | 12.12 | ||||
| 2025-08-14 | 13F | Atomi Financial Group, Inc. | 1,478 | 0.00 | 403 | 10.71 | ||||
| 2025-07-30 | 13F | Forum Financial Management, LP | 2,448 | 0.29 | 668 | 10.80 | ||||
| 2025-08-14 | 13F | Citadel Advisors Llc | 2,847 | -66.80 | 777 | -63.31 | ||||
| 2025-07-30 | 13F | Whittier Trust Co | 5,659 | 0.00 | 1,543 | 10.53 | ||||
| 2025-08-07 | 13F | Resources Investment Advisors, LLC. | 3,081 | -0.03 | 840 | 10.53 | ||||
| 2025-08-04 | 13F | Flagship Harbor Advisors, Llc | 5,648 | 7.07 | 1,541 | 18.37 | ||||
| 2025-08-12 | 13F | Howe & Rusling Inc | 281 | 0.00 | 77 | 10.14 | ||||
| 2025-08-18 | 13F | Geneos Wealth Management Inc. | 2,966 | 56.60 | 809 | 73.02 | ||||
| 2025-07-11 | 13F | Farther Finance Advisors, LLC | 2,406 | 74.22 | 656 | 91.81 | ||||
| 2025-07-10 | 13F | Wedmont Private Capital | 5,599 | -0.94 | 1,544 | 16.37 | ||||
| 2025-04-24 | 13F | Wingate Wealth Advisors, Inc. | 0 | -100.00 | 0 | |||||
| 2025-08-13 | 13F | Russell Investments Group, Ltd. | 1,691 | 461 | ||||||
| 2025-08-06 | NP | LINCOLN VARIABLE INSURANCE PRODUCTS TRUST - LVIP Vanguard Domestic Equity ETF Fund Standard Class | 466,325 | 1.42 | 127,190 | 12.10 | ||||
| 2025-07-31 | 13F | FSA Investment Group, LLC | 9,255 | 36.10 | 2,524 | 50.42 | ||||
| 2025-08-15 | 13F | Captrust Financial Advisors | 15,001 | 43.50 | 4,092 | 58.63 | ||||
| 2025-07-22 | 13F | Bay Harbor Wealth Management, LLC | 16 | 0.00 | 4 | 33.33 | ||||
| 2025-08-07 | 13F | BOK Financial Private Wealth, Inc. | 1,807 | 0.00 | 493 | 10.56 | ||||
| 2025-08-05 | 13F | Centennial Bank/AR/ | 4,946 | 210.29 | 1,349 | 243.26 | ||||
| 2025-07-09 | 13F | Christopher J. Hasenberg, Inc | 12,886 | -55.06 | 3,515 | -50.53 | ||||
| 2025-08-12 | 13F | O'shaughnessy Asset Management, Llc | 40 | 0.00 | 11 | 11.11 | ||||
| 2025-08-13 | 13F | Northwestern Mutual Wealth Management Co | 1,384 | 5.09 | 378 | 16.00 | ||||
| 2025-08-14 | 13F/A | Rockefeller Capital Management L.P. | 15,292 | 0.94 | 4,171 | 11.56 | ||||
| 2025-08-14 | 13F | EP Wealth Advisors, Inc. | 1,372 | -15.52 | 374 | -6.50 | ||||
| 2025-04-23 | 13F | Moran Wealth Management, LLC | 0 | -100.00 | 0 | |||||
| 2025-08-14 | 13F | Moneta Group Investment Advisors Llc | 1,616 | 0.00 | 441 | 10.55 | ||||
| 2025-08-19 | 13F | Asset Dedication, LLC | 208 | 0.00 | 57 | 9.80 | ||||
| 2025-07-15 | 13F | DB Fitzpatrick & Co, Inc | 14,210 | -2.70 | 3,876 | 7.55 | ||||
| 2025-08-12 | 13F/A | Cozad Asset Management Inc | 2,493 | 0.00 | 680 | 10.41 | ||||
| 2025-08-11 | 13F | Banque Cantonale Vaudoise | 1,794 | 0.00 | 0 | |||||
| 2025-08-13 | 13F | Cliffwater LLC | 235,936 | -9.98 | 64,352 | -0.50 | ||||
| 2025-08-13 | 13F | Cresset Asset Management, LLC | 4,027 | -8.58 | 1,099 | 1.10 | ||||
| 2025-07-17 | 13F | Coastline Trust Co | 12,240 | -2.67 | 3,338 | 7.57 | ||||
| 2025-08-06 | 13F | Wedbush Securities Inc | 9,546 | -1.99 | 3 | 0.00 | ||||
| 2025-08-14 | 13F | Tennessee Valley Asset Management Partners | 12,549 | 3.47 | 3,423 | 14.37 | ||||
| 2025-07-18 | 13F | BSW Wealth Partners | 771 | 210 | ||||||
| 2025-07-10 | 13F | Wealth Enhancement Advisory Services, Llc | 14,617 | 17.07 | 4,038 | 31.10 | ||||
| 2025-07-11 | 13F | Diversified Trust Co | 84,088 | 0.02 | 22,935 | 10.56 | ||||
| 2025-07-31 | 13F | Oppenheimer & Co Inc | 0 | -100.00 | 0 | |||||
| 2025-08-08 | 13F | Thoroughbred Financial Services, Llc | 0 | -100.00 | 0 | |||||
| 2025-08-14 | 13F | Goldman Sachs Group Inc | 64,547 | 19.84 | 17,605 | 32.47 | ||||
| 2025-07-08 | 13F | Nbc Securities, Inc. | 11,000 | -5.71 | 3 | 50.00 | ||||
| 2025-08-04 | 13F | Assetmark, Inc | 719 | -49.61 | 196 | -44.32 | ||||
| 2025-07-17 | 13F | Janney Montgomery Scott LLC | 901 | -30.59 | 0 | |||||
| 2025-07-30 | 13F | Strategic Blueprint, LLC | 0 | -100.00 | 0 | |||||
| 2025-07-07 | 13F | Wesbanco Bank Inc | 5,005 | 0.00 | 1,365 | 10.53 | ||||
| 2025-08-12 | 13F | Coldstream Capital Management Inc | 1,368 | 2.86 | 373 | 13.72 | ||||
| 2025-08-08 | 13F | Hartland & Co., LLC | 14,849 | 0.53 | 4,050 | 11.14 | ||||
| 2025-07-22 | 13F | Belpointe Asset Management LLC | 1,132 | 0.00 | 309 | 10.39 | ||||
| 2025-08-06 | 13F | Commonwealth Equity Services, Llc | 16,033 | -0.71 | 4 | 33.33 | ||||
| 2025-07-24 | 13F | IFP Advisors, Inc | 2,887 | -0.62 | 787 | 9.92 | ||||
| 2025-07-11 | 13F | Orrstown Financial Services Inc | 8,373 | -2.71 | 2,284 | 7.54 | ||||
| 2025-08-01 | 13F | Envestnet Asset Management Inc | 31,081 | -28.87 | 8,477 | -21.38 | ||||
| 2025-08-12 | 13F | Pathstone Holdings, LLC | 24,501 | 26.74 | 6,683 | 40.08 | ||||
| 2025-05-06 | 13F | Venturi Wealth Management, LLC | 0 | -100.00 | 0 | |||||
| 2025-08-04 | 13F | JDM Financial Group LLC | 59 | 0.00 | 16 | 14.29 | ||||
| 2025-05-08 | 13F | Armis Advisers, LLC | 0 | -100.00 | 0 | |||||
| 2025-07-31 | 13F | Brighton Jones Llc | 1,190 | 0.25 | 325 | 10.96 | ||||
| 2025-07-25 | 13F | Sequoia Financial Advisors, LLC | 3,309 | 33.54 | 903 | 47.63 | ||||
| 2025-08-05 | 13F | GPS Wealth Strategies Group, LLC | 24 | 0.00 | 7 | 0.00 | ||||
| 2025-07-31 | 13F | Topsail Wealth Management, LLC | 101 | 0.00 | 28 | 12.50 | ||||
| 2025-08-06 | 13F | Prospera Financial Services Inc | 1,500 | -57.14 | 409 | -52.61 | ||||
| 2025-08-14 | 13F | Royal Bank Of Canada | 12,129 | 7.00 | 3,308 | 18.23 | ||||
| 2025-08-14 | 13F | Mml Investors Services, Llc | 64,523 | -60.37 | 18 | -57.50 | ||||
| 2025-05-14 | 13F | Retirement Capital Strategies | 0 | -100.00 | 0 | |||||
| 2025-07-10 | 13F | NorthCrest Asset Manangement, LLC | 5,590 | 0.00 | 1,544 | 11.97 | ||||
| 2025-08-07 | 13F | CENTRAL TRUST Co | 32 | 0.00 | 9 | 14.29 | ||||
| 2025-08-08 | 13F | SBI Securities Co., Ltd. | 165 | 1.23 | 45 | 12.50 | ||||
| 2025-08-14 | 13F | Warren Averett Asset Management, LLC | 8,925 | 0.00 | 2,434 | 10.54 | ||||
| 2025-07-21 | 13F | Monticello Wealth Management, Llc | 9,411 | 0.00 | 2,567 | 10.51 | ||||
| 2025-04-17 | 13F | Qrg Capital Management, Inc. | 0 | -100.00 | 0 | |||||
| 2025-05-14 | 13F | Huntington National Bank | 116 | -4.96 | ||||||
| 2025-08-14 | 13F | Aqr Capital Management Llc | 63,374 | 81.39 | 17,285 | 100.50 | ||||
| 2025-08-05 | 13F | Bank of New York Mellon Corp | 29,293 | 7,990 | ||||||
| 2025-08-14 | 13F | Silvercrest Asset Management Group Llc | 4,034 | 0.30 | 1,100 | 10.89 | ||||
| 2025-05-15 | 13F | Glenmede Trust Co Na | 21,100 | 0.00 | 5,207 | -5.00 | ||||
| 2025-08-14 | 13F | Graney & King, LLC | 102 | 0.00 | 28 | 8.00 | ||||
| 2025-08-14 | 13F | Bank Of America Corp /de/ | 97,699 | -1.64 | 26,648 | 8.71 | ||||
| 2025-07-07 | 13F | Bangor Savings Bank | 0 | -100.00 | 0 | |||||
| 2025-07-16 | 13F | Embree Financial Group | 9,870 | -0.17 | 2,692 | 10.37 | ||||
| 2025-07-31 | 13F | CNB Bank | 3,189 | -11.54 | 870 | -2.25 | ||||
| 2025-07-25 | 13F | Atria Wealth Solutions, Inc. | 1,636 | -4.05 | 449 | 6.90 | ||||
| 2025-08-13 | 13F | Marshall Wace, Llp | 988 | 269 | ||||||
| 2025-08-14 | 13F | Gotham Asset Management, LLC | 41,208 | 30.62 | 11,239 | 44.37 | ||||
| 2025-08-14 | 13F | Great Valley Advisor Group, Inc. | 4,803 | 0.00 | 1,310 | 10.55 | ||||
| 2025-07-22 | 13F | Wealthcare Advisory Partners LLC | 1,763 | 0.00 | 481 | 10.60 | ||||
| 2025-08-13 | 13F | American Investment Services, Inc. | 0 | -100.00 | 0 | |||||
| 2025-08-12 | 13F | Proequities, Inc. | 0 | 0 | ||||||
| 2025-08-13 | 13F | BCJ Capital Management, LLC | 930 | 0.00 | 254 | 10.48 | ||||
| 2025-07-22 | 13F | Compass Financial Group, INC/SD | 4,665 | 0.00 | 1,272 | 10.51 | ||||
| 2025-07-18 | 13F | Cooper Financial Group | 1,470 | 401 | ||||||
| 2025-08-14 | 13F | Principal Street Partners, LLC | 5,248 | 100.00 | 1,431 | 121.17 | ||||
| 2025-08-11 | 13F | HighTower Advisors, LLC | 93,624 | -1.99 | 25,536 | 8.33 | ||||
| 2025-08-12 | 13F | New Republic Capital, LLC | 1,063 | 290 | ||||||
| 2025-08-14 | 13F | Jane Street Group, Llc | 3,800 | 44.10 | 1,036 | 59.38 | ||||
| 2025-08-12 | 13F | Jpmorgan Chase & Co | 40,506 | -2.51 | 11,048 | 7.76 | ||||
| 2025-08-14 | 13F | Susquehanna International Group, Llp | 75,540 | 105.11 | 20,604 | 126.73 | ||||
| 2025-07-30 | 13F | Brookstone Capital Management | 1,405 | 0.00 | 383 | 10.69 | ||||
| 2025-08-14 | 13F | Ameriprise Financial Inc | 525,460 | 1.47 | 143,561 | 12.46 | ||||
| 2025-08-08 | 13F | Emerald Investment Partners, Llc | 10 | 0.00 | 3 | 0.00 | ||||
| 2025-08-08 | 13F | Jacksonville Wealth Management, LLC | 2,990 | -1.52 | 816 | 8.81 | ||||
| 2025-03-12 | 13F/A | Private Capital Management Llc | 272 | 65 | ||||||
| 2025-07-02 | 13F | First Financial Bank - Trust Division | 3,788 | 1.23 | 1,033 | 11.92 | ||||
| 2025-08-14 | 13F | Mercer Global Advisors Inc /adv | 2,453 | 79.18 | 669 | 98.52 | ||||
| 2025-08-08 | 13F | Capital Investment Advisory Services, LLC | 618 | 0.00 | 168 | 10.53 | ||||
| 2025-08-14 | 13F | Operose Advisors LLC | 5,166 | 0.19 | 1,409 | 10.69 | ||||
| 2025-08-04 | 13F | Pensionmark Financial Group, Llc | 4,250 | -0.86 | 1,159 | 9.65 | ||||
| 2025-08-11 | 13F | Aptus Capital Advisors, LLC | 30 | 0.00 | 8 | 14.29 | ||||
| 2025-08-12 | 13F | MAI Capital Management | 3,505 | -0.79 | 956 | 9.64 | ||||
| 2025-08-29 | 13F | Evolution Wealth Management Inc. | 5,802 | 1,582 | ||||||
| 2025-08-08 | 13F | Cetera Investment Advisers | 18,502 | 2.83 | 5,046 | 13.65 | ||||
| 2025-07-28 | 13F | BRYN MAWR TRUST Co | 2,110 | 0.00 | 576 | 10.58 | ||||
| 2025-08-07 | 13F | Everhart Financial Group, Inc. | 3,148 | 37.11 | 859 | 51.59 | ||||
| 2025-08-14 | 13F | Capital Planning Advisors, LLC | 1,891 | 0.00 | 516 | 10.52 | ||||
| 2025-08-13 | 13F | Cerity Partners LLC | 140,611 | 4.93 | 38,352 | 15.98 | ||||
| 2025-08-08 | 13F | Avantax Advisory Services, Inc. | 6,049 | 2.44 | 1,650 | 13.18 | ||||
| 2025-08-08 | 13F | Family Firm, Inc. | 41,713 | 3.59 | 11,377 | 14.50 | ||||
| 2025-08-14 | 13F | NCP Inc. | 0 | -100.00 | 0 | |||||
| 2025-07-01 | 13F | Harbor Investment Advisory, Llc | 41 | 0.00 | 11 | 10.00 | ||||
| 2025-08-06 | 13F | AE Wealth Management LLC | 26 | 13.04 | 7 | 40.00 | ||||
| 2025-08-14 | 13F | Colony Group, LLC | 224,686 | 0.94 | 61,283 | 11.58 | ||||
| 2025-07-18 | 13F | PBMares Wealth Management LLC | 7,710 | -21.99 | 2,103 | -13.78 | ||||
| 2025-07-28 | 13F | Davidson Investment Advisors | 2,424 | 661 | ||||||
| 2025-08-13 | 13F | EverSource Wealth Advisors, LLC | 1 | 0.00 | 0 | |||||
| 2025-05-07 | 13F | Evermay Wealth Management Llc | 0 | -100.00 | 0 | |||||
| 2025-08-12 | 13F | Fairscale Capital, LLC | 2,655 | 0.00 | 740 | 12.82 | ||||
| 2025-08-13 | 13F | Grove Street Fiduciary, LLC | 1,992 | 0.00 | 543 | 10.59 | ||||
| 2025-07-11 | 13F | Adirondack Trust Co | 24,674 | 20.33 | 6,730 | 33.01 | ||||
| 2025-08-11 | 13F | Sykon Capital Llc | 920 | 0.00 | 251 | 10.13 | ||||
| 2025-07-29 | 13F | International Assets Investment Management, Llc | 0 | -100.00 | 0 | |||||
| 2025-08-08 | 13F | Red Cedar Investment Management, Llc | 14,523 | -9.13 | 3,961 | 0.46 | ||||
| 2025-08-14 | 13F | Fmr Llc | 3,873 | -22.74 | 1,056 | -14.63 | ||||
| 2025-08-13 | 13F | Momentous Wealth Management, Inc. | 943 | 0.00 | 257 | 10.78 | ||||
| 2025-07-10 | 13F | Tompkins Financial Corp | 220,065 | 22.58 | 60,023 | 35.49 | ||||
| 2025-07-22 | 13F | Olistico Wealth, LLC | 6 | 2 | ||||||
| 2025-08-08 | 13F | Creative Planning | 3,967 | 4.86 | 1,082 | 15.86 | ||||
| 2025-08-12 | 13F | Jacobi Capital Management LLC | 1,324 | 0.00 | 361 | 10.74 | ||||
| 2025-08-14 | 13F | Qube Research & Technologies Ltd | 188 | -47.63 | 51 | -42.05 | ||||
| 2025-08-14 | 13F | Pennington Partners & Co., Llc | 46,295 | 7.41 | 12,627 | 18.72 | ||||
| 2025-08-12 | 13F | AlphaCore Capital LLC | 29,711 | 6.76 | 8,104 | 18.00 | ||||
| 2025-08-14 | 13F | Comerica Bank | 14 | -99.34 | 4 | -99.43 | ||||
| 2025-08-12 | 13F | Global Retirement Partners, LLC | 344 | 421.21 | 94 | 447.06 | ||||
| 2025-08-15 | 13F | Morgan Stanley | 224,848 | 2.70 | 61,328 | 13.52 | ||||
| 2025-08-12 | 13F | Coston, McIsaac & Partners | 0 | -100.00 | 0 | |||||
| 2025-07-11 | 13F | AA Financial Advisors, LLC | 1,026 | -0.10 | 280 | 10.28 | ||||
| 2025-08-08 | 13F | Smithfield Trust Co | 340 | 0.00 | 0 | |||||
| 2025-08-14 | 13F | Synovus Financial Corp | 897 | 245 | ||||||
| 2025-07-24 | 13F | Us Bancorp \de\ | 2,681 | 0.00 | 731 | 10.59 | ||||
| 2025-08-13 | 13F | Baker Avenue Asset Management, LP | 1,517 | -45.92 | 414 | -40.32 | ||||
| 2025-08-14 | 13F | CoreCap Advisors, LLC | 0 | -100.00 | 0 | |||||
| 2025-08-13 | 13F | Keystone Financial Group | 2,615 | 0.00 | 713 | 10.54 | ||||
| 2025-08-12 | 13F | LPL Financial LLC | 85,680 | -8.04 | 23,369 | 1.65 | ||||
| 2025-07-31 | 13F | Cambridge Investment Research Advisors, Inc. | 16,341 | 3.35 | 4 | 33.33 | ||||
| 2025-07-10 | 13F | ARS Wealth Advisors Group, LLC | 1,834 | 0.00 | 500 | 10.62 | ||||
| 2025-07-28 | 13F | Private Wealth Asset Management, LLC | 4,400 | 1,200 | ||||||
| 2025-08-14 | 13F | Hrt Financial Lp | 8,737 | 2 | ||||||
| 2025-08-18 | 13F | N.E.W. Advisory Services LLC | 0 | -100.00 | 0 | |||||
| 2025-07-29 | 13F | Activest Wealth Management | 155 | 0.00 | 42 | 10.53 | ||||
| 2025-07-23 | 13F | Hardy Reed LLC | 8,048 | 0.00 | 2,195 | 10.58 | ||||
| 2025-07-09 | 13F | Pallas Capital Advisors LLC | 15,055 | 4,106 | ||||||
| 2025-08-15 | 13F | Tower Research Capital LLC (TRC) | 5,248 | 439.92 | 1,431 | 498.74 | ||||
| 2025-08-14 | 13F | Hirtle Callaghan & Co LLC | 2,500 | -16.67 | 682 | -7.97 | ||||
| 2025-08-07 | 13F | Commerce Bank | 37,517 | -6.38 | 10,233 | 3.48 | ||||
| 2025-06-03 | 13F/A | First National Bank Of Omaha | 1,274 | -39.01 | 314 | -29.28 | ||||
| 2025-04-30 | 13F | Brown Advisory Inc | 0 | -100.00 | 0 | -100.00 | ||||
| 2025-07-08 | 13F | Apella Capital, LLC | 4,269 | 1,170 | ||||||
| 2025-08-11 | 13F | Private Advisor Group, LLC | 32,686 | -14.42 | 8,915 | -5.40 | ||||
| 2025-07-24 | 13F | Jfs Wealth Advisors, Llc | 581 | 0.35 | 158 | 11.27 | ||||
| 2025-07-22 | 13F | Silvia Mccoll Wealth Management, Llc | 2,463 | 0.00 | 672 | 10.54 | ||||
| 2025-08-14 | 13F | Stifel Financial Corp | 19,198 | 31.33 | 5,236 | 45.16 | ||||
| 2025-08-04 | 13F | Silver Coast Investments LLC | 6,052 | 3.36 | 1,651 | 14.27 | ||||
| 2025-08-13 | 13F | Flow Traders U.s. Llc | 2,700 | 1 | ||||||
| 2025-08-14 | 13F | UBS Group AG | 60,887 | 32.10 | 16,607 | 46.01 | ||||
| 2025-07-09 | 13F | Sunpointe, LLC | 1,495 | 408 | ||||||
| 2025-07-24 | 13F | Blair William & Co/il | 386 | 26.56 | 105 | 40.00 | ||||
| 2025-05-02 | 13F | Wealthfront Advisers Llc | 0 | -100.00 | 0 | -100.00 | ||||
| 2025-04-28 | 13F | Strategic Financial Concepts, LLC | 0 | -100.00 | 0 | -100.00 | ||||
| 2025-08-06 | 13F | Paulson Wealth Management Inc. | 1,900 | -0.11 | 518 | 10.45 | ||||
| 2025-07-25 | 13F | Cwm, Llc | 26,918 | 0.96 | 7 | 16.67 | ||||
| 2025-08-14 | 13F | Kovitz Investment Group Partners, LLC | 866 | 0.00 | 236 | 10.80 | ||||
| 2025-07-29 | 13F | Wealthstream Advisors, Inc. | 32,874 | -2.84 | 8,966 | 7.39 | ||||
| 2025-08-11 | 13F | Nations Financial Group Inc, /ia/ /adv | 11,653 | -0.07 | 3,178 | 10.46 | ||||
| 2025-07-30 | 13F | Sonata Capital Group Inc | 850 | 0.00 | 0 |