Basic Stats
| Institutional Shares (Long) | 4,827,054 - 4.33% (ex 13D/G) - change of 1.54MM shares 46.79% MRQ |
| Institutional Value (Long) | $ 4,135 USD ($1000) |
Institutional Ownership and Shareholders
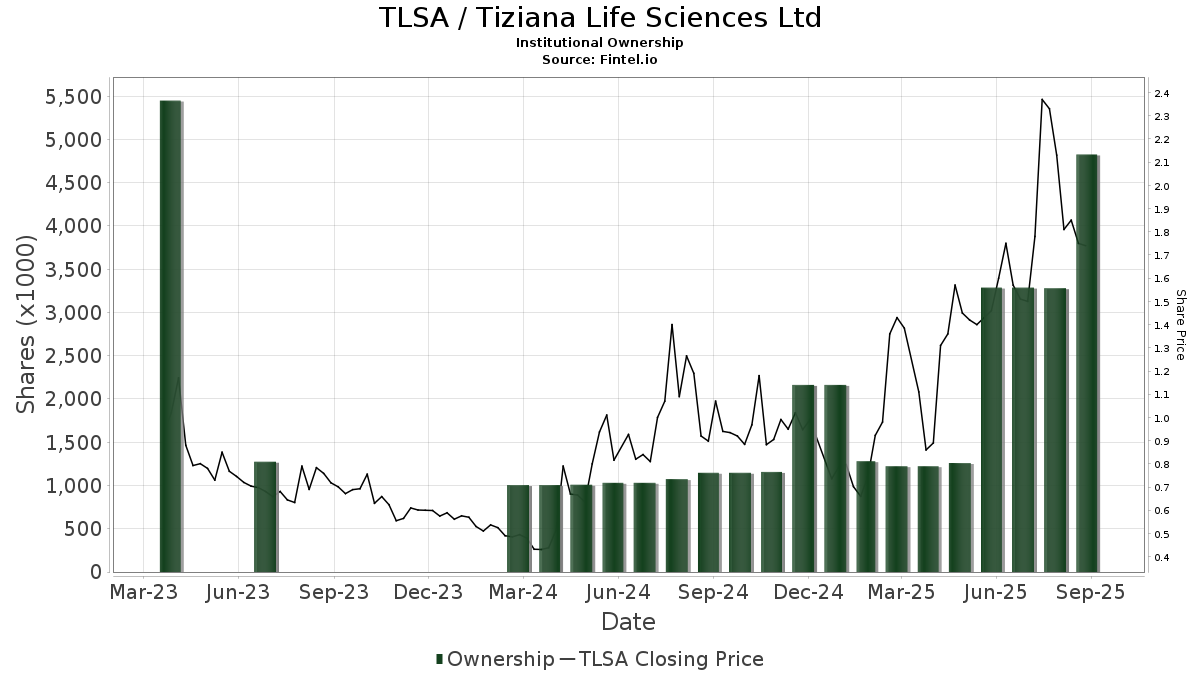
Tiziana Life Sciences Ltd (US:TLSA) has 33 institutional owners and shareholders that have filed 13D/G or 13F forms with the Securities Exchange Commission (SEC). These institutions hold a total of 4,827,054 shares. Largest shareholders include Dauntless Investment Group, LLC, Citadel Advisors Llc, ONEQ - Fidelity Nasdaq Composite Index Tracking Stock, Hsbc Holdings Plc, Zhang Financial LLC, Susquehanna International Group, Llp, Hrt Financial Lp, Kovitz Investment Group Partners, LLC, Geode Capital Management, Llc, and FNCMX - Fidelity Nasdaq Composite Index Fund .
Tiziana Life Sciences Ltd (NasdaqCM:TLSA) institutional ownership structure shows current positions in the company by institutions and funds, as well as latest changes in position size. Major shareholders can include individual investors, mutual funds, hedge funds, or institutions. The Schedule 13D indicates that the investor holds (or held) more than 5% of the company and intends (or intended) to actively pursue a change in business strategy. Schedule 13G indicates a passive investment of over 5%.
The share price as of September 5, 2025 is 1.66 / share. Previously, on September 6, 2024, the share price was 0.82 / share. This represents an increase of 102.44% over that period.
Fund Sentiment Score
The Fund Sentiment Score (fka Ownership Accumulation Score) finds the stocks that are being most bought by funds. It is the result of a sophisticated, multi-factor quantitative model that identifies companies with the highest levels of institutional accumulation. The scoring model uses a combination of the total increase in disclosed owners, the changes in portfolio allocations in those owners and other metrics. The number ranges from 0 to 100, with higher numbers indicating a higher level of accumulation to its peers, and 50 being the average.
Update Frequency: Daily
See Ownership Explorer, which provides a list of highest-ranking companies.
Institutional Put/Call Ratio
In addition to reporting standard equity and debt issues, institutions with more than 100MM assets under management must also disclose their put and call option holdings. Since put options generally indicate negative sentiment, and call options indicate positive sentiment, we can get a sense of the overall institutional sentiment by plotting the ratio of puts to calls. The chart to the right plots the historical put/call ratio for this instrument.
Using Put/Call Ratio as an indicator of investor sentiment overcomes one of the key deficiencies of using total institutional ownership, which is that a significant amount of assets under management are invested passively to track indices. Passively-managed funds do not typically buy options, so the put/call ratio indicator more closely tracks the sentiment of actively-managed funds.

13F and NPORT Filings
Detail on 13F filings are free. Detail on NP filings require a premium membership. Green rows indicate new positions. Red rows indicate closed positions. Click the link icon to see the full transaction history.
Upgrade
to unlock premium data and export to Excel ![]() .
.
| File Date | Source | Investor | Type | Avg Price (Est) |
Shares | Δ Shares (%) |
Reported Value ($1000) |
Δ Value (%) |
Port Alloc (%) |
|
|---|---|---|---|---|---|---|---|---|---|---|
| 2025-05-14 | 13F | Credit Agricole S A | 10,000 | 0.00 | 11 | 66.67 | ||||
| 2025-08-14 | 13F | Bank Of America Corp /de/ | 518 | -97.60 | 1 | -100.00 | ||||
| 2025-05-15 | 13F | Barclays Plc | 0 | -100.00 | 0 | |||||
| 2025-08-15 | 13F | CI Private Wealth, LLC | 20,354 | 23.53 | 32 | 88.24 | ||||
| 2025-05-01 | 13F | Bleakley Financial Group, LLC | 0 | -100.00 | 0 | |||||
| 2025-08-15 | 13F | Captrust Financial Advisors | 11,000 | -35.29 | 17 | -5.56 | ||||
| 2025-08-08 | 13F | Geode Capital Management, Llc | 78,204 | 0.41 | 124 | 46.43 | ||||
| 2025-08-14 | 13F | Mariner, LLC | 10,000 | 0.00 | 16 | 50.00 | ||||
| 2025-05-13 | 13F | Ground Swell Capital, LLC | 0 | -100.00 | 0 | |||||
| 2025-09-04 | 13F/A | Advisor Group Holdings, Inc. | 15,300 | -39.53 | 24 | -11.11 | ||||
| 2025-08-14 | 13F | Jane Street Group, Llc | 24,964 | -85.10 | 39 | -78.33 | ||||
| 2025-08-13 | 13F | Marshall Wace, Llp | 24,369 | 39 | ||||||
| 2025-05-15 | 13F | Tower Research Capital LLC (TRC) | 0 | -100.00 | 0 | |||||
| 2025-08-14 | 13F | Two Sigma Securities, Llc | 17,458 | -14.39 | 28 | 22.73 | ||||
| 2025-08-13 | 13F | OMERS ADMINISTRATION Corp | 0 | -100.00 | 0 | |||||
| 2025-08-01 | 13F | Zhang Financial LLC | 89,760 | -6.75 | 142 | 36.89 | ||||
| 2025-08-13 | 13F | Hsbc Holdings Plc | 105,365 | 0.00 | 166 | 46.90 | ||||
| 2025-08-15 | 13F | Morgan Stanley | 73,271 | -47.30 | 116 | -23.33 | ||||
| 2025-07-24 | 13F | JNBA Financial Advisors | 12,000 | 0.00 | 19 | 50.00 | ||||
| 2025-08-14 | 13F | Citadel Advisors Llc | Call | 0 | -100.00 | 0 | ||||
| 2025-07-14 | 13F | Caitlin John, LLC | 10,000 | 16 | ||||||
| 2025-08-14 | 13F | Cubist Systematic Strategies, LLC | 0 | -100.00 | 0 | |||||
| 2025-07-24 | NP | FNCMX - Fidelity Nasdaq Composite Index Fund This fund is a listed as child fund of Fmr Llc and if that institution has disclosed ownership in this security, then these positions will not be double counted when calculating total shares and total value | 77,885 | 0.00 | 106 | 5.00 | ||||
| 2025-08-12 | 13F | Proequities, Inc. | 0 | 0 | ||||||
| 2025-08-14 | 13F | Susquehanna International Group, Llp | 86,085 | 50.16 | 136 | 122.95 | ||||
| 2025-07-16 | 13F | Novem Group | 0 | -100.00 | 0 | |||||
| 2025-08-14 | 13F | Raymond James Financial Inc | 500 | 1 | ||||||
| 2025-08-14 | 13F | Kovitz Investment Group Partners, LLC | 79,365 | 0.00 | 125 | 47.06 | ||||
| 2025-07-17 | 13F | Venture Visionary Partners LLC | 10,000 | 0.00 | 16 | 50.00 | ||||
| 2025-07-18 | 13F | Ewa, Llc | 47,087 | -1.08 | 74 | 45.10 | ||||
| 2025-08-14 | 13F | Wells Fargo & Company/mn | 1,000 | 0.00 | 2 | 0.00 | ||||
| 2025-05-14 | 13F | Level Four Advisory Services, Llc | 0 | -100.00 | 0 | |||||
| 2025-07-24 | 13F | Bernard Wealth Management Corp. | 500 | 0.00 | 1 | |||||
| 2025-07-15 | 13F | Armis Advisers, LLC | 42,795 | 0.00 | 63 | 8.62 | ||||
| 2025-08-14 | 13F | Citadel Advisors Llc | Put | 0 | -100.00 | 0 | ||||
| 2025-08-08 | 13F | Wealth Alliance | 10,300 | 3.00 | 16 | 60.00 | ||||
| 2025-08-12 | 13F | Jpmorgan Chase & Co | 0 | -100.00 | 0 | |||||
| 2025-08-14 | 13F | Bnp Paribas Arbitrage, Sa | 0 | -100.00 | 0 | |||||
| 2025-05-15 | 13F | Federation des caisses Desjardins du Quebec | 0 | -100.00 | 0 | |||||
| 2025-04-25 | NP | ONEQ - Fidelity Nasdaq Composite Index Tracking Stock This fund is a listed as child fund of Fmr Llc and if that institution has disclosed ownership in this security, then these positions will not be double counted when calculating total shares and total value | 169,349 | 2.75 | 218 | 37.97 | ||||
| 2025-08-14 | 13F | Dauntless Investment Group, LLC | 3,418,617 | 96.52 | 2,241 | 19.33 | ||||
| 2025-08-14 | 13F | Hrt Financial Lp | 84,106 | 19.53 | 0 | |||||
| 2025-07-29 | 13F | Tradewinds Capital Management, LLC | 250 | 0.00 | 0 | |||||
| 2025-08-14 | 13F | UBS Group AG | 4,289 | -12.45 | 7 | 20.00 | ||||
| 2025-08-05 | 13F | Simplex Trading, Llc | 67,251 | 0 | ||||||
| 2025-08-14 | 13F | Cantor Fitzgerald, L. P. | 0 | -100.00 | 0 | |||||
| 2025-08-12 | 13F | LPL Financial LLC | 26,122 | 6.09 | 41 | 57.69 | ||||
| 2025-08-14 | 13F | Citadel Advisors Llc | 198,990 | 314 | ||||||
| 2025-05-14 | 13F | Studio Investment Management Llc | 0 | -100.00 | 0 | |||||
| 2025-05-23 | 13F | SWAN Capital LLC | 0 | -100.00 | 0 | |||||
| 2025-05-06 | 13F | Atria Investments Llc | 0 | -100.00 | 0 |
Other Listings
| DE:0RP | €1.32 |