Basic Stats
| Institutional Owners | 41 total, 41 long only, 0 short only, 0 long/short - change of -2.38% MRQ |
| Average Portfolio Allocation | 0.3385 % - change of 6.47% MRQ |
| Institutional Shares (Long) | 1,222,182 (ex 13D/G) - change of -0.86MM shares -41.28% MRQ |
| Institutional Value (Long) | $ 40,797 USD ($1000) |
Institutional Ownership and Shareholders
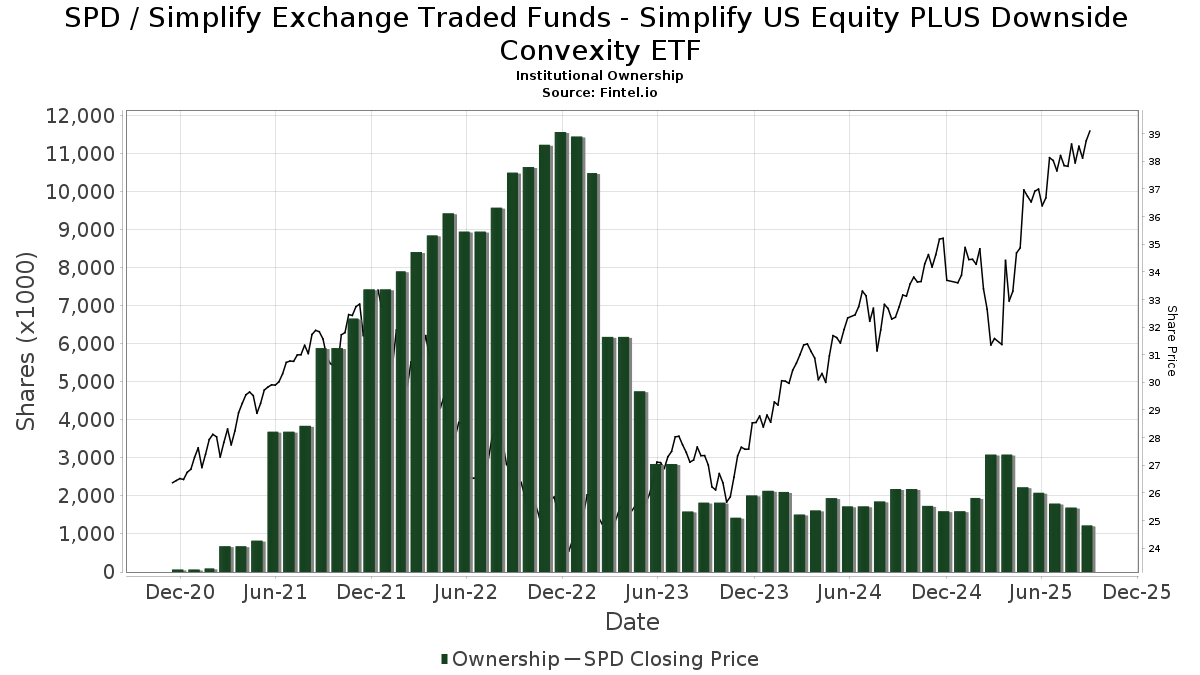
Simplify Exchange Traded Funds - Simplify US Equity PLUS Downside Convexity ETF (US:SPD) has 41 institutional owners and shareholders that have filed 13D/G or 13F forms with the Securities Exchange Commission (SEC). These institutions hold a total of 1,222,182 shares. Largest shareholders include Authentikos Wealth Advisory, LLC, AE Wealth Management LLC, Commonwealth Equity Services, Llc, Evolution Wealth Management Inc., Ironsides Asset Advisors, LLC, Atomi Financial Group, Inc., Austin Wealth Management, LLC, Lloyd Advisory Services, LLC., Old Mission Capital Llc, and B.O.S.S. Retirement Advisors, LLC .
Simplify Exchange Traded Funds - Simplify US Equity PLUS Downside Convexity ETF (ARCA:SPD) institutional ownership structure shows current positions in the company by institutions and funds, as well as latest changes in position size. Major shareholders can include individual investors, mutual funds, hedge funds, or institutions. The Schedule 13D indicates that the investor holds (or held) more than 5% of the company and intends (or intended) to actively pursue a change in business strategy. Schedule 13G indicates a passive investment of over 5%.
The share price as of September 5, 2025 is 38.33 / share. Previously, on September 9, 2024, the share price was 31.94 / share. This represents an increase of 20.04% over that period.
Fund Sentiment Score
The Fund Sentiment Score (fka Ownership Accumulation Score) finds the stocks that are being most bought by funds. It is the result of a sophisticated, multi-factor quantitative model that identifies companies with the highest levels of institutional accumulation. The scoring model uses a combination of the total increase in disclosed owners, the changes in portfolio allocations in those owners and other metrics. The number ranges from 0 to 100, with higher numbers indicating a higher level of accumulation to its peers, and 50 being the average.
Update Frequency: Daily
See Ownership Explorer, which provides a list of highest-ranking companies.
Institutional Put/Call Ratio
In addition to reporting standard equity and debt issues, institutions with more than 100MM assets under management must also disclose their put and call option holdings. Since put options generally indicate negative sentiment, and call options indicate positive sentiment, we can get a sense of the overall institutional sentiment by plotting the ratio of puts to calls. The chart to the right plots the historical put/call ratio for this instrument.
Using Put/Call Ratio as an indicator of investor sentiment overcomes one of the key deficiencies of using total institutional ownership, which is that a significant amount of assets under management are invested passively to track indices. Passively-managed funds do not typically buy options, so the put/call ratio indicator more closely tracks the sentiment of actively-managed funds.
13F and NPORT Filings
Detail on 13F filings are free. Detail on NP filings require a premium membership. Green rows indicate new positions. Red rows indicate closed positions. Click the link icon to see the full transaction history.
Upgrade
to unlock premium data and export to Excel ![]() .
.
| File Date | Source | Investor | Type | Avg Price (Est) |
Shares | Δ Shares (%) |
Reported Value ($1000) |
Δ Value (%) |
Port Alloc (%) |
|
|---|---|---|---|---|---|---|---|---|---|---|
| 2025-08-14 | 13F | UBS Group AG | 122 | -95.95 | 5 | -95.70 | ||||
| 2025-08-14 | 13F | Royal Bank Of Canada | 700 | -30.97 | 27 | -15.62 | ||||
| 2025-07-16 | 13F | Kathmere Capital Management, LLC | 7,676 | 0.00 | 292 | 22.78 | ||||
| 2025-07-09 | 13F | Dynamic Advisor Solutions LLC | 8,573 | -2.42 | 326 | 19.93 | ||||
| 2025-08-12 | 13F | LPL Financial LLC | 24,116 | 19.53 | 917 | 46.79 | ||||
| 2025-06-17 | 13F | Ridgepath Capital Management LLC | 0 | -100.00 | 0 | |||||
| 2025-08-06 | 13F | Commonwealth Equity Services, Llc | 143,982 | 20.71 | 5 | 66.67 | ||||
| 2025-08-14 | 13F | Susquehanna International Group, Llp | 0 | -100.00 | 0 | |||||
| 2025-08-08 | 13F | Austin Wealth Management, LLC | 54,756 | -44.64 | 2,061 | -39.36 | ||||
| 2025-07-10 | 13F | Wealth Enhancement Advisory Services, Llc | 30,797 | -85.43 | 1,199 | -81.66 | ||||
| 2025-05-16 | 13F | Coppell Advisory Solutions LLC | 0 | -100.00 | 0 | |||||
| 2025-07-09 | 13F | Fiduciary Alliance LLC | 18,987 | -13.02 | 722 | 6.81 | ||||
| 2025-08-12 | 13F | Insigneo Advisory Services, Llc | 16,273 | 0.00 | 619 | 22.86 | ||||
| 2025-08-05 | 13F | Lord & Richards Wealth Management, LLC | 0 | -100.00 | 0 | |||||
| 2025-08-11 | 13F | Ironsides Asset Advisors, LLC | 83,322 | 0.71 | 3,168 | 23.76 | ||||
| 2025-08-06 | 13F | Decker Retirement Planning Inc. | 81 | 3 | ||||||
| 2025-07-16 | 13F | Lloyd Advisory Services, LLC. | 45,784 | 1,741 | ||||||
| 2025-08-12 | 13F | Jpmorgan Chase & Co | 0 | -100.00 | 0 | |||||
| 2025-07-25 | 13F | Cwm, Llc | 840 | 7.55 | 0 | |||||
| 2025-07-25 | 13F | Pathway Financial Advisors LLC | 7,115 | 0.00 | 270 | 22.73 | ||||
| 2025-08-07 | 13F | Alpha Cubed Investments, LLC | 0 | -100.00 | 0 | |||||
| 2025-07-30 | 13F | LifeWealth Investments, LLC | 10,952 | 416 | ||||||
| 2025-08-18 | 13F | Wolverine Trading, Llc | 0 | -100.00 | 0 | |||||
| 2025-08-13 | 13F | Transce3nd, LLC | 782 | 30 | ||||||
| 2025-08-29 | 13F | Evolution Wealth Management Inc. | 94,750 | 3,602 | ||||||
| 2025-08-06 | 13F | Ethos Financial Group, LLC | 0 | -100.00 | 0 | |||||
| 2025-07-08 | 13F | Nbc Securities, Inc. | 380 | 0.00 | 0 | |||||
| 2025-04-25 | 13F | Almanack Investment Partners, LLC. | 0 | -100.00 | 0 | |||||
| 2025-07-18 | 13F | B.O.S.S. Retirement Advisors, LLC | 42,618 | 1,620 | ||||||
| 2025-08-14 | 13F | Atomi Financial Group, Inc. | 61,357 | -0.39 | 2,333 | 22.41 | ||||
| 2025-04-30 | 13F | Axxcess Wealth Management, Llc | 0 | -100.00 | 0 | |||||
| 2025-08-07 | 13F | Allworth Financial LP | 1 | 0.00 | 0 | |||||
| 2025-07-24 | 13F | Us Bancorp \de\ | 0 | -100.00 | 0 | |||||
| 2025-07-07 | 13F | Park Edge Advisors, LLC | 31,522 | -36.47 | 1,198 | -21.90 | ||||
| 2025-08-06 | 13F | AE Wealth Management LLC | 185,279 | 6,701.73 | 7,044 | 8,284.52 | ||||
| 2025-08-11 | 13F | Pineridge Advisors LLC | 8 | 0 | ||||||
| 2025-05-02 | 13F | Capital A Wealth Management, LLC | 0 | -100.00 | 0 | |||||
| 2025-08-14 | 13F | Jane Street Group, Llc | 0 | -100.00 | 0 | |||||
| 2025-04-17 | 13F | Great Lakes Retirement, Inc. | 0 | -100.00 | 0 | |||||
| 2025-09-04 | 13F/A | Advisor Group Holdings, Inc. | 7,218 | 21.78 | 265 | 44.26 | ||||
| 2025-07-15 | 13F | Armis Advisers, LLC | 7,894 | -7.05 | 299 | 1.36 | ||||
| 2025-08-07 | 13F | Authentikos Wealth Advisory, LLC | 190,147 | -13.10 | 7,229 | 6.81 | ||||
| 2025-08-12 | 13F | CIBC Private Wealth Group, LLC | 650 | 0.00 | 25 | 26.32 | ||||
| 2025-07-11 | 13F | Farther Finance Advisors, LLC | 2,184 | 0.00 | 83 | 23.88 | ||||
| 2025-08-07 | 13F | Howard Bailey Securities, Llc | 16,194 | 616 | ||||||
| 2025-08-11 | 13F | Rothschild Investment Llc | 231 | 0.00 | 9 | 14.29 | ||||
| 2025-08-07 | 13F | Sollinda Capital Management LLC | 22,263 | 0.00 | 846 | 22.97 | ||||
| 2025-08-12 | 13F | Proequities, Inc. | 0 | 0 | ||||||
| 2025-07-24 | 13F | IFP Advisors, Inc | 147 | 0.00 | 6 | 25.00 | ||||
| 2025-08-12 | 13F | Global Retirement Partners, LLC | 39 | 1 | ||||||
| 2025-07-15 | 13F | Elevated Capital Advisors, LLC | 18,341 | 0.00 | 567 | 0.00 | ||||
| 2025-08-12 | 13F | Park Square Financial Group, LLC | 280 | 2,233.33 | 11 | |||||
| 2025-08-14 | 13F | Old Mission Capital Llc | 44,281 | 1,683 | ||||||
| 2025-05-01 | 13F | Quest 10 Wealth Builders, Inc. | 0 | -100.00 | 0 | |||||
| 2025-08-11 | 13F | HighTower Advisors, LLC | 0 | -100.00 | 0 | |||||
| 2025-08-12 | 13F | Steward Partners Investment Advisory, Llc | 41,493 | 0.00 | 1,577 | 22.92 | ||||
| 2025-08-12 | 13F | Richard W. Paul & Associates, LLC | 46 | 2 | ||||||
| 2025-08-15 | 13F | Morgan Stanley | 1 | 0.00 | 0 | |||||
| 2025-08-13 | 13F/A | StoneX Group Inc. | 0 | -100.00 | 0 | -100.00 | ||||
| 2025-08-14 | 13F | Citadel Advisors Llc | 0 | -100.00 | 0 |