Basic Stats
| Institutional Owners | 92 total, 92 long only, 0 short only, 0 long/short - change of 1.10% MRQ |
| Average Portfolio Allocation | 0.1423 % - change of 49.41% MRQ |
| Institutional Shares (Long) | 12,335,193 (ex 13D/G) - change of 0.80MM shares 6.91% MRQ |
| Institutional Value (Long) | $ 190,639 USD ($1000) |
Institutional Ownership and Shareholders
VanEck ETF Trust - VanEck Short Muni ETF (US:SMB) has 92 institutional owners and shareholders that have filed 13D/G or 13F forms with the Securities Exchange Commission (SEC). These institutions hold a total of 12,335,193 shares. Largest shareholders include Bank Of America Corp /de/, Allworth Financial LP, M Holdings Securities, Inc., Wells Fargo & Company/mn, LPL Financial LLC, Morgan Stanley, Jpmorgan Chase & Co, Miracle Mile Advisors, LLC, Dohj, Llc, and Ameriprise Financial Inc .
VanEck ETF Trust - VanEck Short Muni ETF (BATS:SMB) institutional ownership structure shows current positions in the company by institutions and funds, as well as latest changes in position size. Major shareholders can include individual investors, mutual funds, hedge funds, or institutions. The Schedule 13D indicates that the investor holds (or held) more than 5% of the company and intends (or intended) to actively pursue a change in business strategy. Schedule 13G indicates a passive investment of over 5%.
The share price as of September 5, 2025 is 17.38 / share. Previously, on September 6, 2024, the share price was 17.24 / share. This represents an increase of 0.78% over that period.

Fund Sentiment Score
The Fund Sentiment Score (fka Ownership Accumulation Score) finds the stocks that are being most bought by funds. It is the result of a sophisticated, multi-factor quantitative model that identifies companies with the highest levels of institutional accumulation. The scoring model uses a combination of the total increase in disclosed owners, the changes in portfolio allocations in those owners and other metrics. The number ranges from 0 to 100, with higher numbers indicating a higher level of accumulation to its peers, and 50 being the average.
Update Frequency: Daily
See Ownership Explorer, which provides a list of highest-ranking companies.
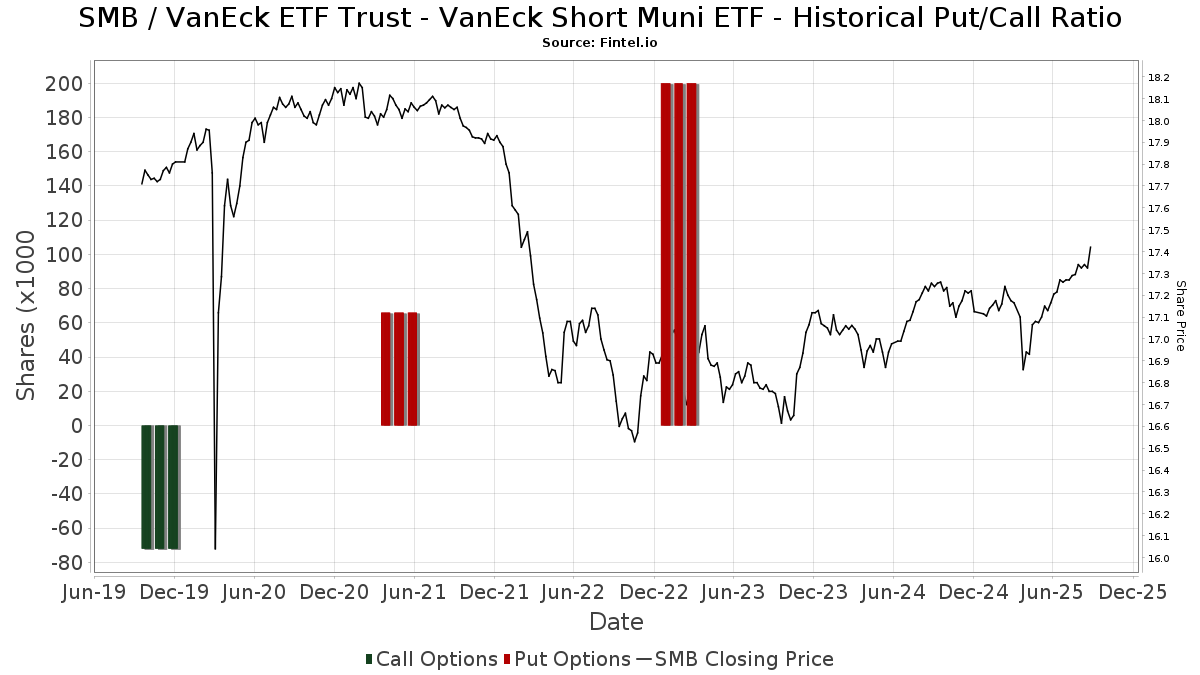
Institutional Put/Call Ratio
In addition to reporting standard equity and debt issues, institutions with more than 100MM assets under management must also disclose their put and call option holdings. Since put options generally indicate negative sentiment, and call options indicate positive sentiment, we can get a sense of the overall institutional sentiment by plotting the ratio of puts to calls. The chart to the right plots the historical put/call ratio for this instrument.
Using Put/Call Ratio as an indicator of investor sentiment overcomes one of the key deficiencies of using total institutional ownership, which is that a significant amount of assets under management are invested passively to track indices. Passively-managed funds do not typically buy options, so the put/call ratio indicator more closely tracks the sentiment of actively-managed funds.
13F and NPORT Filings
Detail on 13F filings are free. Detail on NP filings require a premium membership. Green rows indicate new positions. Red rows indicate closed positions. Click the link icon to see the full transaction history.
Upgrade
to unlock premium data and export to Excel ![]() .
.
| File Date | Source | Investor | Type | Avg Price (Est) |
Shares | Δ Shares (%) |
Reported Value ($1000) |
Δ Value (%) |
Port Alloc (%) |
|
|---|---|---|---|---|---|---|---|---|---|---|
| 2025-08-13 | 13F | EverSource Wealth Advisors, LLC | 12,070 | 18.57 | 208 | 19.54 | ||||
| 2025-08-13 | 13F | Jones Financial Companies Lllp | 26,210 | 21.95 | 452 | 22.55 | ||||
| 2025-08-12 | 13F | Jpmorgan Chase & Co | 512,454 | 15.52 | 8,845 | 16.35 | ||||
| 2025-08-14 | 13F | CoreCap Advisors, LLC | 2 | 0.00 | 0 | |||||
| 2025-08-11 | 13F | One Capital Management, LLC | 25,710 | 0.00 | 444 | 0.68 | ||||
| 2025-07-07 | 13F | Capital Asset Advisory Services LLC | 19,800 | 0.00 | 341 | 0.89 | ||||
| 2025-08-11 | 13F | Aptus Capital Advisors, LLC | 3,073 | 0.00 | 53 | 1.92 | ||||
| 2025-08-14 | 13F | Financial Advisory Service, Inc. | 39,836 | -1.40 | 688 | -0.72 | ||||
| 2025-07-25 | 13F | Cwm, Llc | 4,384 | 0.00 | 0 | |||||
| 2025-08-12 | 13F | Titleist Asset Management, Llc | 14,525 | 0.00 | 251 | 0.81 | ||||
| 2025-08-12 | 13F | MAI Capital Management | 5 | 0.00 | 0 | |||||
| 2025-08-08 | 13F | Cetera Investment Advisers | 40,724 | 10.16 | 703 | 10.90 | ||||
| 2025-07-09 | 13F | Brand Asset Management Group, Inc. | 0 | -100.00 | 0 | |||||
| 2025-08-13 | 13F | Northwestern Mutual Wealth Management Co | 0 | -100.00 | 0 | |||||
| 2025-07-09 | 13F | Massmutual Trust Co Fsb/adv | 323 | 0.00 | 6 | 0.00 | ||||
| 2025-07-28 | 13F | Harbour Investments, Inc. | 5,112 | 0.41 | 88 | 1.15 | ||||
| 2025-08-13 | 13F | Boston Family Office Llc | 13,896 | 0.00 | 0 | |||||
| 2025-08-14 | 13F | Stifel Financial Corp | 340,161 | 42.29 | 5,871 | 43.33 | ||||
| 2025-08-14 | 13F | Integrated Wealth Concepts LLC | 136,927 | 17.55 | 2,363 | 18.45 | ||||
| 2025-07-22 | 13F | Miracle Mile Advisors, LLC | 406,418 | 7,015 | ||||||
| 2025-08-04 | 13F | Arkadios Wealth Advisors | 34,500 | 10.58 | 595 | 11.42 | ||||
| 2025-08-15 | 13F | Morgan Stanley | 519,043 | 5.71 | 8,959 | 6.48 | ||||
| 2025-07-07 | 13F | Versant Capital Management, Inc | 5,435 | -1.47 | 94 | -1.06 | ||||
| 2025-08-14 | 13F | Mml Investors Services, Llc | 93,124 | -3.43 | 2 | 0.00 | ||||
| 2025-04-15 | 13F | Wealthcare Advisory Partners LLC | 0 | -100.00 | 0 | -100.00 | ||||
| 2025-08-14 | 13F | UBS Group AG | 308,200 | -6.70 | 5,320 | -6.02 | ||||
| 2025-07-29 | 13F | Private Trust Co Na | 42,009 | -9.06 | 725 | -8.34 | ||||
| 2025-09-04 | 13F/A | Advisor Group Holdings, Inc. | 162,393 | 10.48 | 2,803 | 11.23 | ||||
| 2025-07-18 | 13F | PFG Investments, LLC | 15,160 | -9.18 | 262 | -8.74 | ||||
| 2025-07-21 | 13F | Ascent Group, LLC | 49,004 | 82.27 | 846 | 83.70 | ||||
| 2025-08-13 | 13F | Transce3nd, LLC | 10,731 | 0.00 | 185 | 1.09 | ||||
| 2025-08-14 | 13F | Raymond James Financial Inc | 76,689 | 8.04 | 1,324 | 8.80 | ||||
| 2025-08-14 | 13F | Wells Fargo & Company/mn | 562,567 | 3.55 | 9,710 | 4.30 | ||||
| 2025-07-07 | 13F | Nova Wealth Management, Inc. | 296 | 0.00 | 5 | 0.00 | ||||
| 2025-07-17 | 13F | Clean Yield Group | 2,216 | 0.00 | 38 | 2.70 | ||||
| 2025-08-08 | 13F | Condor Capital Management | 215,199 | 0.32 | 3,714 | 1.06 | ||||
| 2025-08-12 | 13F | Proequities, Inc. | 0 | 0 | ||||||
| 2025-04-09 | 13F | St Germain D J Co Inc | 0 | -100.00 | 0 | |||||
| 2025-08-14 | 13F | Bank Of America Corp /de/ | 1,880,725 | -8.99 | 32,461 | -8.32 | ||||
| 2025-07-08 | 13F | Juncture Wealth Strategies, Llc | 31,962 | 3.48 | 552 | 4.16 | ||||
| 2025-08-11 | 13F | Principal Securities, Inc. | 3,847 | 34.32 | 66 | 37.50 | ||||
| 2025-07-17 | 13F | Janney Capital Management LLC | 143,426 | -1.00 | 2 | 0.00 | ||||
| 2025-07-30 | 13F | Eqis Capital Management, Inc. | 48,922 | -4.34 | 844 | -3.65 | ||||
| 2025-08-14 | 13F | Ancora Advisors, LLC | 3,580 | -2.72 | 62 | -3.17 | ||||
| 2025-08-12 | 13F | Ameritas Investment Partners, Inc. | 41,687 | -10.21 | 720 | -9.56 | ||||
| 2025-08-08 | 13F | Emerald Investment Partners, Llc | 15,813 | 0.00 | 273 | 0.74 | ||||
| 2025-08-18 | 13F | Geneos Wealth Management Inc. | 386 | 52.57 | 7 | 50.00 | ||||
| 2025-08-05 | 13F | Cherry Tree Wealth Management, LLC | 10,628 | -14.79 | 183 | -14.08 | ||||
| 2025-08-07 | 13F | Allworth Financial LP | 1,867,063 | 5.42 | 32,226 | 7.03 | ||||
| 2025-08-11 | 13F | Diversified Portfolios, Inc. | 28,114 | -69.78 | 485 | -69.57 | ||||
| 2025-07-23 | 13F | Prime Capital Investment Advisors, LLC | 27,444 | 0.66 | 474 | 1.28 | ||||
| 2025-07-17 | 13F | Kavar Capital Partners Group, Llc | 12,500 | 216 | ||||||
| 2025-08-14 | 13F | Jane Street Group, Llc | 28,745 | -47.60 | 496 | -47.18 | ||||
| 2025-07-30 | 13F | Evermay Wealth Management Llc | 9,472 | 0.00 | 163 | 0.62 | ||||
| 2025-05-12 | 13F | Providence First Trust Co | 0 | -100.00 | 0 | |||||
| 2025-08-12 | 13F | Global Retirement Partners, LLC | 2,385 | 0.00 | 41 | 2.50 | ||||
| 2025-07-24 | 13F | Us Bancorp \de\ | 686 | 12 | ||||||
| 2025-07-23 | 13F | Detalus Advisors, LLC | 25,646 | 15.62 | 443 | 16.32 | ||||
| 2025-04-17 | 13F | Vicus Capital | 0 | -100.00 | 0 | |||||
| 2025-08-11 | 13F | HighTower Advisors, LLC | 0 | -100.00 | 0 | |||||
| 2025-08-12 | 13F | LPL Financial LLC | 558,498 | 10.78 | 9,640 | 11.59 | ||||
| 2025-08-06 | 13F | AE Wealth Management LLC | 544 | -3.72 | 9 | 0.00 | ||||
| 2025-07-23 | 13F | Dohj, Llc | 389,766 | 6.99 | 6,599 | 5.70 | ||||
| 2025-08-15 | 13F | Equitable Holdings, Inc. | 21,624 | 373 | ||||||
| 2025-07-10 | 13F | IMPACTfolio, LLC | 156,672 | 3.35 | 2,704 | 4.12 | ||||
| 2025-08-06 | 13F | Hallmark Capital Management Inc | 2,407 | 0.00 | 42 | 0.00 | ||||
| 2025-07-18 | 13F | Bartlett & Co. Wealth Management Llc | 47,588 | -13.42 | 821 | -12.75 | ||||
| 2025-08-11 | 13F | Private Advisor Group, LLC | 67,896 | 9.06 | 1,172 | 9.85 | ||||
| 2025-07-29 | 13F | Liberty Square Wealth Partners Llc | 32,509 | 0.00 | 561 | 0.72 | ||||
| 2025-08-01 | 13F | Envestnet Asset Management Inc | 53,089 | -44.95 | 916 | -44.55 | ||||
| 2025-08-14 | 13F | Royal Bank Of Canada | 12,750 | 0.00 | 220 | 0.92 | ||||
| 2025-08-19 | 13F | Anchor Investment Management, LLC | 2,000 | 35 | ||||||
| 2025-07-24 | 13F | IFP Advisors, Inc | 8,000 | 0.00 | 138 | 0.73 | ||||
| 2025-08-05 | 13F | Westside Investment Management, Inc. | 67,462 | 0.69 | 1,164 | 1.39 | ||||
| 2025-07-30 | 13F | Rehmann Capital Advisory Group | 18,398 | -70.54 | 318 | -70.37 | ||||
| 2025-08-04 | 13F | Flagship Harbor Advisors, Llc | 11,132 | 0.01 | 192 | 1.05 | ||||
| 2025-08-14 | 13F | Sei Investments Co | 264,144 | 18.22 | 4,559 | 19.10 | ||||
| 2025-07-22 | 13F | Merit Financial Group, LLC | 36,323 | -7.61 | 627 | -6.98 | ||||
| 2025-08-06 | 13F | Commonwealth Equity Services, Llc | 22,028 | -24.39 | 0 | |||||
| 2025-08-13 | 13F | Willis Johnson & Associates, Inc. | 212,711 | -8.87 | 3,671 | -8.20 | ||||
| 2025-08-14 | 13F | Ameriprise Financial Inc | 378,708 | -8.53 | 6,537 | -7.87 | ||||
| 2025-07-08 | 13F | Gradient Investments LLC | 90,573 | 1,563 | ||||||
| 2025-07-11 | 13F | Farther Finance Advisors, LLC | 0 | -100.00 | 0 | |||||
| 2025-08-13 | 13F | M Holdings Securities, Inc. | 675,266 | 10.15 | 12 | 10.00 | ||||
| 2025-07-10 | 13F | Wealth Enhancement Advisory Services, Llc | 27,362 | -4.73 | 473 | -4.07 | ||||
| 2025-08-13 | 13F | Cerity Partners LLC | 228,882 | 16.16 | 3,950 | 17.00 | ||||
| 2025-07-14 | 13F | MY Wealth Management Inc. | 253,241 | 4,371 | ||||||
| 2025-07-28 | 13F | Axxcess Wealth Management, Llc | 19,800 | 0.00 | 342 | 0.59 | ||||
| 2025-08-13 | 13F | Flow Traders U.s. Llc | 0 | -100.00 | 0 | |||||
| 2025-07-17 | 13F | Keystone Global Partners, LLC | 3,354 | -77.67 | 58 | -77.82 | ||||
| 2025-07-23 | 13F | Fluent Financial, LLC | 17,065 | 0.21 | 295 | 1.03 | ||||
| 2025-08-05 | 13F | Prosperity Consulting Group, LLC | 167,231 | -4.94 | 2,886 | -4.25 | ||||
| 2025-08-19 | 13F | Newbridge Financial Services Group, Inc. | 333 | 0.00 | 6 | 0.00 | ||||
| 2025-08-14 | 13F | Susquehanna International Group, Llp | 10,726 | 185 | ||||||
| 2025-08-11 | 13F | WPG Advisers, LLC | 38 | 0.00 | 1 | |||||
| 2025-07-25 | 13F | PrairieView Partners, LLC | 329,136 | 12.32 | 6 | 0.00 | ||||
| 2025-08-08 | 13F | Pnc Financial Services Group, Inc. | 253 | -50.10 | 4 | -50.00 | ||||
| 2025-08-05 | 13F | Strategic Financial Concepts, LLC | 0 | -100.00 | 0 | |||||
| 2025-07-22 | 13F | Berger Financial Group, Inc | 11,048 | 0.00 | 191 | 0.53 | ||||
| 2025-08-14 | 13F | Fmr Llc | 31 | -93.97 | 1 | -100.00 | ||||
| 2025-08-14 | 13F | Comerica Bank | 43,927 | 0.00 | 758 | 0.80 | ||||
| 2025-04-21 | 13F | Nelson, Van Denburg & Campbell Wealth Management Group, LLC | 0 | -100.00 | 0 | |||||
| 2025-08-06 | 13F | Golden State Wealth Management, LLC | 7,547 | -0.58 | 130 | 0.00 | ||||
| 2025-05-09 | 13F | Leisure Capital Management | 0 | -100.00 | 0 | |||||
| 2025-08-14 | 13F | MidWestOne Financial Group, Inc. | 203,904 | 19.39 | 3,519 | 20.27 | ||||
| 2025-05-09 | 13F | Atria Wealth Solutions, Inc. | 0 | -100.00 | 0 |