SCYB - Schwab Strategic Trust - Schwab High Yield Bond ETF Stock - Stock Price, Institutional Ownership, Shareholders (ARCA)

Schwab Strategic Trust - Schwab High Yield Bond ETF
US ˙ ARCA

Basic Stats
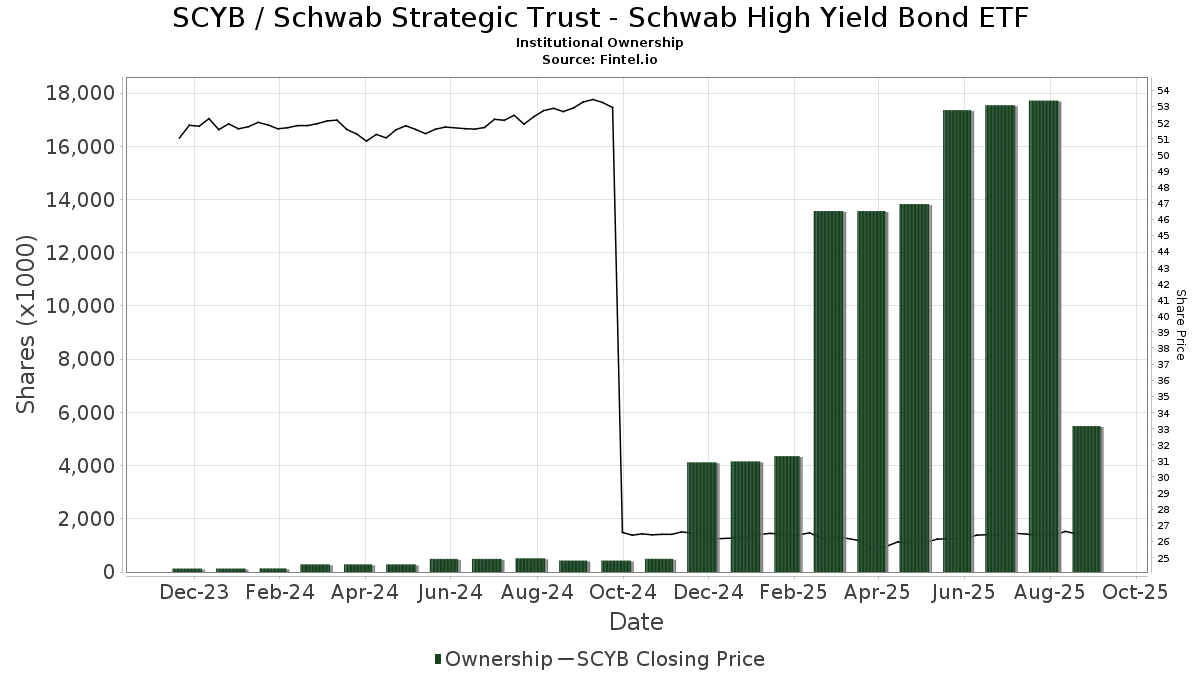
Institutional Owners 83 total, 83 long only, 0 short only, 0 long/short - change of 21.43% MRQ
Average Portfolio Allocation 0.7880 % - change of 405.20% MRQ
Institutional Shares (Long) 5,486,130 (ex 13D/G) - change of -11.87MM shares -68.40% MRQ
Institutional Value (Long) $ 143,528 USD ($1000)
Institutional Ownership and Shareholders

Schwab Strategic Trust - Schwab High Yield Bond ETF (US:SCYB) has 83 institutional owners and shareholders that have filed 13D/G or 13F forms with the Securities Exchange Commission (SEC). These institutions hold a total of 5,486,130 shares. Largest shareholders include RAA - SMI 3Fourteen Real Asset Allocation ETF SMI 3Fourteen REAL Asset Allocation ETF, Toroso Investments, LLC, Charles Schwab Trust Co, SWKRX - Schwab Monthly Income Fund - Enhanced Payout, Strategic Financial Planning, Inc., SWLRX - Schwab Monthly Income Fund - Maximum Payout, L2 Asset Management, LLC, SWJRX - Schwab Monthly Income Fund - Moderate Payout, Empowered Funds, LLC, and AGGA - Astoria Dynamic Core US Fixed Income ETF .

Schwab Strategic Trust - Schwab High Yield Bond ETF (ARCA:SCYB) institutional ownership structure shows current positions in the company by institutions and funds, as well as latest changes in position size. Major shareholders can include individual investors, mutual funds, hedge funds, or institutions. The Schedule 13D indicates that the investor holds (or held) more than 5% of the company and intends (or intended) to actively pursue a change in business strategy. Schedule 13G indicates a passive investment of over 5%.

The share price as of September 5, 2025 is 26.58 / share. Previously, on September 6, 2024, the share price was 26.38 / share. This represents an increase of 0.78% over that period.

SCYB / Schwab Strategic Trust - Schwab High Yield Bond ETF Institutional Ownership
Fund Sentiment Score

The Fund Sentiment Score (fka Ownership Accumulation Score) finds the stocks that are being most bought by funds. It is the result of a sophisticated, multi-factor quantitative model that identifies companies with the highest levels of institutional accumulation. The scoring model uses a combination of the total increase in disclosed owners, the changes in portfolio allocations in those owners and other metrics. The number ranges from 0 to 100, with higher numbers indicating a higher level of accumulation to its peers, and 50 being the average.

Update Frequency: Daily

See Ownership Explorer, which provides a list of highest-ranking companies.

Institutional Put/Call Ratio

In addition to reporting standard equity and debt issues, institutions with more than 100MM assets under management must also disclose their put and call option holdings. Since put options generally indicate negative sentiment, and call options indicate positive sentiment, we can get a sense of the overall institutional sentiment by plotting the ratio of puts to calls. The chart to the right plots the historical put/call ratio for this instrument.

Using Put/Call Ratio as an indicator of investor sentiment overcomes one of the key deficiencies of using total institutional ownership, which is that a significant amount of assets under management are invested passively to track indices. Passively-managed funds do not typically buy options, so the put/call ratio indicator more closely tracks the sentiment of actively-managed funds.

SCYB / Schwab Strategic Trust - Schwab High Yield Bond ETF Historical Put/Call Ratio
13F and NPORT Filings

Detail on 13F filings are free. Detail on NP filings require a premium membership. Green rows indicate new positions. Red rows indicate closed positions. Click the link icon to see the full transaction history.

Upgrade to unlock premium data and export to Excel .

File Date Source Investor Type Avg Price
(Est)
Shares Δ Shares
(%)
Reported
Value
($1000)
Δ Value
(%)
Port Alloc
(%)
2025-07-31 13F Cambridge Investment Research Advisors, Inc. 8,067 0
2025-08-06 13F First Horizon Advisors, Inc. 0 -100.00 0
2025-08-01 13F Integral Investment Advisors, Inc. 8,700 0.00 231 1.32
2025-08-05 13F Bank Of Montreal /can/ 157 0.00 4 0.00
2025-07-30 NP AGGA - Astoria Dynamic Core US Fixed Income ETF 144,233 3,776
2025-08-18 13F Geneos Wealth Management Inc. 0 -100.00 0 -100.00
2025-07-30 13F Bogart Wealth, LLC 28,006 -1.04 743 0.68
2025-08-14 13F Principia Wealth Advisory, LLC 25,532 678
2025-08-15 13F Captrust Financial Advisors 8,384 223
2025-08-13 13F Transce3nd, LLC 150 -48.81 4 -57.14
2025-08-14 13F Sunbelt Securities, Inc. 0 -100.00 0
2025-08-12 13F Howe & Rusling Inc 1,066 650.70 28 833.33
2025-08-05 13F Mma Asset Management Llc 47,539 1,262
2025-08-08 13F Cetera Investment Advisers 30,948 -82.52 821 -82.23
2025-08-14 13F Raymond James Financial Inc 289 8
2025-08-12 13F O'shaughnessy Asset Management, Llc 1 0.00 0
2025-08-06 13F Valued Wealth Advisors LLC 0 -100.00 0
2025-04-23 13F Mascagni Wealth Management, Inc. 0 -100.00 0
2025-08-12 13F Wealthbridge Capital Management, Llc 17,294 26.83 459 28.65
2025-08-13 13F JT Stratford LLC 43,540 4.02 1,156 5.77
2025-08-14 13F Bank Of America Corp /de/ 52,007 419.29 1,380 428.74
2025-08-04 13F L.m. Kohn & Company 0 -100.00 0
2025-07-09 13F Breakwater Investment Management 3,503 0.00 93 1.10
2025-07-17 13F Wolff Wiese Magana Llc 6 0
2025-08-11 13F Brown Brothers Harriman & Co 6 0
2025-07-30 13F Mid-American Wealth Advisory Group, Inc. 250 7
2025-08-06 13F Capasso Planning Partners LLC 26,072 -32.07 692 -31.04
2025-04-29 13F Sightline Wealth Advisors, LLC 0 -100.00 0
2025-05-12 13F C2P Capital Advisory Group, LLC d.b.a. Prosperity Capital Advisors 0 -100.00 0 -100.00
2025-08-14 13F Toroso Investments, LLC 1,647,085 65.60 43,450 67.32
2025-08-04 13F Creative Financial Designs Inc /adv 3,090 0.00 82 2.50
2025-08-22 13F/A TT Capital Management LLC 16,200 -5.81 430 -4.45
2025-08-12 13F Charles Schwab Investment Management Inc 0 -100.00 0
2025-08-25 NP SWKRX - Schwab Monthly Income Fund - Enhanced Payout This fund is a listed as child fund of Charles Schwab Investment Management Inc and if that institution has disclosed ownership in this security, then these positions will not be double counted when calculating total shares and total value 274,332 7,281
2025-08-08 13F Pnc Financial Services Group, Inc. 151 371.88 4
2025-09-04 13F/A Advisor Group Holdings, Inc. 7,579 15.06 201 17.54
2025-07-16 13F St Germain D J Co Inc 0 -100.00 0
2025-07-30 13F Forum Financial Management, LP 10,295 7.12 273 9.20
2025-08-13 13F Strategic Financial Planning, Inc. 215,009 5,706
2025-08-14 13F Mariner, LLC 12,652 336
2025-07-31 13F Buckingham Strategic Partners 25,677 681
2025-08-05 13F iA Global Asset Management Inc. 36,400 -88.20 1 -100.00
2025-06-30 NP SMILX - SMI 50/40/10 Fund 49,270 1,280
2025-08-14 13F Old Mission Capital Llc 7,562 201
2025-08-08 13F Hartland & Co., LLC 104 0.00 3 0.00
2025-08-01 13F Envestnet Asset Management Inc 0 -100.00 0
2025-08-14 13F GWM Advisors LLC 304 8
2025-08-12 13F BlackRock, Inc. 551 15
2025-07-17 13F Sound Income Strategies, LLC 16 0.00 0
2025-07-09 13F Keystone Wealth Services, LLC 0 -100.00 0
2025-07-29 13F Mb, Levis & Associates, Llc 10,496 1.67 279 3.35
2025-08-11 13F Aptus Capital Advisors, LLC 17 0
2025-08-25 NP SWJRX - Schwab Monthly Income Fund - Moderate Payout This fund is a listed as child fund of Charles Schwab Investment Management Inc and if that institution has disclosed ownership in this security, then these positions will not be double counted when calculating total shares and total value 170,683 4,530
2025-07-14 13F Armstrong Advisory Group, Inc 0 -100.00 0
2025-08-14 13F Ausdal Financial Partners, Inc. 18,762 -7.29 498 -5.87
2025-08-14 13F Wells Fargo & Company/mn 0 -100.00 0 -100.00
2025-07-28 13F Harbour Investments, Inc. 13,240 2,441.27 351 2,600.00
2025-08-14 13F Jane Street Group, Llc 0 -100.00 0
2025-07-08 13F/A Salem Investment Counselors Inc 6,868 0.00 182 1.68
2025-05-15 13F Windsor Advisory Group, LLC 0 -100.00 0
2025-07-17 13F Charles Schwab Trust Co 384,155 189.75 10,195 194.57
2025-08-13 13F Northwestern Mutual Wealth Management Co 192 -30.69 5 -28.57
2025-07-25 13F Cwm, Llc 2,162 -2.13 0
2025-07-24 13F IFP Advisors, Inc 3,088 -37.89 82 -37.21
2025-08-04 13F Joseph P. Lucia & Associates, LLC 18,491 491
2025-08-12 13F Proequities, Inc. 0 0
2025-08-14 13F CoreCap Advisors, LLC 1,354 204.27 36 218.18
2025-08-14 13F Citadel Advisors Llc 14,695 390
2025-05-09 13F Goldman Sachs Group Inc 0 -100.00 0
2025-07-24 13F Ronald Blue Trust, Inc. 3,075 0.00 82 1.25
2025-05-12 13F Kohmann Bosshard Financial Services, LLC 0 -100.00 0
2025-07-25 13F NorthRock Partners, LLC 330 1.85 9 0.00
2025-07-23 13F Columbus Macro, LLC 0 -100.00 0
2025-07-15 13F Financial Management Professionals, Inc. 14 0.00 0
2025-07-16 13F Signaturefd, Llc 17 0.00 0
2025-08-12 13F Coldstream Capital Management Inc 0 -100.00 0
2025-08-12 13F SRS Capital Advisors, Inc. 1,271 34
2025-08-14 13F Mercer Global Advisors Inc /adv 15,888 56.50 422 58.87
2025-08-07 13F Allworth Financial LP 42 -19.23 1 0.00
2025-08-06 13F AE Wealth Management LLC 19 -98.13 1 -100.00
2025-08-08 13F Larson Financial Group LLC 1,547 38.87 41 41.38
2025-08-11 13F Empowered Funds, LLC 158,753 4,188
2025-08-13 13F Jones Financial Companies Lllp 156 4
2025-08-04 13F Pensionmark Financial Group, Llc 39,092 43.19 1,038 45.65
2025-07-07 13F OMNI 360 Wealth, Inc. 25,187 668
2025-07-29 13F Ballast, Inc. 18,491 491
2025-08-04 13F Assetmark, Inc 49 1
2025-08-14 13F Royal Bank Of Canada 27 3.85 1
2025-08-04 13F Evergreen Advisors, LLC 22,000 584
2025-05-14 13F CIBC Private Wealth Group, LLC 0 -100.00 0
2025-07-31 13F Moser Wealth Advisors, LLC 73 2
2025-08-06 13F Golden State Wealth Management, LLC 770 0.00 20 0.00
2025-08-14 13F Fmr Llc 927 -1.17 25 0.00
2025-08-29 NP RAA - SMI 3Fourteen Real Asset Allocation ETF SMI 3Fourteen REAL Asset Allocation ETF 1,850,001 77.08 49,099 80.00
2025-08-14 13F L2 Asset Management, LLC 188,111 5.55 4,992 7.29
2025-07-22 13F WJ Interests, LLC 11,215 0.00 298 1.71
2025-08-15 13F Morgan Stanley 85 347.37 2
2025-07-10 13F Focus Financial Network, Inc. 27,456 -60.55 729 -59.93
2025-07-11 13F Farther Finance Advisors, LLC 9,786 163,000.00 260
2025-08-14 13F UBS Group AG 0 -100.00 0
2025-04-14 13F Wedmont Private Capital 0 -100.00 0
2025-07-24 13F Rice Partnership, LLC 0 -100.00 0
2025-05-14 13F Huntington National Bank 0
2025-07-23 13F Hager Investment Management Services, Llc 0 -100.00 0
2025-08-13 13F Flow Traders U.s. Llc 13,178 0
2025-08-12 13F Peachtree Investment Partners, LLC 330 1.85 9 0.00
2025-08-25 NP SWLRX - Schwab Monthly Income Fund - Maximum Payout This fund is a listed as child fund of Charles Schwab Investment Management Inc and if that institution has disclosed ownership in this security, then these positions will not be double counted when calculating total shares and total value 204,312 5,422
2025-07-14 13F Legacy Capital Group California, Inc. 0 -100.00 0
2025-08-11 13F HighTower Advisors, LLC 0 -100.00 0
2025-08-05 13F Tsfg, Llc 100 0
2025-07-30 13F Brookstone Capital Management 10,345 7.94 275 9.60
2025-06-30 NP SMIDX - SMI Dynamic Allocation Fund 136,580 3,547
Fintel data has been cited in the following publications:
Daily Mail Fox Business Business Insider Wall Street Journal The Washington Post Bloomberg Financial Times Globe and Mail
NASDAQ.com Reuters The Guardian Associated Press FactCheck.org Snopes Politifact
Federal Register The Intercept Forbes Fortune Magazine TheStreet Time Magazine Canadian Broadcasting Corporation International Business Times
Cambridge University Press Investopedia MarketWatch NY Daily News Entrepreneur Newsweek Barron's El Economista