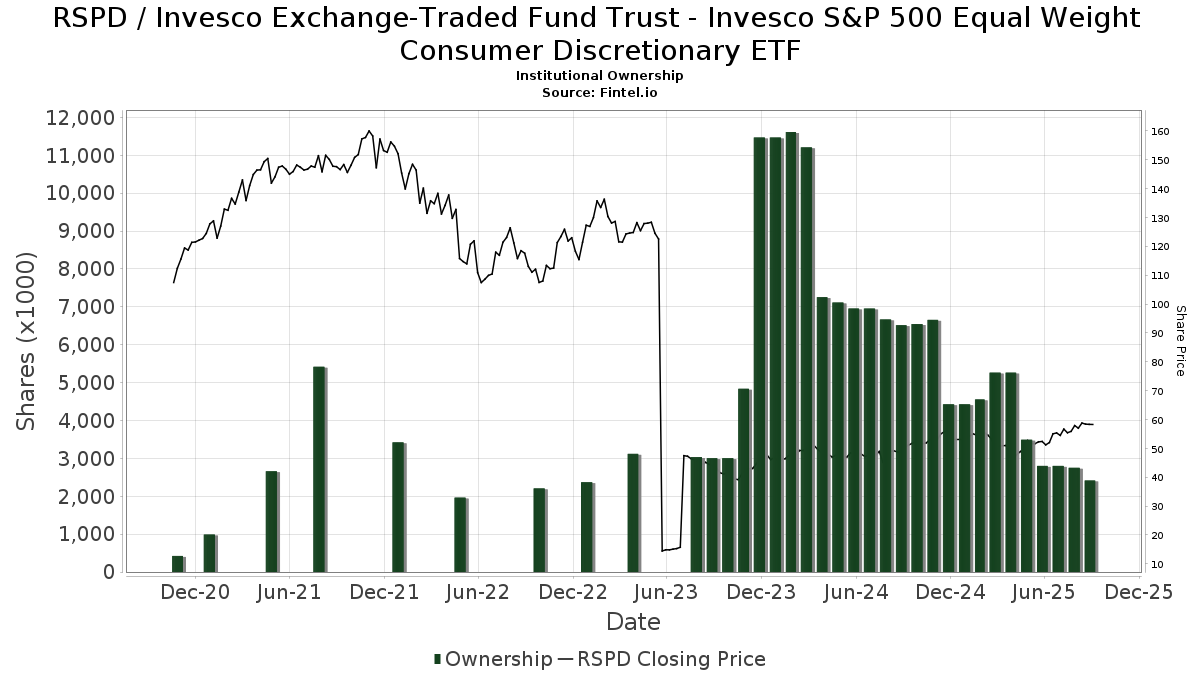
Basic Stats
| Institutional Owners | 85 total, 85 long only, 0 short only, 0 long/short - change of -3.33% MRQ |
| Average Portfolio Allocation | 0.1769 % - change of -16.72% MRQ |
| Institutional Shares (Long) | 2,424,838 (ex 13D/G) - change of -0.38MM shares -13.45% MRQ |
| Institutional Value (Long) | $ 90,468 USD ($1000) |
Institutional Ownership and Shareholders
Invesco Exchange-Traded Fund Trust - Invesco S&P 500 Equal Weight Consumer Discretionary ETF (US:RSPD) has 85 institutional owners and shareholders that have filed 13D/G or 13F forms with the Securities Exchange Commission (SEC). These institutions hold a total of 2,424,838 shares. Largest shareholders include Harel Insurance Investments & Financial Services Ltd., Raymond James Financial Inc, Strategic Wealth Partners, Ltd., HighTower Advisors, LLC, Legend Financial Advisors, Inc., LPL Financial LLC, Royal Bank Of Canada, Wells Fargo & Company/mn, Park Avenue Securities Llc, and Bank Of America Corp /de/ .
Invesco Exchange-Traded Fund Trust - Invesco S&P 500 Equal Weight Consumer Discretionary ETF (ARCA:RSPD) institutional ownership structure shows current positions in the company by institutions and funds, as well as latest changes in position size. Major shareholders can include individual investors, mutual funds, hedge funds, or institutions. The Schedule 13D indicates that the investor holds (or held) more than 5% of the company and intends (or intended) to actively pursue a change in business strategy. Schedule 13G indicates a passive investment of over 5%.
The share price as of September 5, 2025 is 58.92 / share. Previously, on September 9, 2024, the share price was 48.55 / share. This represents an increase of 21.36% over that period.
Fund Sentiment Score
The Fund Sentiment Score (fka Ownership Accumulation Score) finds the stocks that are being most bought by funds. It is the result of a sophisticated, multi-factor quantitative model that identifies companies with the highest levels of institutional accumulation. The scoring model uses a combination of the total increase in disclosed owners, the changes in portfolio allocations in those owners and other metrics. The number ranges from 0 to 100, with higher numbers indicating a higher level of accumulation to its peers, and 50 being the average.
Update Frequency: Daily
See Ownership Explorer, which provides a list of highest-ranking companies.
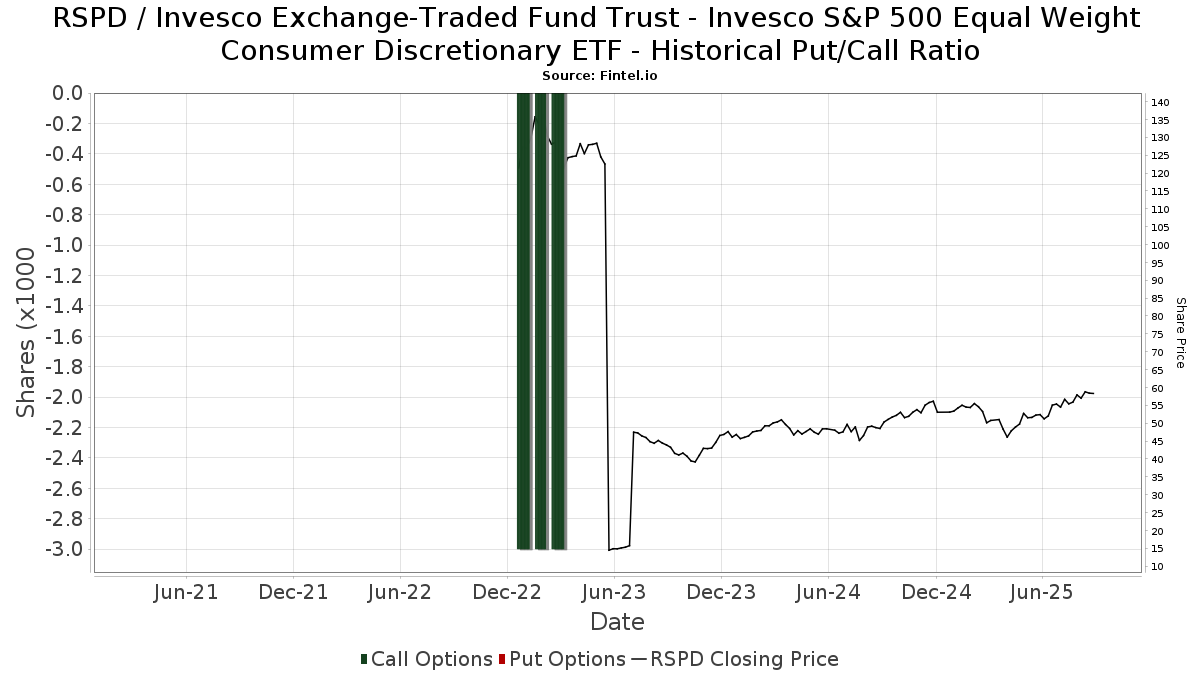
Institutional Put/Call Ratio
In addition to reporting standard equity and debt issues, institutions with more than 100MM assets under management must also disclose their put and call option holdings. Since put options generally indicate negative sentiment, and call options indicate positive sentiment, we can get a sense of the overall institutional sentiment by plotting the ratio of puts to calls. The chart to the right plots the historical put/call ratio for this instrument.
Using Put/Call Ratio as an indicator of investor sentiment overcomes one of the key deficiencies of using total institutional ownership, which is that a significant amount of assets under management are invested passively to track indices. Passively-managed funds do not typically buy options, so the put/call ratio indicator more closely tracks the sentiment of actively-managed funds.
13F and NPORT Filings
Detail on 13F filings are free. Detail on NP filings require a premium membership. Green rows indicate new positions. Red rows indicate closed positions. Click the link icon to see the full transaction history.
Upgrade
to unlock premium data and export to Excel ![]() .
.
| File Date | Source | Investor | Type | Avg Price (Est) |
Shares | Δ Shares (%) |
Reported Value ($1000) |
Δ Value (%) |
Port Alloc (%) |
|
|---|---|---|---|---|---|---|---|---|---|---|
| 2025-08-13 | 13F | Scotia Capital Inc. | 51,552 | 21.36 | 2,743 | 29.45 | ||||
| 2025-08-14 | 13F | Great Valley Advisor Group, Inc. | 6,487 | 0.06 | 345 | 6.50 | ||||
| 2025-08-05 | 13F | Harel Insurance Investments & Financial Services Ltd. | 645,873 | 27.31 | 34 | 36.00 | ||||
| 2025-07-29 | 13F | Tradewinds Capital Management, LLC | 3,306 | 0.39 | 176 | 6.71 | ||||
| 2025-08-11 | 13F | Strategic Wealth Partners, Ltd. | 134,724 | 4.73 | 7,169 | 1.01 | ||||
| 2025-08-06 | 13F | Hallmark Capital Management Inc | 0 | -100.00 | 0 | |||||
| 2025-08-11 | 13F | HighTower Advisors, LLC | 129,828 | -1.60 | 6,908 | 4.94 | ||||
| 2025-08-14 | 13F | Bnp Paribas Arbitrage, Sa | 10,000 | 532 | ||||||
| 2025-08-08 | 13F | Financial Gravity Companies, Inc. | 123 | -12.14 | 7 | -14.29 | ||||
| 2025-08-14 | 13F | Comerica Bank | 891 | 0.00 | 47 | 6.82 | ||||
| 2025-08-12 | 13F | LPL Financial LLC | 109,305 | -12.50 | 5,816 | -6.69 | ||||
| 2025-08-26 | NP | LCR - Leuthold Core ETF | 22,137 | 2.55 | 1,178 | 9.29 | ||||
| 2025-05-12 | 13F | Independent Advisor Alliance | 0 | -100.00 | 0 | |||||
| 2025-07-16 | 13F/A | CX Institutional | 100 | -3.85 | 0 | |||||
| 2025-08-06 | 13F | Richard Bernstein Advisors LLC | 826 | -50.89 | 44 | -48.19 | ||||
| 2025-07-28 | 13F | Kiker Wealth Management, LLC | 0 | -100.00 | 0 | |||||
| 2025-08-11 | 13F | Private Advisor Group, LLC | 15,772 | -24.62 | 839 | -19.64 | ||||
| 2025-08-12 | 13F | O'shaughnessy Asset Management, Llc | 109 | -33.13 | 6 | -37.50 | ||||
| 2025-07-31 | 13F | Brian Low Financial Group, Llc | 12,533 | 667 | ||||||
| 2025-05-09 | 13F | Connable Office Inc | 0 | -100.00 | 0 | |||||
| 2025-08-14 | 13F | Goldman Sachs Group Inc | 37,914 | -23.41 | 2,017 | -18.34 | ||||
| 2025-07-23 | 13F | Friedenthal Financial | 26,306 | 2.66 | 1,400 | 9.47 | ||||
| 2025-08-07 | 13F/A | Joseph Group Capital Management | 0 | -100.00 | 0 | |||||
| 2025-08-12 | 13F | Steward Partners Investment Advisory, Llc | 166 | 0.61 | 9 | 0.00 | ||||
| 2025-05-15 | 13F | Glenmede Trust Co Na | 1,350 | 0.00 | 67 | -6.94 | ||||
| 2025-07-08 | 13F | Legacy Private Trust Co. | 31,476 | -10.86 | 1,675 | -4.94 | ||||
| 2025-07-22 | 13F | Valley National Advisers Inc | 245 | 0.00 | 0 | |||||
| 2025-08-06 | 13F | Commonwealth Equity Services, Llc | 4,889 | -5.14 | 0 | |||||
| 2025-08-14 | 13F | UBS Group AG | 36,626 | -23.94 | 1,949 | -18.90 | ||||
| 2025-08-14 | 13F | Susquehanna International Group, Llp | 0 | -100.00 | 0 | |||||
| 2025-08-12 | 13F | TCTC Holdings, LLC | 231 | 0.00 | 12 | 9.09 | ||||
| 2025-08-14 | 13F | Vista Investment Management | 31,698 | -0.25 | 1,687 | 6.37 | ||||
| 2025-08-14 | 13F | CoreCap Advisors, LLC | 6,689 | -97.81 | 356 | -97.67 | ||||
| 2025-08-12 | 13F | Proequities, Inc. | 0 | 0 | ||||||
| 2025-08-08 | 13F | Hartland & Co., LLC | 540 | 0.00 | 29 | 7.69 | ||||
| 2025-08-12 | 13F | AlphaCore Capital LLC | 90 | 0.00 | 5 | 0.00 | ||||
| 2025-07-14 | 13F | ABLE Financial Group, LLC | 0 | -100.00 | 0 | |||||
| 2025-08-15 | 13F | Tower Research Capital LLC (TRC) | 1,900 | -65.35 | 101 | -63.00 | ||||
| 2025-05-15 | 13F | Hilltop Holdings Inc. | 0 | -100.00 | 0 | |||||
| 2025-08-14 | 13F | Bank Of America Corp /de/ | 57,956 | 10.81 | 3,084 | 18.17 | ||||
| 2025-08-14 | 13F | Quantinno Capital Management LP | 6,733 | 358 | ||||||
| 2025-08-14 | 13F | Wells Fargo & Company/mn | 96,472 | -17.77 | 5,133 | -12.32 | ||||
| 2025-07-08 | 13F | Davis Investment Partners, LLC | 28,049 | -13.26 | 1,531 | 0.33 | ||||
| 2025-08-14 | 13F | GWM Advisors LLC | 6,006 | -93.16 | 320 | -92.72 | ||||
| 2025-07-22 | 13F | Yoder Wealth Management, Inc. | 32,451 | 7.80 | 1,727 | 14.91 | ||||
| 2025-08-13 | 13F | Northwestern Mutual Wealth Management Co | 92 | 0.00 | 5 | 0.00 | ||||
| 2025-08-18 | 13F/A | National Bank Of Canada /fi/ | 339 | -59.11 | 18 | -56.10 | ||||
| 2025-07-15 | 13F | MCF Advisors LLC | 141 | 0.00 | 8 | 0.00 | ||||
| 2025-07-11 | 13F | Farther Finance Advisors, LLC | 56,195 | -0.66 | 2,990 | 5.32 | ||||
| 2025-07-29 | 13F | Empirical Asset Management, LLC | 5,116 | -5.43 | 272 | 1.12 | ||||
| 2025-09-04 | 13F/A | Advisor Group Holdings, Inc. | 3,194 | -0.22 | 170 | 6.92 | ||||
| 2025-04-22 | 13F | Cambridge Investment Research Advisors, Inc. | 0 | -100.00 | 0 | |||||
| 2025-04-30 | 13F | Sofos Investments, Inc. | 140 | 366.67 | 7 | 500.00 | ||||
| 2025-08-13 | 13F | Lido Advisors, LLC | 10,302 | -5.23 | 548 | 1.11 | ||||
| 2025-08-14 | 13F | Royal Bank Of Canada | 100,667 | 346.95 | 5,357 | 376.60 | ||||
| 2025-07-16 | 13F | Legend Financial Advisors, Inc. | 128,526 | 0.38 | 6,839 | 7.03 | ||||
| 2025-05-14 | 13F | Flow Traders U.s. Llc | 0 | -100.00 | 0 | |||||
| 2025-08-01 | 13F | Envestnet Asset Management Inc | 6,350 | -62.35 | 338 | -59.93 | ||||
| 2025-04-09 | 13F | Worth Asset Management, LLC | 0 | -100.00 | 0 | -100.00 | ||||
| 2025-04-21 | 13F | Nelson, Van Denburg & Campbell Wealth Management Group, LLC | 0 | -100.00 | 0 | |||||
| 2025-07-14 | 13F | Park Avenue Securities Llc | 68,498 | 4 | ||||||
| 2025-04-28 | 13F | Strategic Financial Concepts, LLC | 0 | -100.00 | 0 | -100.00 | ||||
| 2025-08-12 | 13F | CIBC Private Wealth Group, LLC | 0 | -100.00 | 0 | -100.00 | ||||
| 2025-05-12 | 13F | Waterloo Capital, L.P. | 0 | -100.00 | 0 | |||||
| 2025-08-07 | 13F | Allworth Financial LP | 602 | 0.33 | 32 | 10.34 | ||||
| 2025-08-07 | 13F | Strategy Asset Managers Llc | 0 | -100.00 | 0 | |||||
| 2025-08-14 | 13F | Raymond James Financial Inc | 142,153 | 9.40 | 7,564 | 16.66 | ||||
| 2025-07-24 | 13F | Trust Co Of Toledo Na /oh/ | 17 | 1 | ||||||
| 2025-08-05 | 13F | Bank Of Montreal /can/ | 1,895 | 0.00 | 101 | 6.38 | ||||
| 2025-08-13 | 13F | Leuthold Group, Llc | 23,805 | 2.67 | 1,267 | 9.52 | ||||
| 2025-08-14 | 13F | Smartleaf Asset Management LLC | 0 | -100.00 | 0 | |||||
| 2025-03-21 | 13F | Prostatis Group LLC | 0 | -100.00 | 0 | |||||
| 2025-08-14 | 13F | Fmr Llc | 271 | -0.37 | 14 | 7.69 | ||||
| 2025-08-15 | 13F | Morgan Stanley | 40,514 | -1.27 | 2,156 | 5.28 | ||||
| 2025-08-19 | 13F | Advisory Services Network, LLC | 10,931 | 0.00 | 601 | 10.28 | ||||
| 2025-08-12 | 13F | Global Retirement Partners, LLC | 2,674 | 0.07 | 142 | 0.00 | ||||
| 2025-07-24 | 13F | Us Bancorp \de\ | 507 | -14.93 | 27 | -10.34 | ||||
| 2025-07-29 | 13F | Private Trust Co Na | 3,072 | -26.06 | 163 | -21.26 | ||||
| 2025-08-05 | 13F | Simplex Trading, Llc | 214 | 21,300.00 | 0 | |||||
| 2025-05-13 | 13F | Adams Wealth Management | 0 | -100.00 | 0 | |||||
| 2025-08-12 | 13F | Jpmorgan Chase & Co | 52,165 | -0.05 | 2,776 | 6.57 | ||||
| 2025-08-04 | 13F | Joseph P. Lucia & Associates, LLC | 24,048 | -1.29 | 1,280 | 5.27 | ||||
| 2025-04-25 | NP | SRGAX - Stringer Growth Fund Class A Shares | 8,446 | -19.91 | 459 | -70.60 | ||||
| 2025-08-14 | 13F | Warren Averett Asset Management, LLC | 3,922 | 209 | ||||||
| 2025-07-31 | 13F | Brinker Capital Investments, LLC | 0 | -100.00 | 0 | -100.00 | ||||
| 2025-07-30 | 13F | Eqis Capital Management, Inc. | 8,599 | -2.32 | 458 | 4.10 | ||||
| 2025-07-31 | 13F | Carnegie Capital Asset Management, LLC | 29,352 | -4.38 | 1,562 | 12.55 | ||||
| 2025-04-15 | 13F | Collier Financial | 2,737 | 0.00 | 137 | -6.85 | ||||
| 2025-08-04 | 13F | Pinnacle Associates Ltd | 23,715 | -1.25 | 1,262 | 5.26 | ||||
| 2025-08-13 | 13F | Jones Financial Companies Lllp | 2,915 | 40.82 | 155 | 50.98 | ||||
| 2025-08-15 | 13F | CI Private Wealth, LLC | 5,143 | 0.00 | 274 | 6.64 | ||||
| 2025-04-17 | 13F | Janney Montgomery Scott LLC | 0 | -100.00 | 0 | |||||
| 2025-07-17 | 13F | Walker Asset Management, LLC | 20,083 | -3.68 | 1,069 | 2.69 | ||||
| 2025-08-18 | 13F | Front Row Advisors LLC | 225 | 0.00 | 12 | 0.00 | ||||
| 2025-07-17 | 13F | Sound Income Strategies, LLC | 10 | 0.00 | 1 | |||||
| 2025-08-05 | 13F | Fourth Dimension Wealth, LLC | 105 | 0.00 | 6 | 0.00 | ||||
| 2025-08-14 | 13F | Sunbelt Securities, Inc. | 111 | 6 | ||||||
| 2025-07-08 | 13F | Madison Park Capital Advisors, LLC | 9,267 | -51.15 | 493 | -47.89 | ||||
| 2025-04-25 | 13F | Verity Asset Management, Inc. | 0 | -100.00 | 0 | |||||
| 2025-08-13 | 13F | Green Harvest Asset Management LLC | 9,521 | -8.53 | 507 | -2.50 | ||||
| 2025-08-14 | 13F | Stifel Financial Corp | 4,356 | -7.14 | 232 | -1.28 | ||||
| 2025-08-01 | 13F | James Investment Research Inc | 4,454 | -4.93 | 237 | 1.29 | ||||
| 2025-07-29 | 13F | Ballast, Inc. | 24,048 | 1,280 | ||||||
| 2025-07-07 | 13F | Thurston, Springer, Miller, Herd & Titak, Inc. | 270 | 0.00 | 14 | 7.69 | ||||
| 2025-04-09 | 13F | Nbc Securities, Inc. | 0 | -100.00 | 0 | |||||
| 2025-05-15 | 13F | Blue Chip Partners, Inc. | 0 | -100.00 | 0 | |||||
| 2025-08-14 | 13F | Glenmede Investment Management, LP | 1,350 | 72 | ||||||
| 2025-05-13 | 13F | CacheTech Inc. | 0 | -100.00 | 0 | |||||
| 2025-08-07 | 13F | Winthrop Capital Management, LLC | 5,694 | -89.65 | 0 | -100.00 | ||||
| 2025-08-08 | 13F | Gts Securities Llc | 0 | -100.00 | 0 | |||||
| 2025-08-14 | 13F | Citadel Advisors Llc | 21,132 | -32.88 | 1,124 | -28.45 | ||||
| 2025-08-05 | 13F | Huntington National Bank | 5 | -42.86 | ||||||
| 2025-08-14 | 13F | Ameriprise Financial Inc | 5,602 | -74.41 | 298 | -72.74 |