Basic Stats
| Institutional Owners | 140 total, 140 long only, 0 short only, 0 long/short - change of 9.38% MRQ |
| Average Portfolio Allocation | 0.8982 % - change of 6.33% MRQ |
| Institutional Shares (Long) | 84,146,344 (ex 13D/G) - change of 28.04MM shares 49.97% MRQ |
| Institutional Value (Long) | $ 2,954,896 USD ($1000) |
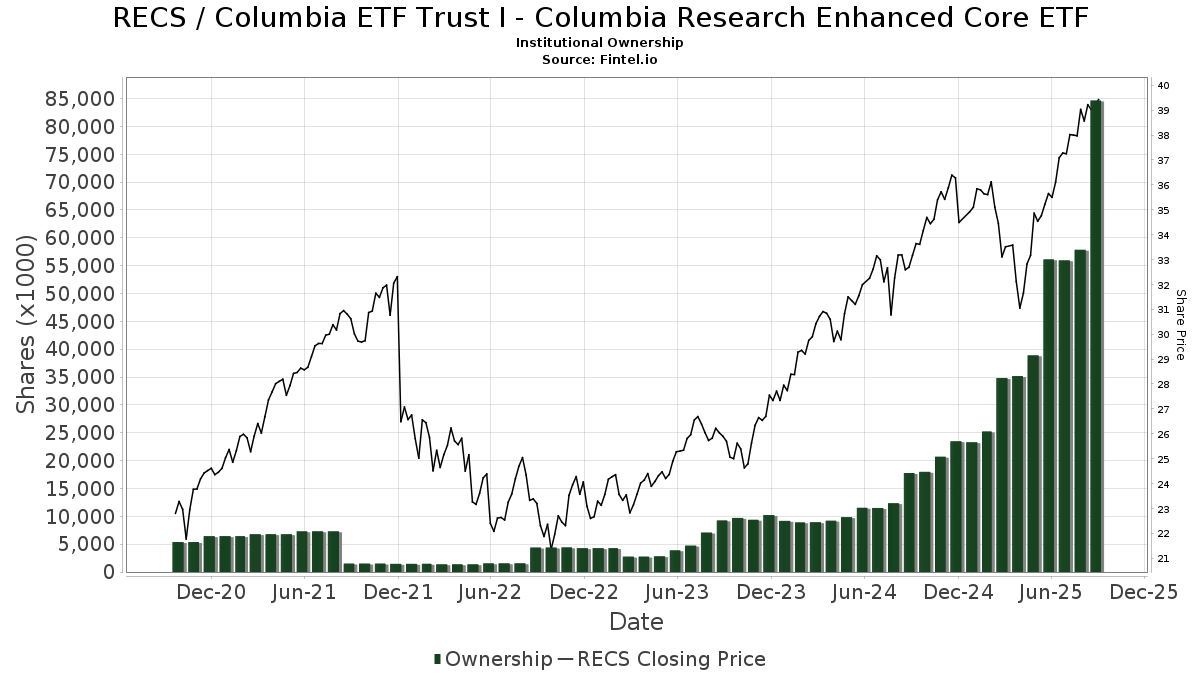
Institutional Ownership and Shareholders
Columbia ETF Trust I - Columbia Research Enhanced Core ETF (US:RECS) has 140 institutional owners and shareholders that have filed 13D/G or 13F forms with the Securities Exchange Commission (SEC). These institutions hold a total of 84,146,344 shares. Largest shareholders include Jane Street Group, Llc, Ameriprise Financial Inc, LPL Financial LLC, Bank Of America Corp /de/, Morgan Stanley, Raymond James Financial Inc, CTFAX - Columbia Thermostat Fund Class A, Commonwealth Equity Services, Llc, Gradient Investments LLC, and Fundamentun, Llc .
Columbia ETF Trust I - Columbia Research Enhanced Core ETF (ARCA:RECS) institutional ownership structure shows current positions in the company by institutions and funds, as well as latest changes in position size. Major shareholders can include individual investors, mutual funds, hedge funds, or institutions. The Schedule 13D indicates that the investor holds (or held) more than 5% of the company and intends (or intended) to actively pursue a change in business strategy. Schedule 13G indicates a passive investment of over 5%.
The share price as of September 3, 2025 is 39.00 / share. Previously, on September 4, 2024, the share price was 32.59 / share. This represents an increase of 19.68% over that period.
Fund Sentiment Score
The Fund Sentiment Score (fka Ownership Accumulation Score) finds the stocks that are being most bought by funds. It is the result of a sophisticated, multi-factor quantitative model that identifies companies with the highest levels of institutional accumulation. The scoring model uses a combination of the total increase in disclosed owners, the changes in portfolio allocations in those owners and other metrics. The number ranges from 0 to 100, with higher numbers indicating a higher level of accumulation to its peers, and 50 being the average.
Update Frequency: Daily
See Ownership Explorer, which provides a list of highest-ranking companies.
Institutional Put/Call Ratio
In addition to reporting standard equity and debt issues, institutions with more than 100MM assets under management must also disclose their put and call option holdings. Since put options generally indicate negative sentiment, and call options indicate positive sentiment, we can get a sense of the overall institutional sentiment by plotting the ratio of puts to calls. The chart to the right plots the historical put/call ratio for this instrument.
Using Put/Call Ratio as an indicator of investor sentiment overcomes one of the key deficiencies of using total institutional ownership, which is that a significant amount of assets under management are invested passively to track indices. Passively-managed funds do not typically buy options, so the put/call ratio indicator more closely tracks the sentiment of actively-managed funds.
13F and NPORT Filings
Detail on 13F filings are free. Detail on NP filings require a premium membership. Green rows indicate new positions. Red rows indicate closed positions. Click the link icon to see the full transaction history.
Upgrade
to unlock premium data and export to Excel ![]() .
.
| File Date | Source | Investor | Type | Avg Price (Est) |
Shares | Δ Shares (%) |
Reported Value ($1000) |
Δ Value (%) |
Port Alloc (%) |
|
|---|---|---|---|---|---|---|---|---|---|---|
| 2025-07-29 | 13F | Stratos Wealth Partners, LTD. | 1,511,634 | -1.17 | 55,613 | 9.48 | ||||
| 2025-08-12 | 13F | Jpmorgan Chase & Co | 685,926 | 8.83 | 25,235 | 20.56 | ||||
| 2025-08-14 | 13F | Great Valley Advisor Group, Inc. | 14,303 | -91.10 | 526 | -90.14 | ||||
| 2025-07-23 | 13F | Heck Capital Advisors, LLC | 461,922 | 16,994 | ||||||
| 2025-07-29 | 13F | Fundamentun, Llc | 1,978,098 | 4.39 | 72,774 | 15.64 | ||||
| 2025-08-13 | 13F | Northwestern Mutual Wealth Management Co | 110,244 | -46.99 | 4,056 | -41.28 | ||||
| 2025-08-14 | 13F | Royal Bank Of Canada | 477,034 | -16.81 | 17,551 | -7.83 | ||||
| 2025-08-14 | 13F | LM Advisors LLC | 40,568 | 2.56 | 1 | 0.00 | ||||
| 2025-08-14 | 13F | Bank Of America Corp /de/ | 4,425,196 | -10.10 | 162,803 | -0.40 | ||||
| 2025-07-17 | 13F | Janney Montgomery Scott LLC | 18,761 | 51.27 | 1 | |||||
| 2025-07-25 | 13F | Retirement Planning Group, Llc / Ny | 90,043 | 41.28 | 3,313 | 56.52 | ||||
| 2025-08-14 | 13F | Jane Street Group, Llc | 16,658,312 | 49,303.34 | 612,859 | 54,668.45 | ||||
| 2025-07-23 | 13F | Morey & Quinn Wealth Partners, LLC | 19,785 | 26.95 | 728 | 40.62 | ||||
| 2025-07-02 | 13F | Capital Market Strategies LLC | 10,558 | 388 | ||||||
| 2025-07-09 | 13F | WealthCare Investment Partners, LLC | 23,778 | 15.46 | 889 | 41.85 | ||||
| 2025-08-12 | 13F | Richmond Investment Services, LLC | 68,148 | 102.91 | 2,507 | 124.84 | ||||
| 2025-08-14 | 13F | Mml Investors Services, Llc | 374,045 | 6.36 | 14 | 18.18 | ||||
| 2025-08-04 | 13F | Amplius Wealth Advisors, LLC | 1,533,039 | 1.36 | 56,396 | 12.27 | ||||
| 2025-08-08 | 13F | Cetera Investment Advisers | 258,054 | -24.01 | 9,494 | -15.82 | ||||
| 2025-08-14 | 13F | Comerica Bank | 4,737 | -26.38 | 174 | -18.31 | ||||
| 2025-08-08 | 13F | Avantax Advisory Services, Inc. | 220,971 | 173.50 | 8,130 | 202.98 | ||||
| 2025-07-29 | 13F | Stratos Wealth Advisors, LLC | 8,856 | 326 | ||||||
| 2025-08-13 | 13F | MONECO Advisors, LLC | 5,921 | -6.24 | 218 | 3.83 | ||||
| 2025-08-08 | 13F | Comprehensive Financial Planning, Inc./PA | 1,007 | -6.33 | 37 | 5.71 | ||||
| 2025-08-07 | 13F | Fidelis Capital Partners, LLC | 49,943 | 1,896 | ||||||
| 2025-08-22 | NP | CTFAX - Columbia Thermostat Fund Class A | 2,732,920 | 125.79 | 100,544 | 150.13 | ||||
| 2025-07-21 | 13F | Ameritas Advisory Services, LLC | 70,820 | 102.04 | 2,605 | 115.82 | ||||
| 2025-07-21 | 13F | DHJJ Financial Advisors, Ltd. | 5 | 0.00 | 0 | |||||
| 2025-07-29 | 13F | Empirical Asset Management, LLC | 69,125 | 1.37 | 2,543 | 12.32 | ||||
| 2025-08-14 | 13F | Wiley Bros.-aintree Capital, Llc | 20,580 | 13.53 | 757 | 26.59 | ||||
| 2025-08-14 | 13F | Graney & King, LLC | 5,447 | 444.70 | 200 | 506.06 | ||||
| 2025-08-14 | 13F | Byrne Financial Freedom, Llc | 73,933 | 328.75 | 2,720 | 375.35 | ||||
| 2025-08-06 | 13F | Commonwealth Equity Services, Llc | 2,517,266 | 77.26 | 93 | 95.74 | ||||
| 2025-08-13 | 13F | Dana Investment Advisors, Inc. | 18,951 | 63.55 | 697 | 81.51 | ||||
| 2025-08-18 | 13F | Tyler-Stone Wealth Management | 10,264 | 0.98 | 378 | 11.87 | ||||
| 2025-07-17 | 13F | Archford Capital Strategies, LLC | 269,439 | 2.56 | 9,913 | 13.60 | ||||
| 2025-08-04 | 13F | Assetmark, Inc | 117 | 4 | ||||||
| 2025-07-18 | 13F | Truist Financial Corp | 8,231 | 30.82 | 303 | 45.19 | ||||
| 2025-07-23 | 13F | RiverTree Advisors, LLC | 8,180 | -5.92 | 301 | 4.17 | ||||
| 2025-08-06 | 13F | Mark Sheptoff Financial Planning, Llc | 385 | 0.00 | 14 | 16.67 | ||||
| 2025-08-05 | 13F | Scarborough Advisors, LLC | 567,951 | 30.34 | 20,895 | 44.39 | ||||
| 2025-08-04 | 13F | Daymark Wealth Partners, Llc | 720,517 | 14.10 | 26,508 | 26.40 | ||||
| 2025-08-11 | 13F | Trajan Wealth LLC | 555,620 | 0.12 | 20,441 | 10.92 | ||||
| 2025-08-05 | 13F | Snider Financial Group | 123,818 | 4,555 | ||||||
| 2025-08-13 | 13F | Balance Wealth, LLC | 54,725 | -81.88 | 2,013 | -79.93 | ||||
| 2025-07-15 | 13F | Palumbo Wealth Management LLC | 11,916 | 438 | ||||||
| 2025-07-30 | 13F | Bogart Wealth, LLC | 196,458 | 7.83 | 7,228 | 19.45 | ||||
| 2025-08-14 | 13F | Atomi Financial Group, Inc. | 7,061 | 260 | ||||||
| 2025-08-11 | 13F | Citigroup Inc | 65,065 | 1,517.73 | 2,394 | 1,699.25 | ||||
| 2025-07-23 | 13F | Drake & Associates, LLC | 840,273 | 4.37 | 30,914 | 15.61 | ||||
| 2025-08-19 | 13F | Advisory Services Network, LLC | 63,469 | 8.08 | 2,394 | 22.77 | ||||
| 2025-07-28 | 13F | Tower Wealth Partners, Inc. | 492,981 | 3.98 | 18,137 | 15.19 | ||||
| 2025-07-17 | 13F | KWB Wealth | 236,281 | 57.88 | 7,847 | 51.44 | ||||
| 2025-08-11 | 13F | Private Advisor Group, LLC | 112,533 | 3.26 | 4,140 | 14.40 | ||||
| 2025-08-06 | 13F | Golden State Wealth Management, LLC | 0 | -100.00 | 0 | -100.00 | ||||
| 2025-08-13 | 13F | Marshall Wace, Llp | 94,953 | 3,493 | ||||||
| 2025-08-15 | 13F | Morgan Stanley | 3,401,063 | 41.84 | 125,125 | 57.13 | ||||
| 2025-05-15 | 13F | Ameriflex Group, Inc. | 0 | -100.00 | 0 | |||||
| 2025-08-08 | 13F | Thoroughbred Financial Services, Llc | 29,108 | 10.73 | 1 | |||||
| 2025-08-13 | 13F | Copley Financial Group, Inc. | 6,643 | -5.61 | 244 | 4.72 | ||||
| 2025-04-07 | 13F | AdvisorNet Financial, Inc | 0 | -100.00 | 0 | |||||
| 2025-08-12 | 13F | BlueStem Wealth Partners, LLC | 1,062,939 | -32.72 | 39,106 | -25.47 | ||||
| 2025-05-09 | 13F | Goldman Sachs Group Inc | 0 | -100.00 | 0 | |||||
| 2025-08-05 | 13F | Mma Asset Management Llc | 24,955 | -8.73 | 918 | 1.10 | ||||
| 2025-08-11 | 13F | Western Wealth Management, LLC | 110,174 | 3.02 | 4,053 | 14.14 | ||||
| 2025-08-11 | 13F | Advisor Resource Council | 0 | -100.00 | 0 | |||||
| 2025-08-12 | 13F | Spectrum Wealth Advisory Group, LLC | 837,922 | -16.48 | 30,827 | -7.47 | ||||
| 2025-07-29 | 13F | Private Trust Co Na | 3,475 | 128 | ||||||
| 2025-07-29 | 13F | Riverbend Wealth Management, LLC | 14,803 | 38.60 | 545 | 53.67 | ||||
| 2025-07-11 | 13F | SILVER OAK SECURITIES, Inc | 80,568 | 2.77 | 2,964 | 14.57 | ||||
| 2025-08-13 | 13F | Denver Wealth Management, Inc. | 30,795 | 23.55 | 1,133 | 36.88 | ||||
| 2025-08-14 | 13F | Fmr Llc | 2,182 | 114.13 | 80 | 142.42 | ||||
| 2025-07-15 | 13F | Oxinas Partners Wealth Management LLC | 22,200 | 0.00 | 817 | 10.72 | ||||
| 2025-08-29 | 13F | Centaurus Financial, Inc. | 385,922 | 2.64 | 14 | 16.67 | ||||
| 2025-07-07 | 13F | RDA Financial Network | 105,535 | 6.41 | 3,883 | 17.89 | ||||
| 2025-08-14 | 13F | Paragon Private Wealth Management, LLC | 57,620 | 12.59 | 2,120 | 24.72 | ||||
| 2025-07-29 | 13F | Activest Wealth Management | 0 | 0 | ||||||
| 2025-08-12 | 13F | Proequities, Inc. | 0 | 0 | ||||||
| 2025-07-31 | 13F | Cambridge Investment Research Advisors, Inc. | 240,780 | 12.60 | 9 | 14.29 | ||||
| 2025-08-14 | 13F | Ameriprise Financial Inc | 12,963,845 | 22.35 | 476,940 | 35.54 | ||||
| 2025-08-13 | 13F | Advisor Group Holdings, Inc. | 150,006 | -50.96 | 5,227 | -48.55 | ||||
| 2025-07-09 | 13F | Fiduciary Alliance LLC | 6,883 | -11.30 | 253 | -1.56 | ||||
| 2025-07-16 | 13F | Perigon Wealth Management, LLC | 6,927 | 10.64 | 255 | 22.71 | ||||
| 2025-07-22 | 13F | DAVENPORT & Co LLC | 131,024 | 90.96 | 4,820 | 111.59 | ||||
| 2025-05-08 | 13F | Us Bancorp \de\ | 0 | -100.00 | 0 | |||||
| 2025-07-25 | 13F | Atria Wealth Solutions, Inc. | 55,103 | 62.11 | 2,027 | 79.70 | ||||
| 2025-08-06 | 13F/A | Three Cord True Wealth Management, LLC | 523,209 | 7.65 | 19,249 | 19.25 | ||||
| 2025-08-13 | 13F | Renaissance Technologies Llc | 27,900 | 1,026 | ||||||
| 2025-08-14 | 13F | Raymond James Financial Inc | 3,167,950 | 15.28 | 116,549 | 27.70 | ||||
| 2025-08-14 | 13F | Dagco, Inc. | 80,985 | 25.84 | 2,979 | 39.40 | ||||
| 2025-05-15 | 13F | Old Mission Capital Llc | 0 | -100.00 | 0 | |||||
| 2025-08-01 | 13F | Envestnet Asset Management Inc | 65,696 | 14.49 | 2,417 | 26.82 | ||||
| 2025-08-06 | 13F | Bensler, LLC | 227,616 | 3.67 | 8,374 | 14.84 | ||||
| 2025-07-08 | 13F | Paladin Wealth, LLC | 60,269 | 2.85 | 2,217 | 13.93 | ||||
| 2025-07-31 | 13F | Mason & Associates Inc | 1,029,239 | 37,866 | ||||||
| 2025-08-04 | 13F | Creative Financial Designs Inc /adv | 36 | 1 | ||||||
| 2025-07-31 | 13F | Richards, Merrill & Peterson, Inc. | 0 | -100.00 | 0 | |||||
| 2025-07-22 | 13F | USAdvisors Wealth Management, LLC | 160,450 | 5.13 | 6 | 0.00 | ||||
| 2025-08-14 | 13F | Keystone Financial Services, LLC | 6,698 | 246 | ||||||
| 2025-05-12 | 13F | Independent Advisor Alliance | 0 | -100.00 | 0 | |||||
| 2025-08-04 | 13F | Atria Investments Llc | 190,216 | 6.16 | 6,998 | 17.61 | ||||
| 2025-08-14 | 13F | Two Sigma Investments, Lp | 603,600 | 544.87 | 22,206 | 614.48 | ||||
| 2025-07-15 | 13F | Axis Wealth Partners, LLC | 33,241 | 13.75 | 1,223 | 25.98 | ||||
| 2025-08-18 | 13F | Arq Wealth Advisors, Llc | 214,206 | 0.00 | 7,114 | 0.00 | ||||
| 2025-08-15 | 13F | Kestra Advisory Services, LLC | 145,845 | 36.98 | 5,366 | 51.77 | ||||
| 2025-05-01 | 13F | Fulcrum Equity Management | 0 | -100.00 | 0 | |||||
| 2025-08-12 | 13F | LPL Financial LLC | 10,820,984 | 20.41 | 398,104 | 33.38 | ||||
| 2025-08-13 | 13F | Jones Financial Companies Lllp | 230,633 | 41.60 | 8,455 | 57.27 | ||||
| 2025-08-14 | 13F | Susquehanna International Group, Llp | 55,754 | -51.17 | 2,051 | -45.91 | ||||
| 2025-07-10 | 13F | Sovran Advisors, LLC | 92,334 | 33.27 | 3,417 | 58.86 | ||||
| 2025-08-08 | 13F | Larson Financial Group LLC | 2,277 | -39.92 | 84 | -33.60 | ||||
| 2025-08-14 | 13F | UBS Group AG | 366,954 | 159.97 | 13,500 | 188.03 | ||||
| 2025-08-14 | 13F | Citadel Advisors Llc | 17,151 | 16.67 | 631 | 29.10 | ||||
| 2025-08-14 | 13F | Integrated Wealth Concepts LLC | 5,912 | 218 | ||||||
| 2025-08-11 | 13F | Principal Securities, Inc. | 24,351 | 125.26 | 896 | 139.30 | ||||
| 2025-08-05 | 13F | Flynn Zito Capital Management, Llc | 155,216 | -0.15 | 5,710 | 10.62 | ||||
| 2025-08-15 | 13F | Equitable Holdings, Inc. | 12,430 | 85.52 | 457 | 105.86 | ||||
| 2025-08-13 | 13F | Congress Wealth Management LLC / DE / | 99,278 | 10.30 | 3,652 | 22.18 | ||||
| 2025-08-07 | 13F | Kestra Private Wealth Services, Llc | 241,380 | 34.51 | 8,880 | 49.02 | ||||
| 2025-08-07 | 13F | Allworth Financial LP | 1,961 | 38.39 | 72 | 60.00 | ||||
| 2025-08-12 | 13F | Global Retirement Partners, LLC | 2,732 | 2.32 | 101 | 8.70 | ||||
| 2025-08-12 | 13F | Gladstone Institutional Advisory LLC | 491,805 | 22.81 | 18,094 | 36.05 | ||||
| 2025-08-19 | 13F | National Asset Management, Inc. | 31,536 | 16.06 | 1,160 | 23.40 | ||||
| 2025-08-05 | 13F | Smith Shellnut Wilson Llc /adv | 23,069 | 22.94 | 849 | 36.12 | ||||
| 2025-04-24 | NP | NSGAX - Columbia Select Large Cap Equity Fund Class A | 43,258 | -60.52 | 1,520 | -61.51 | ||||
| 2025-07-08 | 13F | Gradient Investments LLC | 2,031,726 | 1.17 | 74,747 | 12.08 | ||||
| 2025-07-09 | 13F | Fermata Advisors, LLC | 101,501 | -0.73 | 3,734 | 9.99 | ||||
| 2025-08-14 | 13F | CoreCap Advisors, LLC | 106 | 0.00 | 4 | 0.00 | ||||
| 2025-07-10 | 13F | Wealth Enhancement Advisory Services, Llc | 320,671 | 394.61 | 11,983 | 456.57 | ||||
| 2025-07-31 | 13F | Leavell Investment Management, Inc. | 125,694 | 39.50 | 4,624 | 54.55 | ||||
| 2025-07-30 | 13F/A | KPP Advisory Services LLC | 45,678 | 196.11 | 1,680 | 228.13 | ||||
| 2025-08-12 | 13F | Cornerstone Wealth Management, LLC | 14,683 | 12.12 | 540 | 24.42 | ||||
| 2025-08-12 | 13F | SRS Capital Advisors, Inc. | 2,376 | -23.67 | 87 | -15.53 | ||||
| 2025-07-09 | 13F | Pines Wealth Management, LLC | 35,328 | 9.89 | 1,320 | 39.68 | ||||
| 2025-07-29 | 13F | Mattson Financial Services, LLC | 64,709 | -5.47 | 2,381 | 4.71 | ||||
| 2025-08-14 | 13F | Wells Fargo & Company/mn | 1,522,931 | 67.65 | 56,029 | 85.72 | ||||
| 2025-08-14 | 13F | GWM Advisors LLC | 357,751 | -0.73 | 13,162 | 9.97 | ||||
| 2025-07-28 | 13F | Harbour Investments, Inc. | 8,201 | 13.12 | 302 | 25.42 | ||||
| 2025-07-16 | 13F | Essex Financial Services, Inc. | 213,424 | 22.60 | 7,852 | 35.81 | ||||
| 2025-07-25 | 13F | Cwm, Llc | 196 | 0.00 | 0 | |||||
| 2025-08-15 | 13F | Brown Financial Advisors | 115,356 | -2.38 | 4,244 | 8.13 | ||||
| 2025-08-04 | 13F | Pensionmark Financial Group, Llc | 152,094 | -0.83 | 5,596 | 9.86 | ||||
| 2025-08-01 | 13F | PCA Investment Advisory Services Inc. | 17,464 | 24.71 | 643 | 38.06 | ||||
| 2025-04-17 | 13F | Tcfg Wealth Management, Llc | 0 | -100.00 | 0 | |||||
| 2025-08-13 | 13F | IAG Wealth Partners, LLC | 296,568 | 143.19 | 10,911 | 169.45 | ||||
| 2025-08-14 | 13F | Stifel Financial Corp | 179,979 | 898.88 | 6,621 | 1,007.19 | ||||
| 2025-07-30 | 13F | Prosperity Financial Group, Inc. | 39,656 | 32.34 | 1,459 | 46.53 | ||||
| 2025-08-12 | 13F | Inscription Capital, LLC | 39,399 | 1,449 | ||||||
| 2025-08-14 | 13F | Mariner, LLC | 126,650 | 31.44 | 4,659 | 45.59 | ||||
| 2025-08-01 | 13F | Y-Intercept (Hong Kong) Ltd | 22,849 | 841 | ||||||
| 2025-07-16 | 13F | Spirepoint Private Client, Llc | 64,672 | -8.88 | 2,379 | 0.93 | ||||
| 2025-06-25 | NP | LEGAX - Columbia Large Cap Growth Fund Class A | 169,788 | -50.53 | 5,572 | -54.33 | ||||
| 2025-08-12 | 13F | Steward Partners Investment Advisory, Llc | 90,084 | 13.78 | 3,314 | 26.06 |