Basic Stats
| Institutional Owners | 15 total, 15 long only, 0 short only, 0 long/short - change of 7.14% MRQ |
| Average Portfolio Allocation | 0.0752 % - change of 351.86% MRQ |
| Institutional Shares (Long) | 181,137 (ex 13D/G) - change of -0.01MM shares -2.76% MRQ |
| Institutional Value (Long) | $ 5,037 USD ($1000) |
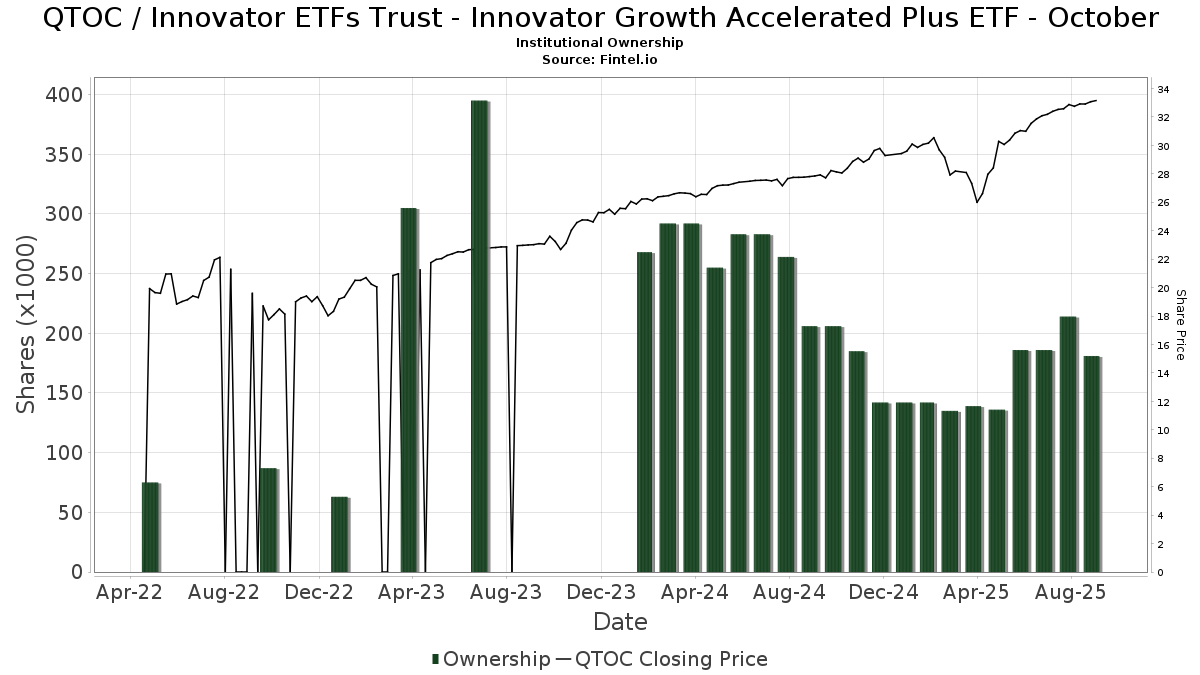
Institutional Ownership and Shareholders
Innovator ETFs Trust - Innovator Growth Accelerated Plus ETF - October (US:QTOC) has 15 institutional owners and shareholders that have filed 13D/G or 13F forms with the Securities Exchange Commission (SEC). These institutions hold a total of 181,137 shares. Largest shareholders include Sunbelt Securities, Inc., Andina Capital Management, LLC, Commonwealth Equity Services, Llc, Brookwood Investment Group LLC, Advisor Group Holdings, Inc., Pensionmark Financial Group, Llc, Cary Street Partners Financial Llc, Gts Securities Llc, BLVD Private Wealth, LLC, and HighTower Advisors, LLC .
Innovator ETFs Trust - Innovator Growth Accelerated Plus ETF - October (BATS:QTOC) institutional ownership structure shows current positions in the company by institutions and funds, as well as latest changes in position size. Major shareholders can include individual investors, mutual funds, hedge funds, or institutions. The Schedule 13D indicates that the investor holds (or held) more than 5% of the company and intends (or intended) to actively pursue a change in business strategy. Schedule 13G indicates a passive investment of over 5%.
The share price as of September 8, 2025 is 33.03 / share. Previously, on September 9, 2024, the share price was 27.81 / share. This represents an increase of 18.75% over that period.
Fund Sentiment Score
The Fund Sentiment Score (fka Ownership Accumulation Score) finds the stocks that are being most bought by funds. It is the result of a sophisticated, multi-factor quantitative model that identifies companies with the highest levels of institutional accumulation. The scoring model uses a combination of the total increase in disclosed owners, the changes in portfolio allocations in those owners and other metrics. The number ranges from 0 to 100, with higher numbers indicating a higher level of accumulation to its peers, and 50 being the average.
Update Frequency: Daily
See Ownership Explorer, which provides a list of highest-ranking companies.
Institutional Put/Call Ratio
In addition to reporting standard equity and debt issues, institutions with more than 100MM assets under management must also disclose their put and call option holdings. Since put options generally indicate negative sentiment, and call options indicate positive sentiment, we can get a sense of the overall institutional sentiment by plotting the ratio of puts to calls. The chart to the right plots the historical put/call ratio for this instrument.
Using Put/Call Ratio as an indicator of investor sentiment overcomes one of the key deficiencies of using total institutional ownership, which is that a significant amount of assets under management are invested passively to track indices. Passively-managed funds do not typically buy options, so the put/call ratio indicator more closely tracks the sentiment of actively-managed funds.
13F and NPORT Filings
Detail on 13F filings are free. Detail on NP filings require a premium membership. Green rows indicate new positions. Red rows indicate closed positions. Click the link icon to see the full transaction history.
Upgrade
to unlock premium data and export to Excel ![]() .
.
| File Date | Source | Investor | Type | Avg Price (Est) |
Shares | Δ Shares (%) |
Reported Value ($1000) |
Δ Value (%) |
Port Alloc (%) |
|
|---|---|---|---|---|---|---|---|---|---|---|
| 2025-08-04 | 13F | Pensionmark Financial Group, Llc | 12,200 | 0.00 | 389 | 15.77 | ||||
| 2025-08-08 | 13F | Gts Securities Llc | 11,368 | 363 | ||||||
| 2025-08-06 | 13F | AE Wealth Management LLC | 0 | -100.00 | 0 | |||||
| 2025-08-14 | 13F | UBS Group AG | 3,266 | 1,132.45 | 104 | 1,385.71 | ||||
| 2025-08-13 | 13F | EverSource Wealth Advisors, LLC | 401 | 0.00 | 13 | 9.09 | ||||
| 2025-09-04 | 13F/A | Advisor Group Holdings, Inc. | 15,030 | 3.44 | 479 | 19.45 | ||||
| 2025-08-01 | 13F | Brookwood Investment Group LLC | 15,092 | 16.40 | 481 | 34.73 | ||||
| 2025-08-13 | 13F | Cary Street Partners Financial Llc | 11,650 | 0.00 | 371 | 15.58 | ||||
| 2025-07-21 | 13F | DHJJ Financial Advisors, Ltd. | 45 | 0.00 | 1 | 0.00 | ||||
| 2025-08-25 | 13F | BLVD Private Wealth, LLC | 8,636 | 275 | ||||||
| 2025-07-21 | 13F | Andina Capital Management, LLC | 26,590 | 848 | ||||||
| 2025-08-12 | 13F | Wood Tarver Financial Group, LLC | 3,793 | 0.00 | 0 | -100.00 | ||||
| 2025-07-24 | 13F | IFP Advisors, Inc | 1,300 | 0.00 | 41 | 17.14 | ||||
| 2025-08-14 | 13F | Sunbelt Securities, Inc. | 49,797 | 7.15 | 1,458 | 13.65 | ||||
| 2025-08-14 | 13F | Citadel Advisors Llc | 0 | -100.00 | 0 | |||||
| 2025-08-14 | 13F | Susquehanna International Group, Llp | 0 | -100.00 | 0 | |||||
| 2025-08-06 | 13F | Commonwealth Equity Services, Llc | 15,110 | -8.12 | 0 | |||||
| 2025-08-11 | 13F | HighTower Advisors, LLC | 6,859 | 219 | ||||||
| 2025-08-12 | 13F | Proequities, Inc. | 0 | 0 |