Basic Stats
| Institutional Owners | 48 total, 48 long only, 0 short only, 0 long/short - change of 9.09% MRQ |
| Average Portfolio Allocation | 0.1522 % - change of 124.12% MRQ |
| Institutional Shares (Long) | 5,100,155 (ex 13D/G) - change of 0.76MM shares 17.41% MRQ |
| Institutional Value (Long) | $ 31,604 USD ($1000) |
Institutional Ownership and Shareholders
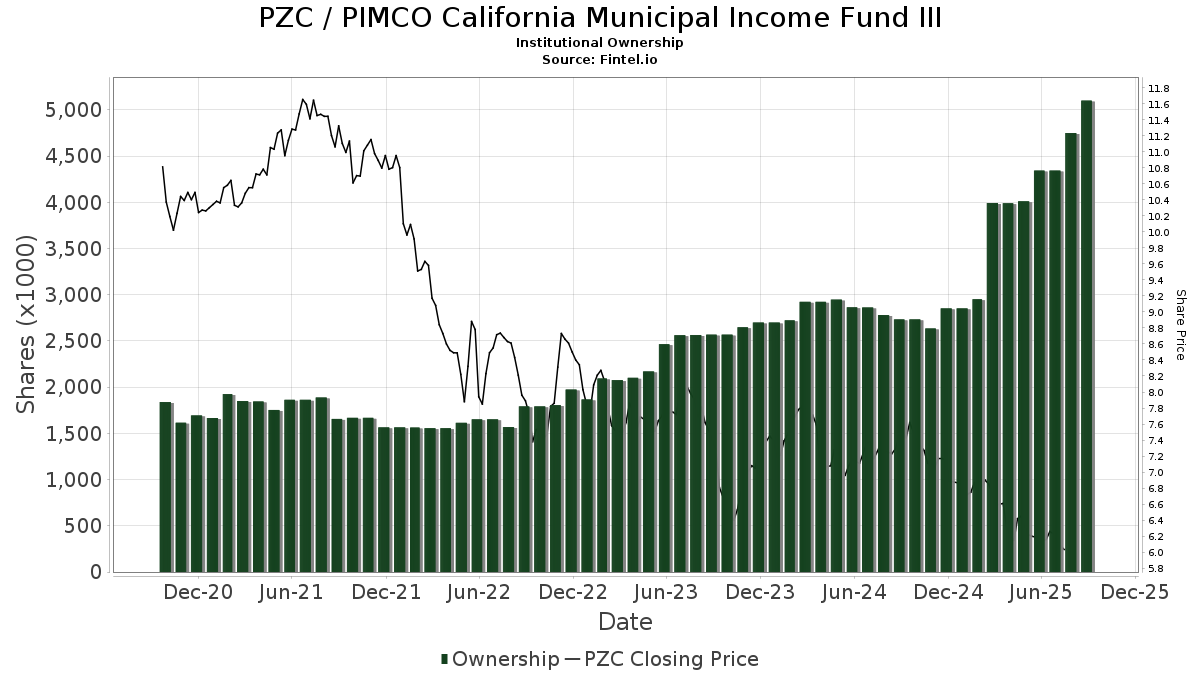
PIMCO California Municipal Income Fund III (US:PZC) has 48 institutional owners and shareholders that have filed 13D/G or 13F forms with the Securities Exchange Commission (SEC). These institutions hold a total of 5,100,155 shares. Largest shareholders include Rivernorth Capital Management, Llc, Hennion & Walsh Asset Management, Inc., Advisors Asset Management, Inc., Matisse Capital, Guggenheim Capital Llc, MDFIX - Matisse Discounted Bond CEF Strategy Institutional Class, UBS Group AG, RiverNorth Flexible Municipal Income Fund II, Inc., Morgan Stanley, and Toronto Dominion Bank .
PIMCO California Municipal Income Fund III (NYSE:PZC) institutional ownership structure shows current positions in the company by institutions and funds, as well as latest changes in position size. Major shareholders can include individual investors, mutual funds, hedge funds, or institutions. The Schedule 13D indicates that the investor holds (or held) more than 5% of the company and intends (or intended) to actively pursue a change in business strategy. Schedule 13G indicates a passive investment of over 5%.
The share price as of August 1, 2025 is 6.10 / share. Previously, on September 9, 2024, the share price was 7.38 / share. This represents a decline of 17.34% over that period.
Fund Sentiment Score
The Fund Sentiment Score (fka Ownership Accumulation Score) finds the stocks that are being most bought by funds. It is the result of a sophisticated, multi-factor quantitative model that identifies companies with the highest levels of institutional accumulation. The scoring model uses a combination of the total increase in disclosed owners, the changes in portfolio allocations in those owners and other metrics. The number ranges from 0 to 100, with higher numbers indicating a higher level of accumulation to its peers, and 50 being the average.
Update Frequency: Daily
See Ownership Explorer, which provides a list of highest-ranking companies.
Institutional Put/Call Ratio
In addition to reporting standard equity and debt issues, institutions with more than 100MM assets under management must also disclose their put and call option holdings. Since put options generally indicate negative sentiment, and call options indicate positive sentiment, we can get a sense of the overall institutional sentiment by plotting the ratio of puts to calls. The chart to the right plots the historical put/call ratio for this instrument.
Using Put/Call Ratio as an indicator of investor sentiment overcomes one of the key deficiencies of using total institutional ownership, which is that a significant amount of assets under management are invested passively to track indices. Passively-managed funds do not typically buy options, so the put/call ratio indicator more closely tracks the sentiment of actively-managed funds.
13F and NPORT Filings
Detail on 13F filings are free. Detail on NP filings require a premium membership. Green rows indicate new positions. Red rows indicate closed positions. Click the link icon to see the full transaction history.
Upgrade
to unlock premium data and export to Excel ![]() .
.
| File Date | Source | Investor | Type | Avg Price (Est) |
Shares | Δ Shares (%) |
Reported Value ($1000) |
Δ Value (%) |
Port Alloc (%) |
|
|---|---|---|---|---|---|---|---|---|---|---|
| 2025-08-25 | NP | MDFIX - Matisse Discounted Bond CEF Strategy Institutional Class | 310,000 | 1,931 | ||||||
| 2025-09-04 | 13F/A | Advisor Group Holdings, Inc. | 8,142 | 0.00 | 51 | -5.66 | ||||
| 2025-08-13 | 13F | Baird Financial Group, Inc. | 34,743 | -0.53 | 216 | -4.85 | ||||
| 2025-08-14 | 13F | Susquehanna International Group, Llp | 12,531 | 78 | ||||||
| 2025-08-12 | 13F | Jpmorgan Chase & Co | 953 | 0.00 | 6 | -16.67 | ||||
| 2025-04-15 | 13F | Noble Wealth Management PBC | 2,000 | 0.00 | 13 | 0.00 | ||||
| 2025-08-14 | 13F | Rivernorth Capital Management, Llc | 970,651 | 14.81 | 6,047 | 9.71 | ||||
| 2025-07-23 | 13F | Matisse Capital | 379,553 | 2,458.84 | 2,365 | 2,362.50 | ||||
| 2025-07-14 | 13F | Sowell Financial Services LLC | 17,204 | -1.02 | 107 | -5.31 | ||||
| 2025-08-14 | 13F | Integrated Wealth Concepts LLC | 69,971 | 0.00 | 436 | -4.61 | ||||
| 2025-08-14 | 13F | UBS Group AG | 269,448 | -5.63 | 1,679 | -9.83 | ||||
| 2025-08-12 | 13F | Virtu Financial LLC | 0 | -100.00 | 0 | |||||
| 2025-07-11 | 13F | Vanguard Capital Wealth Advisors This fund is a listed as child fund of Vanguard Group Inc and if that institution has disclosed ownership in this security, then these positions will not be double counted when calculating total shares and total value | 12,000 | 4.35 | 75 | 0.00 | ||||
| 2025-07-31 | 13F | Whipplewood Advisors, LLC | 27,190 | 169 | ||||||
| 2025-08-28 | NP | RiverNorth Flexible Municipal Income Fund II, Inc. | 210,462 | 0.00 | 1,311 | -4.45 | ||||
| 2025-08-28 | NP | RiverNorth Managed Duration Municipal Income Fund II, Inc. | 20,645 | 0.00 | 129 | -4.48 | ||||
| 2025-07-30 | 13F | FNY Investment Advisers, LLC | 300 | 0.00 | 0 | |||||
| 2025-08-14 | 13F | Raymond James Financial Inc | 54,000 | 9.76 | 336 | 5.00 | ||||
| 2025-08-14 | 13F | Toronto Dominion Bank | 195,831 | 1,220 | ||||||
| 2025-04-16 | 13F/A | Western Wealth Management, LLC | 0 | -100.00 | 0 | |||||
| 2025-08-08 | 13F | Cetera Investment Advisers | 33,897 | -1.28 | 211 | -5.38 | ||||
| 2025-08-14 | 13F | Balyasny Asset Management Llc | 25,205 | 157 | ||||||
| 2025-08-27 | NP | RYDEX VARIABLE TRUST - Multi-Hedge Strategies Fund Variable Annuity | 503 | -11.75 | 3 | 0.00 | ||||
| 2025-05-15 | 13F | Nomura Holdings Inc | 0 | -100.00 | 0 | |||||
| 2025-08-11 | 13F | Core Wealth Partners LLC | 96,446 | 0.00 | 601 | -4.46 | ||||
| 2025-08-27 | NP | RYMSX - Guggenheim Multi-Hedge Strategies Fund Class P | 299 | -31.74 | 2 | -50.00 | ||||
| 2025-08-04 | 13F | Wolverine Asset Management Llc | 56,733 | -66.41 | 353 | -67.94 | ||||
| 2025-08-14 | 13F/A | Rockefeller Capital Management L.P. | 55,196 | 1.39 | 344 | -3.11 | ||||
| 2025-08-06 | 13F | Golden State Wealth Management, LLC | 4,158 | 0.00 | 26 | -7.41 | ||||
| 2025-08-05 | 13F | Intellectus Partners, LLC | 49,000 | 11.36 | 307 | 6.25 | ||||
| 2025-05-09 | 13F | Beta Wealth Group, Inc. | 0 | -100.00 | 0 | |||||
| 2025-08-14 | 13F | Almitas Capital LLC | 32,594 | 39.20 | 203 | 33.55 | ||||
| 2025-07-22 | 13F | Mascoma Wealth Management LLC | 343 | 0.00 | 2 | 0.00 | ||||
| 2025-08-12 | 13F | Proequities, Inc. | 0 | 0 | ||||||
| 2025-08-06 | 13F | Wedbush Securities Inc | 12,034 | -41.96 | 0 | |||||
| 2025-08-14 | 13F | Logan Stone Capital, LLC | 154,095 | -19.47 | 960 | -23.02 | ||||
| 2025-08-14 | 13F | Bank Of America Corp /de/ | 96,143 | 0.30 | 599 | -4.32 | ||||
| 2025-08-05 | 13F | Bank of New York Mellon Corp | 107,799 | 37.17 | 672 | 31.05 | ||||
| 2025-08-28 | NP | RiverNorth Opportunistic Municipal Income Fund, Inc. | 36,438 | 0.00 | 227 | -4.22 | ||||
| 2025-08-07 | 13F | Hennion & Walsh Asset Management, Inc. | 438,335 | 8.58 | 2,731 | 3.72 | ||||
| 2025-07-21 | 13F | Catalina Capital Group, LLC | 25,076 | 156 | ||||||
| 2025-08-15 | 13F | Morgan Stanley | 203,656 | -17.87 | 1,269 | -21.53 | ||||
| 2025-07-30 | 13F | Whittier Trust Co | 722 | 0.00 | 4 | 0.00 | ||||
| 2025-08-14 | 13F | Wells Fargo & Company/mn | 56,783 | 29.35 | 354 | 23.43 | ||||
| 2025-07-14 | 13F | Conrad Siegel Investment Advisors, Inc. | 0 | -100.00 | 0 | |||||
| 2025-08-14 | 13F | Royal Bank Of Canada | 24,861 | 231.57 | 155 | 216.33 | ||||
| 2025-08-28 | NP | RiverNorth Managed Duration Municipal Income Fund, Inc. | 45,828 | 0.00 | 286 | -4.36 | ||||
| 2025-07-17 | 13F | Melfa Wealth Management, Llc | 10,540 | 0.00 | 66 | -4.41 | ||||
| 2025-08-14 | 13F | Hrt Financial Lp | 12,030 | 0 | ||||||
| 2025-08-12 | 13F | Advisors Asset Management, Inc. | 411,887 | -28.03 | 2,566 | -31.22 | ||||
| 2025-08-20 | NP | ADANX - AQR Diversified Arbitrage Fund Class N | 198 | 725.00 | 1 | |||||
| 2025-08-12 | 13F | Landscape Capital Management, L.l.c. | 105,812 | -7.41 | 659 | -11.54 | ||||
| 2025-08-13 | 13F | Guggenheim Capital Llc | 373,143 | -9.39 | 2,325 | -13.45 | ||||
| 2025-08-28 | NP | RiverNorth Flexible Municipal Income Fund, Inc. | 34,777 | 0.00 | 217 | -4.42 |