Basic Stats
| Institutional Shares (Long) | 4,886,722 - 37.20% (ex 13D/G) - change of 0.54MM shares 12.45% MRQ |
| Institutional Value (Long) | $ 452,745 USD ($1000) |
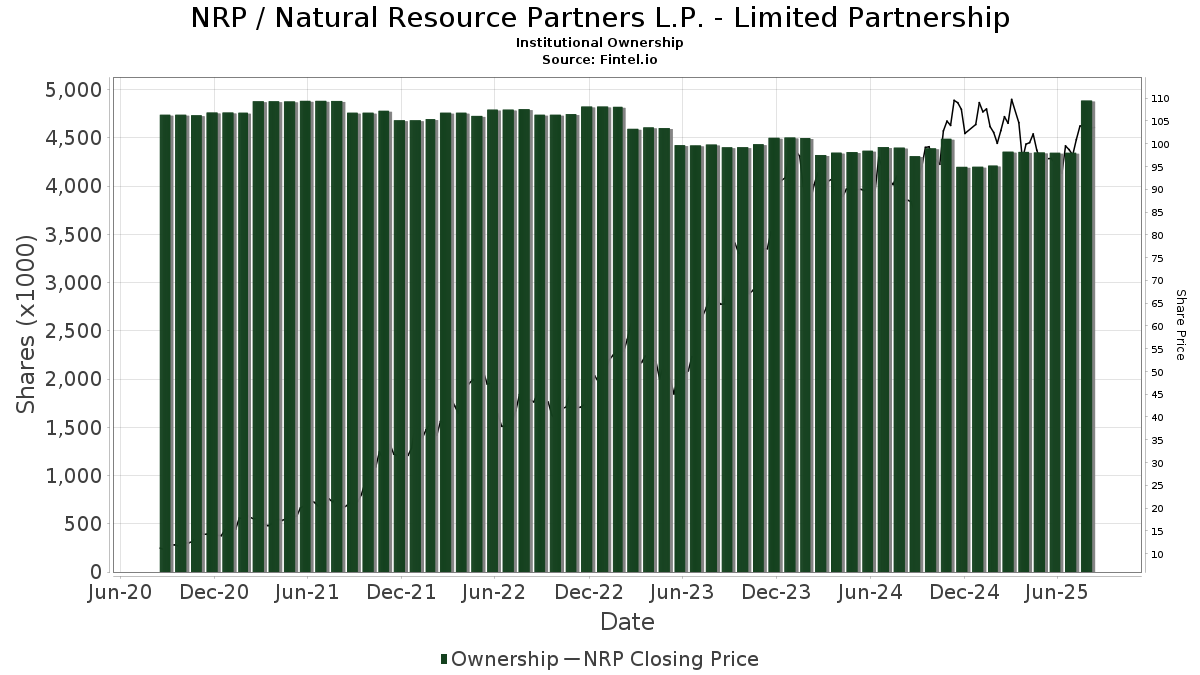
Institutional Ownership and Shareholders
Natural Resource Partners L.P. - Limited Partnership (US:NRP) has 77 institutional owners and shareholders that have filed 13D/G or 13F forms with the Securities Exchange Commission (SEC). These institutions hold a total of 4,886,722 shares. Largest shareholders include Morgan Stanley, Goldman Sachs Group Inc, CI Private Wealth, LLC, Jpmorgan Chase & Co, Progeny 3, Inc., UBS Group AG, Solidarilty Wealth, LLC, Oakcliff Capital Partners, LP, Citigroup Inc, and Ing Groep Nv .
Natural Resource Partners L.P. - Limited Partnership (NYSE:NRP) institutional ownership structure shows current positions in the company by institutions and funds, as well as latest changes in position size. Major shareholders can include individual investors, mutual funds, hedge funds, or institutions. The Schedule 13D indicates that the investor holds (or held) more than 5% of the company and intends (or intended) to actively pursue a change in business strategy. Schedule 13G indicates a passive investment of over 5%.
The share price as of September 4, 2025 is 103.96 / share. Previously, on September 5, 2024, the share price was 85.81 / share. This represents an increase of 21.15% over that period.
Fund Sentiment Score
The Fund Sentiment Score (fka Ownership Accumulation Score) finds the stocks that are being most bought by funds. It is the result of a sophisticated, multi-factor quantitative model that identifies companies with the highest levels of institutional accumulation. The scoring model uses a combination of the total increase in disclosed owners, the changes in portfolio allocations in those owners and other metrics. The number ranges from 0 to 100, with higher numbers indicating a higher level of accumulation to its peers, and 50 being the average.
Update Frequency: Daily
See Ownership Explorer, which provides a list of highest-ranking companies.
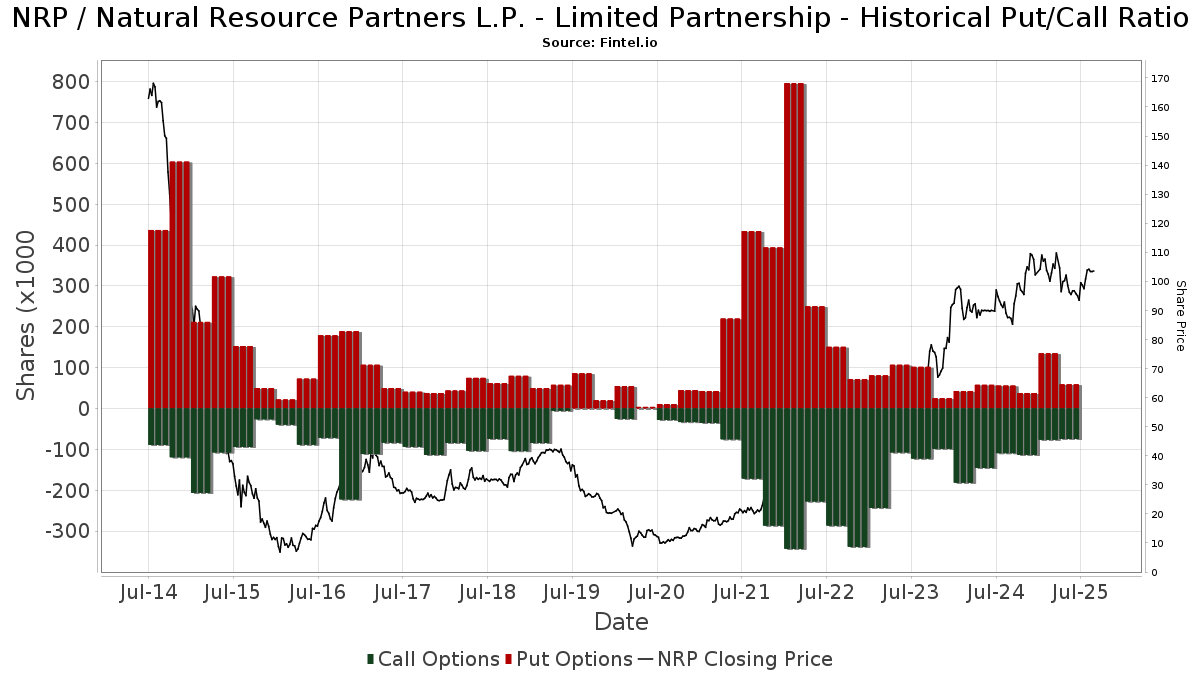
Institutional Put/Call Ratio
In addition to reporting standard equity and debt issues, institutions with more than 100MM assets under management must also disclose their put and call option holdings. Since put options generally indicate negative sentiment, and call options indicate positive sentiment, we can get a sense of the overall institutional sentiment by plotting the ratio of puts to calls. The chart to the right plots the historical put/call ratio for this instrument.
Using Put/Call Ratio as an indicator of investor sentiment overcomes one of the key deficiencies of using total institutional ownership, which is that a significant amount of assets under management are invested passively to track indices. Passively-managed funds do not typically buy options, so the put/call ratio indicator more closely tracks the sentiment of actively-managed funds.
13D/G Filings
We present 13D/G filings separately from the 13F filings because of the different treatement by the SEC. 13D/G filings can be filed by groups of investors (with one leading), whereas 13F filings cannot. This results in situations where an investor may file a 13D/G reporting one value for the total shares (representing all the shares owned by the investor group), but then file a 13F reporting a different value for the total shares (representing strictly their own ownership). This means that share ownership of 13D/G filings and 13F filings are oftentimes not directly comparable, so we present them separately.
Note: As of May 16, 2021, we no longer show owners that have not filed a 13D/G within the last year. Previously, we were showing the full history of 13D/G filings. In general, entities that are required to file 13D/G filings must file at least annually before submitting a closing filing. However, funds sometimes exit positions without submitting a closing filing (ie, they wind down), so displaying the full history sometimes resulted in confusion about the current ownership. To prevent confusion, we now only show ’current’ owners - that is - owners that have filed within the last year.
Upgrade to unlock premium data.
| File Date | Form | Investor | Prev Shares |
Latest Shares |
Δ Shares (Percent) |
Ownership (Percent) |
Δ Ownership (Percent) |
|
|---|---|---|---|---|---|---|---|---|
| 2024-11-07 | GOLDMAN SACHS GROUP INC | 917,289 | 685,315 | -25.29 | 5.30 | -27.40 |
13F and NPORT Filings
Detail on 13F filings are free. Detail on NP filings require a premium membership. Green rows indicate new positions. Red rows indicate closed positions. Click the link icon to see the full transaction history.
Upgrade
to unlock premium data and export to Excel ![]() .
.
| File Date | Source | Investor | Type | Avg Price (Est) |
Shares | Δ Shares (%) |
Reported Value ($1000) |
Δ Value (%) |
Port Alloc (%) |
|
|---|---|---|---|---|---|---|---|---|---|---|
| 2025-08-14 | 13F | Eschler Asset Management LLP | 8,000 | 0.00 | 764 | -8.06 | ||||
| 2025-07-10 | 13F | Exchange Traded Concepts, Llc | 7,133 | -9.42 | 681 | -16.75 | ||||
| 2025-08-26 | NP | MDIV - Multi-Asset Diversified Income Index Fund This fund is a listed as child fund of First Trust Advisors Lp and if that institution has disclosed ownership in this security, then these positions will not be double counted when calculating total shares and total value | 20,635 | -43.76 | 1,971 | -48.32 | ||||
| 2025-08-13 | 13F | Solidarilty Wealth, LLC | 186,393 | 12.95 | 17,802 | 3.83 | ||||
| 2025-08-14 | 13F | Raymond James Financial Inc | 1,429 | 137 | ||||||
| 2025-08-12 | 13F | Castalian Partners, LLC | Call | 0 | -100.00 | 0 | -100.00 | |||
| 2025-08-15 | 13F | CI Private Wealth, LLC | 621,478 | 12,329.56 | 59,357 | 11,336.80 | ||||
| 2025-08-13 | 13F | Jump Financial, LLC | 2,444 | 8.14 | 233 | -0.43 | ||||
| 2025-08-12 | 13F | Castalian Partners, LLC | Put | 0 | -100.00 | 0 | -100.00 | |||
| 2025-08-12 | 13F | Virtu Financial LLC | 3,847 | 0 | ||||||
| 2025-08-14 | 13F | Goldman Sachs Group Inc | 729,133 | 0.04 | 69,639 | -8.04 | ||||
| 2025-08-15 | 13F | Morgan Stanley | 945,042 | -4.47 | 90,261 | -12.18 | ||||
| 2025-08-14 | 13F | Royal Bank Of Canada | 9,088 | -1.21 | 868 | -9.21 | ||||
| 2025-08-13 | 13F | Level Four Advisory Services, Llc | 7,300 | 0.00 | 697 | -8.05 | ||||
| 2025-08-12 | 13F | Jpmorgan Chase & Co | 344,351 | -3.17 | 32,889 | -10.99 | ||||
| 2025-05-12 | 13F | Simplex Trading, Llc | 0 | -100.00 | 0 | |||||
| 2025-07-29 | NP | COAL - Range Global Coal Index ETF | 7,133 | 18.45 | 699 | 10.25 | ||||
| 2025-08-11 | 13F | Covestor Ltd | 1,630 | 73.40 | 0 | |||||
| 2025-08-14 | 13F | Bnp Paribas Arbitrage, Sa | 2,850 | 128.00 | 272 | 110.85 | ||||
| 2025-08-11 | 13F | Citigroup Inc | 144,768 | 0.00 | 13,827 | -8.08 | ||||
| 2025-08-14 | 13F | Jane Street Group, Llc | 11,299 | 1,079 | ||||||
| 2025-08-14 | 13F | Hrt Financial Lp | 17,594 | 45.19 | 2 | 0.00 | ||||
| 2025-08-28 | NP | FBBAX - First Foundation Total Return Fund Class A | 7,696 | 6.30 | 735 | -2.26 | ||||
| 2025-08-14 | 13F | Jane Street Group, Llc | Put | 9,700 | 926 | |||||
| 2025-08-14 | 13F | Jane Street Group, Llc | Call | 4,900 | -61.42 | 468 | -64.59 | |||
| 2025-06-26 | NP | EBSFX - Eubel Brady & Suttman Income Fund | 69,000 | 0.00 | 7,046 | -3.68 | ||||
| 2025-08-01 | 13F | Chilton Capital Management Llc | 628 | 0.00 | 60 | -9.23 | ||||
| 2025-07-10 | 13F | Oliver Lagore Vanvalin Investment Group | 0 | -100.00 | 0 | |||||
| 2025-08-13 | 13F | Transce3nd, LLC | 0 | -100.00 | 0 | |||||
| 2025-08-19 | 13F | Cape Investment Advisory, Inc. | 228 | 22 | ||||||
| 2025-08-13 | 13F | Jones Financial Companies Lllp | 147 | 0.00 | 14 | -13.33 | ||||
| 2025-06-26 | NP | GYLD - Arrow Dow Jones Global Yield ETF | 1,280 | 127,900.00 | 131 | |||||
| 2025-07-22 | 13F | MAS Advisors LLC | 3,375 | 4.33 | 322 | -4.17 | ||||
| 2025-08-07 | 13F | Acadian Asset Management Llc | 15,410 | -1.62 | 1 | 0.00 | ||||
| 2025-08-14 | 13F | UBS Group AG | 202,716 | -15.73 | 19,361 | -22.53 | ||||
| 2025-08-14 | 13F | DHK Financial Advisors, Inc. | 4,404 | 0.00 | 421 | -8.10 | ||||
| 2025-08-12 | 13F | Castalian Partners, LLC | 77,081 | -49.65 | 7,362 | -53.71 | ||||
| 2025-08-05 | 13F | Simplex Trading, Llc | Put | 0 | -100.00 | 0 | ||||
| 2025-08-13 | 13F | Natixis | 61,300 | -14.39 | 5,855 | -21.81 | ||||
| 2025-05-05 | 13F | Formidable Asset Management, LLC | 0 | -100.00 | 0 | |||||
| 2025-07-17 | 13F | Raleigh Capital Management Inc. | 198 | 19 | ||||||
| 2025-05-15 | 13F | Macquarie Group Ltd | 0 | -100.00 | 0 | |||||
| 2025-08-14 | 13F | Susquehanna International Group, Llp | Call | 47,800 | 44.85 | 4,565 | 33.17 | |||
| 2025-08-08 | 13F | Larson Financial Group LLC | 1,255 | 56.88 | 120 | 43.37 | ||||
| 2025-08-14 | 13F | Susquehanna International Group, Llp | Put | 14,900 | -18.13 | 1,423 | -24.71 | |||
| 2025-05-15 | 13F | Tower Research Capital LLC (TRC) | 0 | -100.00 | 0 | |||||
| 2025-08-12 | 13F | Horizon Kinetics Asset Management Llc | 19,123 | 6.09 | 1,826 | -2.46 | ||||
| 2025-08-14 | 13F/A | Barclays Plc | 53 | 0 | ||||||
| 2025-06-26 | NP | EBSZX - Eubel Brady & Suttman Income and Appreciation Fund | 48,000 | 0.00 | 4,901 | -3.68 | ||||
| 2025-08-14 | 13F | First Foundation Advisors | 7,696 | 6.30 | 735 | -2.26 | ||||
| 2025-08-14 | 13F | Wells Fargo & Company/mn | 620 | -49.18 | 59 | -53.17 | ||||
| 2025-08-12 | 13F | LPL Financial LLC | 31,495 | 47.82 | 3,008 | 35.92 | ||||
| 2025-05-14 | 13F | Comerica Bank | 0 | -100.00 | 0 | |||||
| 2025-08-07 | 13F | Allworth Financial LP | 191 | 109.89 | 18 | 100.00 | ||||
| 2025-08-14 | 13F | GWM Advisors LLC | 266 | 144.04 | 25 | 127.27 | ||||
| 2025-08-06 | 13F | Ing Groep Nv | 121,700 | 11.74 | 11,624 | 2.72 | ||||
| 2025-08-12 | 13F | Inscription Capital, LLC | 5,000 | 0.00 | 478 | 3.70 | ||||
| 2025-08-14 | 13F | Oakcliff Capital Partners, LP | 153,930 | 0.00 | 14,702 | -8.08 | ||||
| 2025-09-04 | 13F/A | Advisor Group Holdings, Inc. | 608 | -20.00 | 58 | -25.64 | ||||
| 2025-08-14 | 13F | Mountain Lake Investment Management LLC | 37,550 | 69.90 | 3,586 | 56.18 | ||||
| 2025-08-04 | 13F | Covey Capital Advisors, LLC | 12,020 | 0.70 | 1,148 | -7.42 | ||||
| 2025-08-05 | 13F | Plante Moran Financial Advisors, LLC | 100 | 0.00 | 10 | -10.00 | ||||
| 2025-08-14 | 13F | Citadel Advisors Llc | Put | 30,300 | 69.27 | 2,894 | 55.62 | |||
| 2025-08-19 | 13F | State of Wyoming | 1,131 | -57.13 | 108 | -60.58 | ||||
| 2025-04-23 | 13F | Spire Wealth Management | 0 | -100.00 | 0 | |||||
| 2025-08-07 | 13F | David R. Rahn & Associates Inc. | 0 | -100.00 | 0 | |||||
| 2025-08-26 | NP | MGMT - Ballast Small/mid Cap Etf | 81,588 | 0.00 | 7,792 | -8.07 | ||||
| 2025-08-14 | 13F | Citadel Advisors Llc | Call | 15,000 | 11.11 | 1,433 | 2.14 | |||
| 2025-08-14 | 13F | Goldentree Asset Management Lp | 63,842 | 0.00 | 6,098 | -8.08 | ||||
| 2025-05-06 | 13F | Venturi Wealth Management, LLC | 0 | -100.00 | 0 | |||||
| 2025-08-14 | 13F | Citadel Advisors Llc | 39,712 | 49.69 | 3,793 | 37.59 | ||||
| 2025-04-22 | 13F | Guyasuta Investment Advisors Inc | 0 | -100.00 | 0 | |||||
| 2025-08-14 | 13F | Bank Of America Corp /de/ | 52,669 | -10.11 | 5,030 | -17.38 | ||||
| 2025-08-12 | 13F | BlackRock, Inc. | 100 | 0.00 | 10 | -10.00 | ||||
| 2025-08-14 | 13F | Energy Income Partners, LLC | 32,249 | -1.70 | 3,080 | -9.62 | ||||
| 2025-06-25 | NP | EIPX - FT Energy Income Partners Strategy ETF | 18,567 | 3.45 | 1,896 | -0.37 | ||||
| 2025-08-06 | 13F | Stokes Family Office, LLC | 15,355 | 16.99 | 1,467 | 7.56 | ||||
| 2025-08-14 | 13F | Ancora Advisors, LLC | 400 | 0.00 | 38 | -7.32 | ||||
| 2025-08-14 | 13F | Rangeley Capital, LLC | 12,100 | 1,156 | ||||||
| 2025-07-31 | 13F | Anthracite Investment Company, Inc. | 0 | -100.00 | 0 | |||||
| 2025-08-13 | 13F | First Trust Advisors Lp | 20,635 | -43.76 | 1,971 | -48.32 | ||||
| 2025-05-15 | 13F | Wolverine Trading, Llc | 0 | -100.00 | 0 | -100.00 | ||||
| 2025-07-24 | 13F | Us Bancorp \de\ | 300 | 0.00 | 29 | -9.68 | ||||
| 2025-08-05 | 13F | Meixler Investment Management, Ltd. | 67,502 | 36.64 | 6,447 | 25.62 | ||||
| 2025-08-14 | 13F | Pecaut & Co. | 7,800 | 6.85 | 745 | -1.85 | ||||
| 2025-08-14 | 13F | Progeny 3, Inc. | 302,550 | 4.26 | 28,897 | -4.16 | ||||
| 2025-05-15 | 13F | Wolverine Trading, Llc | Call | 0 | -100.00 | 0 | -100.00 | |||
| 2025-08-08 | 13F | Cetera Investment Advisers | 4,471 | 0.00 | 427 | -7.97 | ||||
| 2025-08-04 | 13F | Eubel Brady & Suttman Asset Management Inc | 117,500 | 0.09 | 11 | -8.33 | ||||
| 2025-07-30 | NP | DEEP - Roundhill Acquirers Deep Value ETF | 2,332 | -15.17 | 229 | -21.11 | ||||
| 2025-08-11 | 13F | Alps Advisors Inc | 3,431 | 1.24 | 328 | -7.10 | ||||
| 2025-08-05 | 13F | Simplex Trading, Llc | Call | 6,900 | 97.14 | 1 | ||||
| 2025-08-01 | 13F | Envestnet Asset Management Inc | 2,600 | 0.00 | 248 | -8.15 | ||||
| 2025-08-12 | 13F | CIBC Private Wealth Group, LLC | 198 | 0.00 | 19 | 5.88 | ||||
| 2025-08-06 | 13F | Pekin Hardy Strauss, Inc. | 19,975 | 0.00 | 1,908 | -8.10 | ||||
| 2025-08-12 | 13F | Proequities, Inc. | Put | 0 | 0 | |||||
| 2025-08-12 | 13F | Proequities, Inc. | Call | 0 | 0 | |||||
| 2025-08-12 | 13F | Proequities, Inc. | 0 | 0 | ||||||
| 2025-07-30 | NP | BFOR - Barron's 400 ETF | 3,431 | -14.18 | 336 | -20.19 | ||||
| 2025-08-18 | 13F | Wolverine Trading, Llc | Put | 4,800 | 453 | |||||
| 2025-05-14 | 13F | Virtus ETF Advisers LLC | 0 | -100.00 | 0 | |||||
| 2025-08-14 | 13F | Group One Trading, L.p. | 0 | -100.00 | 0 | |||||
| 2025-08-13 | 13F | Ballast Asset Management, LP | 81,588 | 0.00 | 7,792 | -8.07 | ||||
| 2025-08-14 | 13F | Group One Trading, L.p. | Call | 0 | -100.00 | 0 | ||||
| 2025-08-26 | NP | GAFCX - Virtus AlphaSimplex Global Alternatives Fund Class C | 714 | 26.15 | 68 | 17.24 |