Basic Stats
| Institutional Owners | 25 total, 20 long only, 1 short only, 4 long/short - change of 4.17% MRQ |
| Average Portfolio Allocation | 0.0039 % - change of -89.97% MRQ |
| Institutional Shares (Long) | 706,951 (ex 13D/G) - change of -1.43MM shares -66.85% MRQ |
| Institutional Value (Long) | $ 2,270 USD ($1000) |
Institutional Ownership and Shareholders
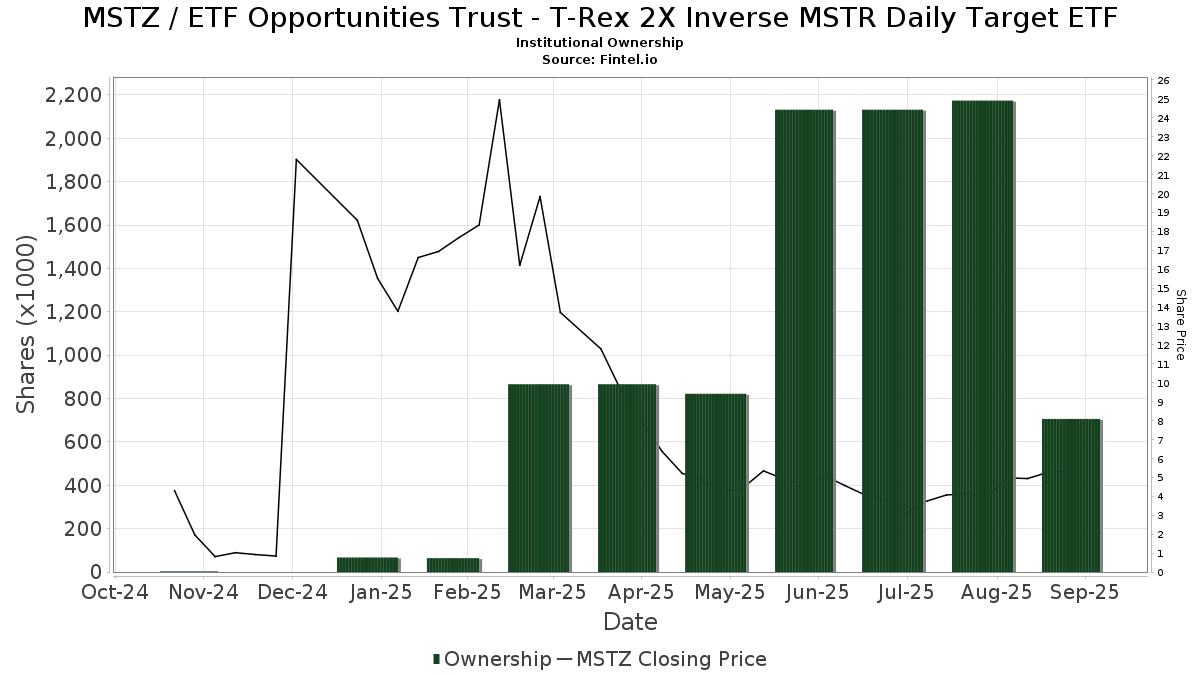
ETF Opportunities Trust - T-Rex 2X Inverse MSTR Daily Target ETF (US:MSTZ) has 25 institutional owners and shareholders that have filed 13D/G or 13F forms with the Securities Exchange Commission (SEC). These institutions hold a total of 706,951 shares. Largest shareholders include Susquehanna International Group, Llp, Hudson Bay Capital Management LP, Susquehanna International Group, Llp, Citadel Advisors Llc, Citadel Advisors Llc, Citadel Advisors Llc, Jane Street Group, Llc, Jane Street Group, Llc, Simplex Trading, Llc, and Nelson, Van Denburg & Campbell Wealth Management Group, LLC .
ETF Opportunities Trust - T-Rex 2X Inverse MSTR Daily Target ETF (BATS:MSTZ) institutional ownership structure shows current positions in the company by institutions and funds, as well as latest changes in position size. Major shareholders can include individual investors, mutual funds, hedge funds, or institutions. The Schedule 13D indicates that the investor holds (or held) more than 5% of the company and intends (or intended) to actively pursue a change in business strategy. Schedule 13G indicates a passive investment of over 5%.
The share price as of September 5, 2025 is 5.07 / share. Previously, on September 18, 2024, the share price was 489.07 / share. This represents a decline of 98.96% over that period.
Fund Sentiment Score
The Fund Sentiment Score (fka Ownership Accumulation Score) finds the stocks that are being most bought by funds. It is the result of a sophisticated, multi-factor quantitative model that identifies companies with the highest levels of institutional accumulation. The scoring model uses a combination of the total increase in disclosed owners, the changes in portfolio allocations in those owners and other metrics. The number ranges from 0 to 100, with higher numbers indicating a higher level of accumulation to its peers, and 50 being the average.
Update Frequency: Daily
See Ownership Explorer, which provides a list of highest-ranking companies.
Institutional Put/Call Ratio
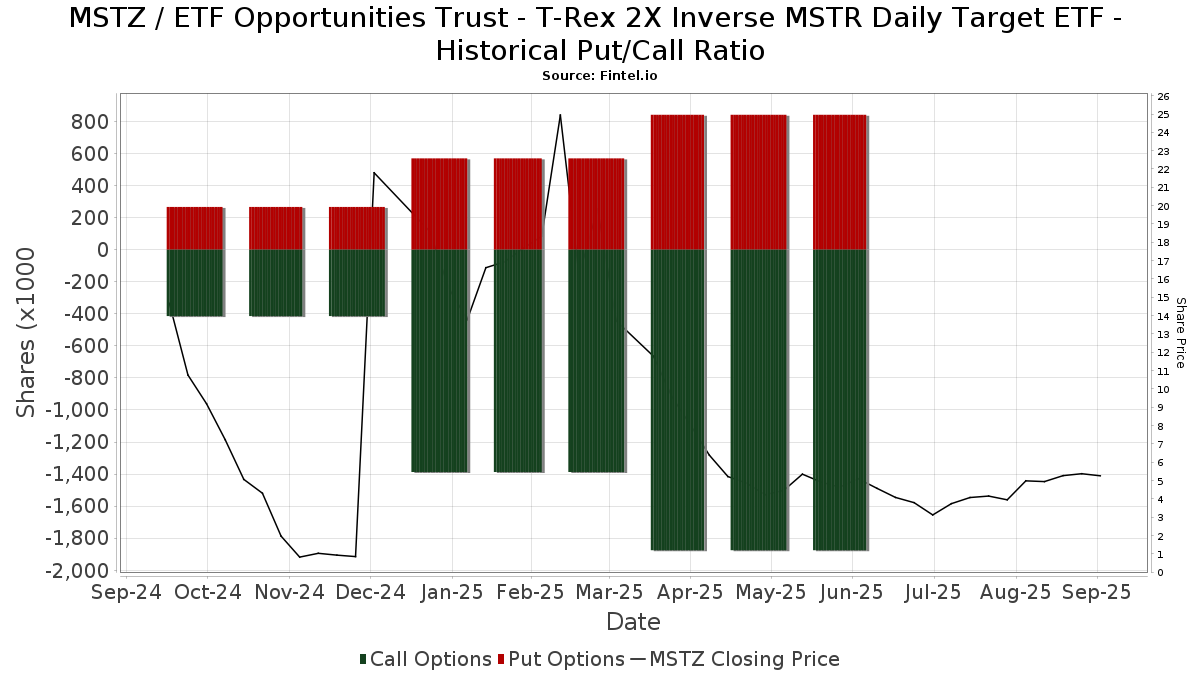
In addition to reporting standard equity and debt issues, institutions with more than 100MM assets under management must also disclose their put and call option holdings. Since put options generally indicate negative sentiment, and call options indicate positive sentiment, we can get a sense of the overall institutional sentiment by plotting the ratio of puts to calls. The chart to the right plots the historical put/call ratio for this instrument.
Using Put/Call Ratio as an indicator of investor sentiment overcomes one of the key deficiencies of using total institutional ownership, which is that a significant amount of assets under management are invested passively to track indices. Passively-managed funds do not typically buy options, so the put/call ratio indicator more closely tracks the sentiment of actively-managed funds.
13F and NPORT Filings
Detail on 13F filings are free. Detail on NP filings require a premium membership. Green rows indicate new positions. Red rows indicate closed positions. Click the link icon to see the full transaction history.
Upgrade
to unlock premium data and export to Excel ![]() .
.
| File Date | Source | Investor | Type | Avg Price (Est) |
Shares | Δ Shares (%) |
Reported Value ($1000) |
Δ Value (%) |
Port Alloc (%) |
|
|---|---|---|---|---|---|---|---|---|---|---|
| 2025-08-11 | 13F | Elequin Capital Lp | 368 | 0.00 | 2 | -80.00 | ||||
| 2025-08-14 | 13F | Federation des caisses Desjardins du Quebec | 1,500 | 87.50 | 6 | -45.45 | ||||
| 2025-08-21 | NP | PSPFX - Global Resources Fund | 100 | -98.04 | 0 | -100.00 | ||||
| 2025-08-14 | 13F | UBS Group AG | 0 | -100.00 | 0 | |||||
| 2025-08-18 | 13F/A | Hudson Bay Capital Management LP | Put | 270,500 | 1,131 | |||||
| 2025-08-08 | 13F | SBI Securities Co., Ltd. | 2,746 | 268.59 | 11 | 10.00 | ||||
| 2025-08-14 | 13F | Headlands Technologies LLC | 0 | -100.00 | 0 | -100.00 | ||||
| 2025-07-17 | 13F | Nelson, Van Denburg & Campbell Wealth Management Group, LLC | 67,000 | 280 | ||||||
| 2025-08-15 | 13F | Morgan Stanley | 29,198 | 392.38 | 122 | 46.99 | ||||
| 2025-08-01 | 13F | Belvedere Trading LLC | 25,051 | 65.50 | 105 | -50.94 | ||||
| 2025-04-25 | 13F | Tradewinds Capital Management, LLC | 0 | -100.00 | 0 | -100.00 | ||||
| 2025-08-01 | 13F | Belvedere Trading LLC | Call | 5,800 | 31.82 | 24 | -57.89 | |||
| 2025-08-01 | 13F | Belvedere Trading LLC | Put | 7,100 | 7,000.00 | 30 | ||||
| 2025-08-14 | 13F | Wellington Management Group Llp | 0 | -100.00 | 0 | |||||
| 2025-08-14 | 13F | Optiver Holding B.V. | 15,323 | -86.48 | 64 | -95.97 | ||||
| 2025-08-21 | NP | USERX - Gold and Precious Metals Fund | 400 | -98.40 | 2 | -99.71 | ||||
| 2025-05-15 | 13F | Scientech Research LLC | 0 | -100.00 | 0 | |||||
| 2025-08-13 | 13F | Advisor Group Holdings, Inc. | 0 | -100.00 | 0 | |||||
| 2025-08-14 | 13F | Susquehanna International Group, Llp | 0 | -100.00 | 0 | -100.00 | ||||
| 2025-08-14 | 13F | Citadel Advisors Llc | Call | 167,000 | -29.46 | 698 | -78.98 | |||
| 2025-08-14 | 13F | Citadel Advisors Llc | 187,522 | -39.99 | 784 | -82.14 | ||||
| 2025-08-14 | 13F | Citadel Advisors Llc | Put | 213,600 | -16.22 | 893 | -75.06 | |||
| 2025-08-13 | 13F | Jump Financial, LLC | 10,701 | -89.17 | 45 | -96.82 | ||||
| 2025-08-14 | 13F | Two Sigma Securities, Llc | 61,028 | 281.97 | 255 | 13.84 | ||||
| 2025-08-14 | 13F | Group One Trading, L.p. | 16,199 | 68 | ||||||
| 2025-08-18 | 13F | Wolverine Trading, Llc | Call | 15,900 | 74 | |||||
| 2025-08-12 | 13F | XTX Topco Ltd | 0 | -100.00 | 0 | |||||
| 2025-08-08 | 13F | Gts Securities Llc | 0 | -100.00 | 0 | |||||
| 2025-07-24 | 13F | U S Global Investors Inc | 600 | -98.31 | 3 | -99.60 | ||||
| 2025-05-07 | 13F | Nkcfo Llc | 0 | -100.00 | 0 | |||||
| 2025-04-30 | 13F | BCJ Capital Management, LLC | 0 | -100.00 | 0 | |||||
| 2025-08-14 | 13F | Jane Street Group, Llc | 0 | -100.00 | 0 | |||||
| 2025-08-14 | 13F | Susquehanna International Group, Llp | Put | 218,900 | 390.81 | 915 | 46.40 | |||
| 2025-08-14 | 13F | Susquehanna International Group, Llp | Call | 1,525,900 | 197.85 | 6,378 | -11.26 | |||
| 2025-08-12 | 13F | Proequities, Inc. | 0 | 0 | ||||||
| 2025-08-13 | 13F | StoneX Group Inc. | 50,832 | 212 | ||||||
| 2025-08-14 | 13F | Hrt Financial Lp | 56,650 | 0 | ||||||
| 2025-08-14 | 13F | Jane Street Group, Llc | Call | 161,100 | -74.58 | 673 | -92.43 | |||
| 2025-08-14 | 13F | Hunting Hill Global Capital, LLC | 48,674 | 0.00 | 203 | -70.23 | ||||
| 2025-08-21 | NP | UNWPX - World Precious Minerals Fund | 100 | -98.18 | 0 | -100.00 | ||||
| 2025-08-14 | 13F | Jane Street Group, Llc | Put | 132,100 | -51.15 | 552 | -85.45 | |||
| 2025-08-05 | 13F | Simplex Trading, Llc | 105,158 | 15,074.31 | 0 | |||||
| 2025-08-18 | 13F | Geneos Wealth Management Inc. | 17,806 | 74 | ||||||
| 2025-08-15 | 13F | Tower Research Capital LLC (TRC) | 9,995 | 9,895.00 | 42 | 4,000.00 |