Basic Stats
| Institutional Owners | 45 total, 39 long only, 2 short only, 4 long/short - change of 7.14% MRQ |
| Average Portfolio Allocation | 0.0420 % - change of 55.28% MRQ |
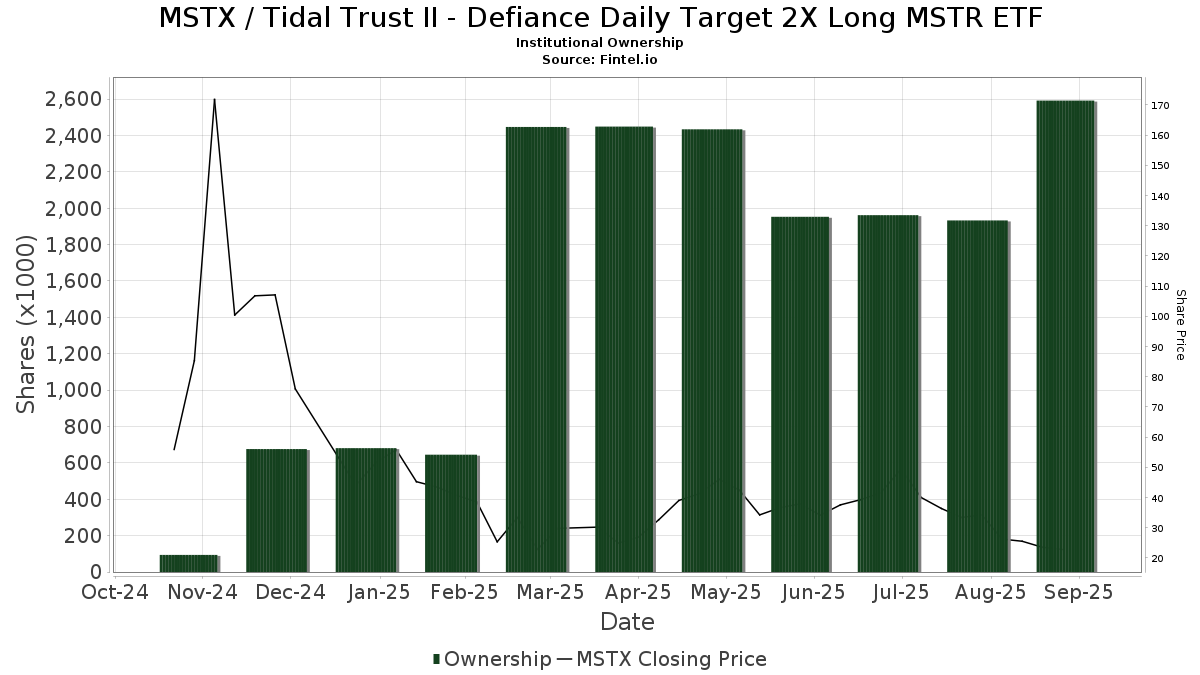
| Institutional Shares (Long) | 2,592,977 (ex 13D/G) - change of 0.64MM shares 32.73% MRQ |
| Institutional Value (Long) | $ 101,888 USD ($1000) |
Institutional Ownership and Shareholders
Tidal Trust II - Defiance Daily Target 2X Long MSTR ETF (US:MSTX) has 45 institutional owners and shareholders that have filed 13D/G or 13F forms with the Securities Exchange Commission (SEC). These institutions hold a total of 2,592,977 shares. Largest shareholders include Susquehanna International Group, Llp, Susquehanna International Group, Llp, Jane Street Group, Llc, UBS Group AG, Jane Street Group, Llc, Citadel Advisors Llc, Citadel Advisors Llc, Goldman Sachs Group Inc, Bnp Paribas Arbitrage, Sa, and LMR Partners LLP .
Tidal Trust II - Defiance Daily Target 2X Long MSTR ETF (NasdaqGM:MSTX) institutional ownership structure shows current positions in the company by institutions and funds, as well as latest changes in position size. Major shareholders can include individual investors, mutual funds, hedge funds, or institutions. The Schedule 13D indicates that the investor holds (or held) more than 5% of the company and intends (or intended) to actively pursue a change in business strategy. Schedule 13G indicates a passive investment of over 5%.
The share price as of September 5, 2025 is 24.23 / share. Previously, on September 6, 2024, the share price was 15.36 / share. This represents an increase of 57.75% over that period.
Fund Sentiment Score
The Fund Sentiment Score (fka Ownership Accumulation Score) finds the stocks that are being most bought by funds. It is the result of a sophisticated, multi-factor quantitative model that identifies companies with the highest levels of institutional accumulation. The scoring model uses a combination of the total increase in disclosed owners, the changes in portfolio allocations in those owners and other metrics. The number ranges from 0 to 100, with higher numbers indicating a higher level of accumulation to its peers, and 50 being the average.
Update Frequency: Daily
See Ownership Explorer, which provides a list of highest-ranking companies.
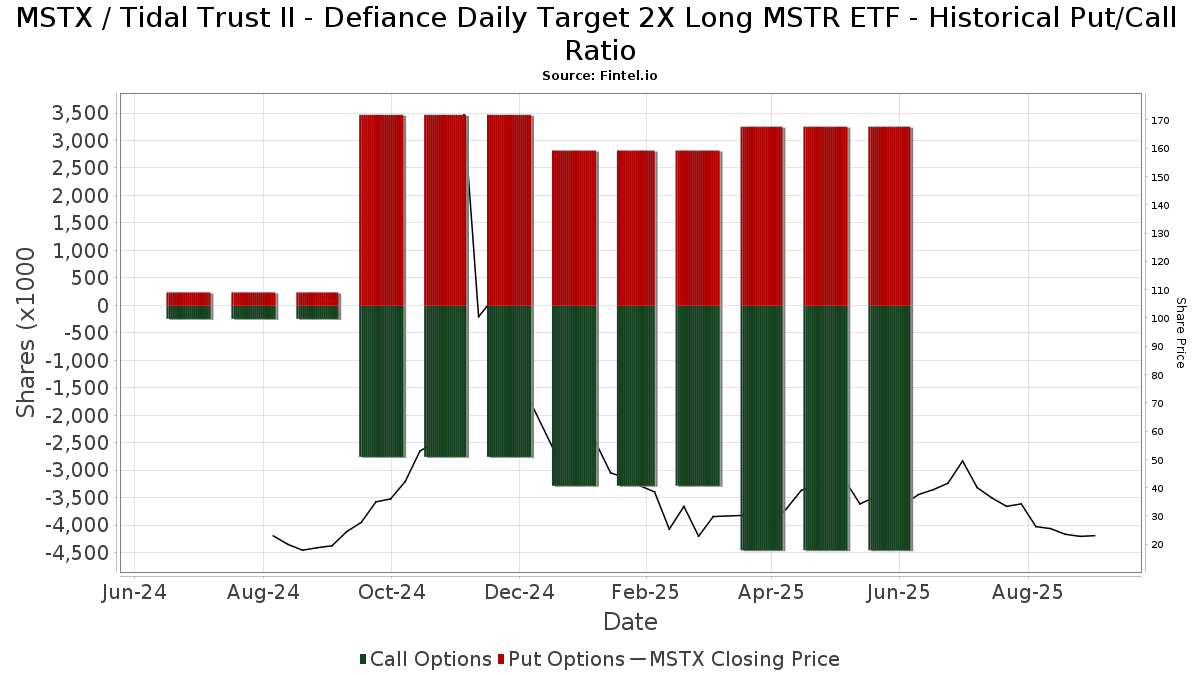
Institutional Put/Call Ratio
In addition to reporting standard equity and debt issues, institutions with more than 100MM assets under management must also disclose their put and call option holdings. Since put options generally indicate negative sentiment, and call options indicate positive sentiment, we can get a sense of the overall institutional sentiment by plotting the ratio of puts to calls. The chart to the right plots the historical put/call ratio for this instrument.
Using Put/Call Ratio as an indicator of investor sentiment overcomes one of the key deficiencies of using total institutional ownership, which is that a significant amount of assets under management are invested passively to track indices. Passively-managed funds do not typically buy options, so the put/call ratio indicator more closely tracks the sentiment of actively-managed funds.
13F and NPORT Filings
Detail on 13F filings are free. Detail on NP filings require a premium membership. Green rows indicate new positions. Red rows indicate closed positions. Click the link icon to see the full transaction history.
Upgrade
to unlock premium data and export to Excel ![]() .
.
| File Date | Source | Investor | Type | Avg Price (Est) |
Shares | Δ Shares (%) |
Reported Value ($1000) |
Δ Value (%) |
Port Alloc (%) |
|
|---|---|---|---|---|---|---|---|---|---|---|
| 2025-08-14 | 13F | UBS Group AG | 1,077,463 | 77.45 | 43,486 | 177.60 | ||||
| 2025-05-12 | 13F | Traynor Capital Management, Inc. | Put | 0 | -100.00 | 0 | ||||
| 2025-05-12 | 13F | Traynor Capital Management, Inc. | Call | 0 | -100.00 | 0 | ||||
| 2025-08-14 | 13F | Ionic Capital Management LLC | Put | 5,300 | -48.54 | 214 | -19.62 | |||
| 2025-08-14 | 13F | Citadel Advisors Llc | 114,633 | 449.51 | 4,627 | 759.85 | ||||
| 2025-08-14 | 13F | Citadel Advisors Llc | Put | 888,400 | 58.50 | 35,856 | 147.96 | |||
| 2025-05-15 | 13F | Wolverine Trading, Llc | 0 | -100.00 | 0 | -100.00 | ||||
| 2025-08-14 | 13F | Citadel Advisors Llc | Call | 649,200 | -3.55 | 26,202 | 50.88 | |||
| 2025-08-11 | 13F | Copperleaf Capital, LLC | 17,500 | 0.00 | 706 | 56.54 | ||||
| 2025-07-09 | 13F | Massmutual Trust Co Fsb/adv | 1,530 | 0.00 | 62 | 56.41 | ||||
| 2025-08-14 | 13F | Scientech Research LLC | 16,870 | -69.30 | 681 | -52.01 | ||||
| 2025-08-14 | 13F | Headlands Technologies LLC | 18 | -92.44 | 1 | -100.00 | ||||
| 2025-04-16 | 13F | Matauro, Llc | 0 | -100.00 | 0 | |||||
| 2025-08-11 | 13F | HighTower Advisors, LLC | 5,606 | 226 | ||||||
| 2025-08-14 | 13F | Goldman Sachs Group Inc | 400,000 | 16,144 | ||||||
| 2025-07-24 | 13F | IFP Advisors, Inc | 38 | -97.71 | 2 | -97.62 | ||||
| 2025-08-14 | 13F | TCG Advisory Services, LLC | 35,081 | -22.18 | 1,416 | 21.67 | ||||
| 2025-08-14 | 13F | Bnp Paribas Arbitrage, Sa | 315,300 | 12,726 | ||||||
| 2025-07-08 | 13F | Parallel Advisors, LLC | 200 | 29.03 | 8 | 166.67 | ||||
| 2025-08-14 | 13F | Jane Street Group, Llc | Put | 947,500 | -2.78 | 38,241 | 52.09 | |||
| 2025-08-14 | 13F | LMR Partners LLP | Put | 248,400 | -31.21 | 10,025 | 7.61 | |||
| 2025-07-18 | 13F | PFG Investments, LLC | 5,000 | 202 | ||||||
| 2025-07-16 | 13F | Tru Independence Asset Management 2, Llc | 6,000 | 242 | ||||||
| 2025-04-21 | 13F | Nelson, Van Denburg & Campbell Wealth Management Group, LLC | 0 | -100.00 | 0 | |||||
| 2025-08-06 | 13F | Legacy Wealth Managment, LLC/ID | 0 | -100.00 | 0 | |||||
| 2025-08-14 | 13F | Diversify Wealth Management, Llc | 15,000 | 0.00 | 525 | -11.17 | ||||
| 2025-08-14 | 13F | Jane Street Group, Llc | Call | 1,112,100 | -16.22 | 44,884 | 31.06 | |||
| 2025-07-14 | 13F | Narus Financial Partners, LLC | 0 | -100.00 | 0 | |||||
| 2025-08-14 | 13F | Mariner, LLC | 38,181 | 2.37 | 1,541 | 60.08 | ||||
| 2025-08-14 | 13F | Beaird Harris Wealth Management, LLC | 1,093 | 0.00 | 44 | 57.14 | ||||
| 2025-08-06 | 13F | Legacy Investment Solutions, LLC | 0 | -100.00 | 0 | |||||
| 2025-08-14 | 13F | Old Mission Capital Llc | 0 | -100.00 | 0 | |||||
| 2025-08-13 | 13F | Centiva Capital, LP | 0 | -100.00 | 0 | -100.00 | ||||
| 2025-07-17 | 13F | Sterling Investment Advisors, Ltd. | 7,816 | 315 | ||||||
| 2025-08-12 | 13F | Vestor Capital, Llc | 66,121 | 1,765.72 | 3 | |||||
| 2025-08-12 | 13F | Global Retirement Partners, LLC | 245 | -69.18 | 10 | -66.67 | ||||
| 2025-08-08 | 13F | Hartland & Co., LLC | 0 | -100.00 | 0 | |||||
| 2025-07-28 | 13F | Sagespring Wealth Partners, Llc | 20,039 | 0.32 | 809 | 56.89 | ||||
| 2025-07-29 | 13F | Activest Wealth Management | 943 | 0.00 | 38 | 58.33 | ||||
| 2025-08-14 | 13F | Optiver Holding B.V. | 52,932 | -37.72 | 2,136 | -2.55 | ||||
| 2025-08-18 | 13F | Wolverine Trading, Llc | Call | 0 | -100.00 | 0 | ||||
| 2025-08-14 | 13F | Group One Trading, L.p. | 0 | -100.00 | 0 | |||||
| 2025-08-18 | 13F | 1248 Management, LLC | 9,132 | 1.46 | 369 | 58.62 | ||||
| 2025-08-11 | 13F | Aptus Capital Advisors, LLC | 557 | 22 | ||||||
| 2025-05-13 | 13F | Ground Swell Capital, LLC | 0 | -100.00 | 0 | |||||
| 2025-08-01 | 13F | Belvedere Trading LLC | 3,175 | -44.10 | 128 | -12.33 | ||||
| 2025-08-05 | 13F | Simplex Trading, Llc | 0 | -100.00 | 0 | |||||
| 2025-08-11 | 13F | Citigroup Inc | 193,701 | 0.00 | 7,818 | 56.43 | ||||
| 2025-08-01 | 13F | Belvedere Trading LLC | Call | 12,600 | -81.14 | 509 | -76.04 | |||
| 2025-08-01 | 13F | Belvedere Trading LLC | Put | 500 | -97.47 | 20 | -97.46 | |||
| 2025-08-13 | 13F | Centiva Capital, LP | Call | 9,500 | -83.68 | 383 | -74.48 | |||
| 2025-08-12 | 13F | Park Square Financial Group, LLC | 2,050 | 0.00 | 83 | 57.69 | ||||
| 2025-08-15 | 13F | Tower Research Capital LLC (TRC) | 3 | -99.41 | 0 | -100.00 | ||||
| 2025-08-04 | 13F | Spire Wealth Management | 920 | 37 | ||||||
| 2025-08-14 | 13F | Bank Of America Corp /de/ | 1,006 | -9.94 | 41 | 42.86 | ||||
| 2025-08-14 | 13F | Jane Street Group, Llc | 6,748 | -97.79 | 272 | -96.55 | ||||
| 2025-08-08 | 13F | Larson Financial Group LLC | 101 | 0.00 | 4 | 100.00 | ||||
| 2025-08-18 | 13F | Wolverine Trading, Llc | Put | 0 | -100.00 | 0 | ||||
| 2025-08-14 | 13F | LMR Partners LLP | 0 | -100.00 | 0 | |||||
| 2025-08-12 | 13F | Proequities, Inc. | 0 | 0 | ||||||
| 2025-07-22 | 13F | IMC-Chicago, LLC | 0 | -100.00 | 0 | |||||
| 2025-08-12 | 13F | J.w. Cole Advisors, Inc. | 0 | -100.00 | 0 | |||||
| 2025-08-14 | 13F | Susquehanna International Group, Llp | 33,763 | -86.92 | 1,363 | -79.55 | ||||
| 2025-08-14 | 13F | Susquehanna International Group, Llp | Call | 2,672,900 | 142.70 | 107,878 | 279.68 | |||
| 2025-08-14 | 13F | Susquehanna International Group, Llp | Put | 1,162,200 | 63.48 | 46,906 | 155.74 | |||
| 2025-08-15 | 13F | Morgan Stanley | 10,943 | -74.02 | 442 | -59.39 | ||||
| 2025-08-18 | 13F | Tactive Advisors, LLC | 11,590 | 468 | ||||||
| 2025-07-28 | 13F | Acorn Financial Advisory Services Inc /adv | 50,559 | -35.62 | 2,041 | 0.69 | ||||
| 2025-05-12 | 13F | Traynor Capital Management, Inc. | 0 | -100.00 | 0 | |||||
| 2025-07-21 | 13F | Clarity Capital Partners LLC | 12,862 | 53.67 | 519 | 141.40 | ||||
| 2025-05-15 | 13F | Hrt Financial Lp | 0 | -100.00 | 0 | |||||
| 2025-08-13 | 13F | Renaissance Technologies Llc | 49,900 | 2,014 | ||||||
| 2025-08-14 | 13F | Bank Of America Corp /de/ | Put | 0 | -100.00 | 0 | -100.00 | |||
| 2025-07-11 | 13F | Farther Finance Advisors, LLC | 450 | 80.00 | 18 | 157.14 | ||||
| 2025-05-15 | 13F | RBF Capital, LLC | 0 | -100.00 | 0 | |||||
| 2025-08-14 | 13F | Ionic Capital Management LLC | 0 | -100.00 | 0 | -100.00 | ||||
| 2025-07-16 | 13F | Twelve Points Wealth Management LLC | 7,808 | 315 | ||||||
| 2025-07-16 | 13F | Signaturefd, Llc | 100 | 4 | ||||||
| 2025-08-13 | 13F | Centiva Capital, LP | Put | 0 | -100.00 | 0 | -100.00 |