Basic Stats
| Institutional Owners | 80 total, 77 long only, 0 short only, 3 long/short - change of 3.90% MRQ |
| Average Portfolio Allocation | 0.0284 % - change of -25.48% MRQ |
| Institutional Shares (Long) | 4,590,997 (ex 13D/G) - change of -0.68MM shares -12.92% MRQ |
| Institutional Value (Long) | $ 42,902 USD ($1000) |
Institutional Ownership and Shareholders
Mesoblast Limited - Depositary Receipt (Common Stock) (US:MESO) has 80 institutional owners and shareholders that have filed 13D/G or 13F forms with the Securities Exchange Commission (SEC). These institutions hold a total of 4,590,997 shares. Largest shareholders include QCSTRX - Stock Account Class R1, BlackRock, Inc., Morgan Stanley, IBB - iShares Nasdaq Biotechnology ETF, Goldman Sachs Group Inc, Susquehanna International Group, Llp, Summit X, LLC, UBS Group AG, Susquehanna International Group, Llp, and Citadel Advisors Llc .
Mesoblast Limited - Depositary Receipt (Common Stock) (NasdaqGS:MESO) institutional ownership structure shows current positions in the company by institutions and funds, as well as latest changes in position size. Major shareholders can include individual investors, mutual funds, hedge funds, or institutions. The Schedule 13D indicates that the investor holds (or held) more than 5% of the company and intends (or intended) to actively pursue a change in business strategy. Schedule 13G indicates a passive investment of over 5%.
The share price as of September 5, 2025 is 14.38 / share. Previously, on September 6, 2024, the share price was 6.10 / share. This represents an increase of 135.74% over that period.

Fund Sentiment Score
The Fund Sentiment Score (fka Ownership Accumulation Score) finds the stocks that are being most bought by funds. It is the result of a sophisticated, multi-factor quantitative model that identifies companies with the highest levels of institutional accumulation. The scoring model uses a combination of the total increase in disclosed owners, the changes in portfolio allocations in those owners and other metrics. The number ranges from 0 to 100, with higher numbers indicating a higher level of accumulation to its peers, and 50 being the average.
Update Frequency: Daily
See Ownership Explorer, which provides a list of highest-ranking companies.
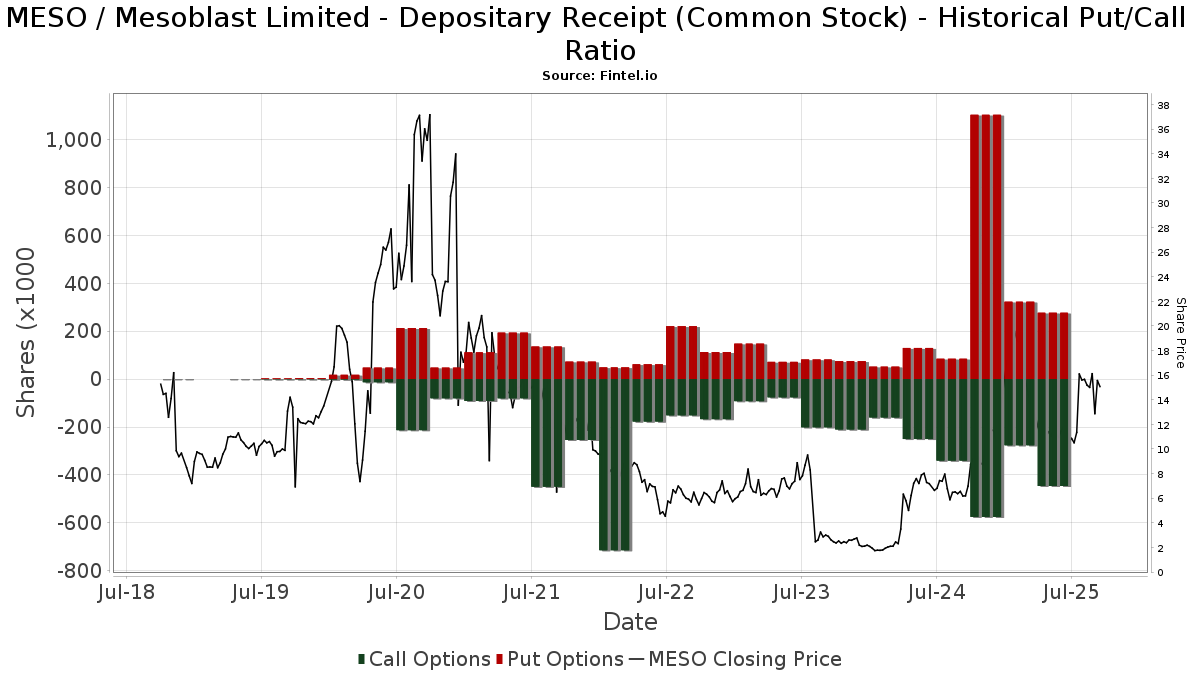
Institutional Put/Call Ratio
In addition to reporting standard equity and debt issues, institutions with more than 100MM assets under management must also disclose their put and call option holdings. Since put options generally indicate negative sentiment, and call options indicate positive sentiment, we can get a sense of the overall institutional sentiment by plotting the ratio of puts to calls. The chart to the right plots the historical put/call ratio for this instrument.
Using Put/Call Ratio as an indicator of investor sentiment overcomes one of the key deficiencies of using total institutional ownership, which is that a significant amount of assets under management are invested passively to track indices. Passively-managed funds do not typically buy options, so the put/call ratio indicator more closely tracks the sentiment of actively-managed funds.
13F and NPORT Filings
Detail on 13F filings are free. Detail on NP filings require a premium membership. Green rows indicate new positions. Red rows indicate closed positions. Click the link icon to see the full transaction history.
Upgrade
to unlock premium data and export to Excel ![]() .
.
| File Date | Source | Investor | Type | Avg Price (Est) |
Shares | Δ Shares (%) |
Reported Value ($1000) |
Δ Value (%) |
Port Alloc (%) |
|
|---|---|---|---|---|---|---|---|---|---|---|
| 2025-08-14 | 13F | Bnp Paribas Arbitrage, Sa | 6,082 | -31.46 | 66 | -40.00 | ||||
| 2025-08-28 | NP | IBB - iShares Nasdaq Biotechnology ETF | 500,796 | -12.48 | 5,454 | -23.63 | ||||
| 2025-08-14 | 13F | Cubist Systematic Strategies, LLC | 12,204 | -83.02 | 133 | -85.28 | ||||
| 2025-05-15 | 13F | Oaktree Capital Management Lp | 0 | -100.00 | 0 | |||||
| 2025-07-28 | 13F | BRYN MAWR TRUST Co | 858 | 0.00 | 9 | -10.00 | ||||
| 2025-08-07 | 13F | Allworth Financial LP | 145 | 2 | ||||||
| 2025-08-14 | 13F | Verition Fund Management LLC | 28,844 | 314 | ||||||
| 2025-08-19 | 13F | Marex Group plc | Put | 100,000 | 1,089 | |||||
| 2025-08-19 | 13F | Marex Group plc | 100,000 | 1,089 | ||||||
| 2025-05-14 | 13F | Jump Financial, LLC | 0 | -100.00 | 0 | |||||
| 2025-08-12 | 13F | LPL Financial LLC | Call | 10,000 | 0.00 | 109 | -12.90 | |||
| 2025-08-12 | 13F | LPL Financial LLC | 50,047 | 25.10 | 545 | 9.22 | ||||
| 2025-08-14 | 13F | Oasis Management Co Ltd. | 29,524 | -28.77 | 322 | -37.91 | ||||
| 2025-08-14 | 13F | Cantor Fitzgerald, L. P. | 10,147 | 111 | ||||||
| 2025-08-07 | 13F | Summit X, LLC | 199,295 | 0.57 | 2,170 | -12.25 | ||||
| 2025-08-13 | 13F | Tobias Financial Advisors, Inc. | 10,000 | 0.00 | 109 | -12.90 | ||||
| 2025-08-14 | 13F | Millennium Management Llc | 32,283 | 88.55 | 352 | 64.79 | ||||
| 2025-09-04 | 13F/A | Advisor Group Holdings, Inc. | 857 | -0.23 | 9 | -10.00 | ||||
| 2025-08-07 | 13F | Zurcher Kantonalbank (Zurich Cantonalbank) | 633 | 0.00 | 7 | -14.29 | ||||
| 2025-08-07 | 13F | Rathbone Brothers plc | 14,017 | 0.00 | 153 | -12.64 | ||||
| 2025-08-28 | 13F | China Universal Asset Management Co., Ltd. | 9,124 | 33.74 | 99 | 16.47 | ||||
| 2025-07-24 | NP | FNCMX - Fidelity Nasdaq Composite Index Fund This fund is a listed as child fund of Fmr Llc and if that institution has disclosed ownership in this security, then these positions will not be double counted when calculating total shares and total value | 18,245 | 0.00 | 194 | -37.82 | ||||
| 2025-08-14 | 13F | Jane Street Group, Llc | 0 | -100.00 | 0 | |||||
| 2025-08-13 | 13F | Quadrant Capital Group Llc | 0 | -100.00 | 0 | |||||
| 2025-05-05 | 13F | Lindbrook Capital, Llc | 2,253 | 3.73 | 28 | -34.88 | ||||
| 2025-08-14 | 13F | Banque Transatlantique SA | 0 | -100.00 | 0 | |||||
| 2025-05-08 | 13F | XTX Topco Ltd | 0 | -100.00 | 0 | |||||
| 2025-08-15 | 13F | Tower Research Capital LLC (TRC) | 648 | -80.55 | 7 | -82.93 | ||||
| 2025-08-08 | 13F | SBI Securities Co., Ltd. | 4 | 0.00 | 0 | |||||
| 2025-08-13 | 13F | Fi3 FINANCIAL ADVISORS, LLC | 36,625 | 0.00 | 399 | -12.91 | ||||
| 2025-07-15 | 13F | Ballentine Partners, LLC | 11,414 | 124 | ||||||
| 2025-05-08 | NP | QGBLX - Quantified Global Fund Investor Class | 4,578 | 224.91 | 57 | 111.11 | ||||
| 2025-08-14 | 13F | Jane Street Group, Llc | Call | 137,500 | 631.38 | 1,497 | 539.74 | |||
| 2025-07-24 | 13F | Us Bancorp \de\ | 410 | -62.32 | 4 | -69.23 | ||||
| 2025-08-08 | 13F | Geode Capital Management, Llc | 18,320 | 0.41 | 200 | -12.33 | ||||
| 2025-07-14 | 13F | Clayton Financial Group LLC | 0 | -100.00 | 0 | |||||
| 2025-08-11 | 13F | Citigroup Inc | 25,866 | 1.45 | 282 | -11.64 | ||||
| 2025-08-08 | 13F | Creative Planning | 12,964 | 141 | ||||||
| 2025-08-14 | 13F | UBS Group AG | 193,987 | 38.07 | 2,113 | 20.48 | ||||
| 2025-07-16 | 13F | Signaturefd, Llc | 7,123 | -25.19 | 78 | -34.75 | ||||
| 2025-08-12 | 13F | Jpmorgan Chase & Co | 1,819 | -16.71 | 20 | -29.63 | ||||
| 2025-07-21 | 13F | Mirae Asset Global Investments Co., Ltd. | 1,755 | 54.22 | 19 | 46.15 | ||||
| 2025-07-24 | 13F | Strengthening Families & Communities, LLC | 10 | 0 | ||||||
| 2025-08-12 | 13F | Rhumbline Advisers | 6,094 | 4.47 | 66 | -8.33 | ||||
| 2025-08-14 | 13F | Toronto Dominion Bank | 0 | -100.00 | 0 | |||||
| 2025-08-12 | 13F | BlackRock, Inc. | 656,834 | -8.13 | 7,153 | -19.84 | ||||
| 2025-07-28 | NP | IBBQ - Invesco Nasdaq Biotechnology ETF This fund is a listed as child fund of Invesco Ltd. and if that institution has disclosed ownership in this security, then these positions will not be double counted when calculating total shares and total value | 1,334 | 9.61 | 14 | -30.00 | ||||
| 2025-07-22 | 13F | Gf Fund Management Co. Ltd. | 817 | 0.00 | 9 | -20.00 | ||||
| 2025-08-14 | 13F | Two Sigma Investments, Lp | 33,213 | 362 | ||||||
| 2025-07-30 | NP | APIE - ActivePassive International Equity ETF | 4,190 | -50.60 | 45 | -69.66 | ||||
| 2025-07-21 | 13F | Sageworth Trust Co | 0 | -100.00 | 0 | |||||
| 2025-08-13 | 13F | Rsm Us Wealth Management Llc | 10,625 | 3.41 | 116 | -10.16 | ||||
| 2025-08-14 | 13F | XY Capital Ltd | 0 | -100.00 | 0 | |||||
| 2025-05-14 | 13F | Affinity Asset Advisors, LLC | Put | 0 | -100.00 | 0 | ||||
| 2025-05-14 | 13F | EntryPoint Capital, LLC | 0 | -100.00 | 0 | |||||
| 2025-08-14 | 13F | Wells Fargo & Company/mn | 25,335 | -4.91 | 276 | -17.17 | ||||
| 2025-05-15 | 13F | Oaktree Fund Advisors, LLC | 0 | -100.00 | 0 | |||||
| 2025-08-12 | 13F | MAI Capital Management | 223 | 2 | ||||||
| 2025-04-28 | 13F | Strategic Financial Concepts, LLC | 0 | -100.00 | 0 | -100.00 | ||||
| 2025-08-12 | 13F | Steward Partners Investment Advisory, Llc | 128 | 0.00 | 1 | 0.00 | ||||
| 2025-08-15 | 13F | Morgan Stanley | 504,391 | -7.38 | 5,493 | -19.19 | ||||
| 2025-07-08 | 13F | Parallel Advisors, LLC | 933 | 23.09 | 10 | 11.11 | ||||
| 2025-08-12 | 13F | Deutsche Bank Ag\ | 1,402 | 15 | ||||||
| 2025-08-14 | 13F | Point72 Asset Management, L.P. | 0 | -100.00 | 0 | |||||
| 2025-08-13 | 13F | Jones Financial Companies Lllp | 300 | 3 | ||||||
| 2025-07-28 | NP | BIB - ProShares Ultra Nasdaq Biotechnology | 1,251 | -9.54 | 13 | -43.48 | ||||
| 2025-08-12 | 13F | Proequities, Inc. | 0 | 0 | ||||||
| 2025-08-28 | NP | QCSTRX - Stock Account Class R1 | 693,498 | -13.11 | 754 | -23.68 | ||||
| 2025-08-05 | 13F | Simplex Trading, Llc | 10,673 | -33.57 | 0 | |||||
| 2025-07-28 | 13F/A | Penbrook Management LLC | 87,675 | 0.00 | 955 | -12.80 | ||||
| 2025-08-11 | 13F | Rockbridge Investment Management, LCC | 49,150 | 0.00 | 535 | -12.72 | ||||
| 2025-08-13 | 13F | Marshall Wace, Llp | 40,710 | -43.18 | 443 | -50.45 | ||||
| 2025-07-14 | 13F | Chapin Davis, Inc. | 15,000 | 0.00 | 163 | -12.83 | ||||
| 2025-08-14 | 13F/A | Barclays Plc | 3,571 | 39.66 | 0 | |||||
| 2025-07-14 | 13F | UMA Financial Services, Inc. | 57 | 1 | ||||||
| 2025-08-14 | 13F | Old Mission Capital Llc | 0 | -100.00 | 0 | |||||
| 2025-08-14 | 13F | Susquehanna International Group, Llp | Call | 158,000 | 62.55 | 1,721 | 41.80 | |||
| 2025-08-18 | 13F/A | National Bank Of Canada /fi/ | 525 | 0.00 | 6 | -16.67 | ||||
| 2025-07-17 | 13F | Lazari Capital Management, Inc. | 46,471 | 2.21 | 506 | -10.76 | ||||
| 2025-06-26 | NP | DFIEX - International Core Equity Portfolio - Institutional Class This fund is a listed as child fund of Dimensional Fund Advisors Lp and if that institution has disclosed ownership in this security, then these positions will not be double counted when calculating total shares and total value | 796 | 0.00 | 9 | -43.75 | ||||
| 2025-08-14 | 13F | Citadel Advisors Llc | Call | 141,350 | -6.36 | 1,539 | -18.27 | |||
| 2025-08-14 | 13F | Citadel Advisors Llc | 74,636 | -84.67 | 813 | -86.63 | ||||
| 2025-08-14 | 13F | Susquehanna International Group, Llp | Put | 113,600 | -52.82 | 1,237 | -58.84 | |||
| 2025-08-14 | 13F | Citadel Advisors Llc | Put | 63,400 | -23.34 | 690 | -33.14 | |||
| 2025-08-14 | 13F | Susquehanna International Group, Llp | 234,587 | -10.10 | 2,555 | -21.56 | ||||
| 2025-07-31 | 13F | Caitong International Asset Management Co., Ltd | 510 | 88.19 | 6 | 66.67 | ||||
| 2025-08-14 | 13F | Raymond James Financial Inc | 7,892 | 86 | ||||||
| 2025-08-14 | 13F | Daiwa Securities Group Inc. | 105 | 0.00 | 0 | |||||
| 2025-08-15 | 13F | WealthCollab, LLC | 73 | 1 | ||||||
| 2025-07-25 | 13F | JustInvest LLC | 13,331 | 26.97 | 145 | 10.69 | ||||
| 2025-08-14 | 13F | Aqr Capital Management Llc | 13,932 | 152 | ||||||
| 2025-08-05 | 13F | Advisors Preferred, LLC | 0 | -100.00 | 0 | |||||
| 2025-08-08 | 13F | Thoroughbred Financial Services, Llc | 0 | -100.00 | 0 | |||||
| 2025-08-13 | 13F | EverSource Wealth Advisors, LLC | 159 | -46.46 | 2 | -66.67 | ||||
| 2025-08-14 | 13F | Bank Of America Corp /de/ | 12,499 | -65.85 | 136 | -70.18 | ||||
| 2025-07-31 | 13F | R Squared Ltd | 11,571 | 126 | ||||||
| 2025-08-05 | 13F | Prosperity Wealth Management, Inc. | 50,100 | 2.87 | 546 | -10.21 | ||||
| 2025-07-14 | 13F | GAMMA Investing LLC | 6,838 | -0.20 | 74 | -12.94 | ||||
| 2025-08-14 | 13F | Goldman Sachs Group Inc | 415,465 | 61.57 | 4,524 | 40.98 | ||||
| 2025-08-14 | 13F | Royal Bank Of Canada | 85,674 | 756.74 | 933 | 646.40 | ||||
| 2025-07-15 | 13F | Compagnie Lombard Odier SCmA | 1,000 | 0.00 | 11 | -16.67 | ||||
| 2025-08-14 | 13F | Visionary Wealth Advisors | 10,901 | 0.00 | 119 | -13.24 | ||||
| 2025-08-27 | 13F/A | Squarepoint Ops LLC | 14,603 | -3.03 | 159 | -14.97 | ||||
| 2025-07-31 | 13F | Cambridge Investment Research Advisors, Inc. | 10,146 | -11.08 | 0 | |||||
| 2025-08-14 | 13F | Group One Trading, L.p. | 90,902 | -39.89 | 990 | -47.59 | ||||
| 2025-05-15 | 13F | Sio Capital Management, LLC | 0 | -100.00 | 0 | |||||
| 2025-07-15 | 13F | SJS Investment Consulting Inc. | 0 | -100.00 | 0 |
Other Listings
| DE:LWB1 |