Basic Stats
| Institutional Owners | 90 total, 90 long only, 0 short only, 0 long/short - change of 0.00% MRQ |
| Average Portfolio Allocation | 0.0899 % - change of -16.99% MRQ |
| Institutional Shares (Long) | 2,857,110 (ex 13D/G) - change of -0.14MM shares -4.72% MRQ |
| Institutional Value (Long) | $ 78,441 USD ($1000) |
Institutional Ownership and Shareholders
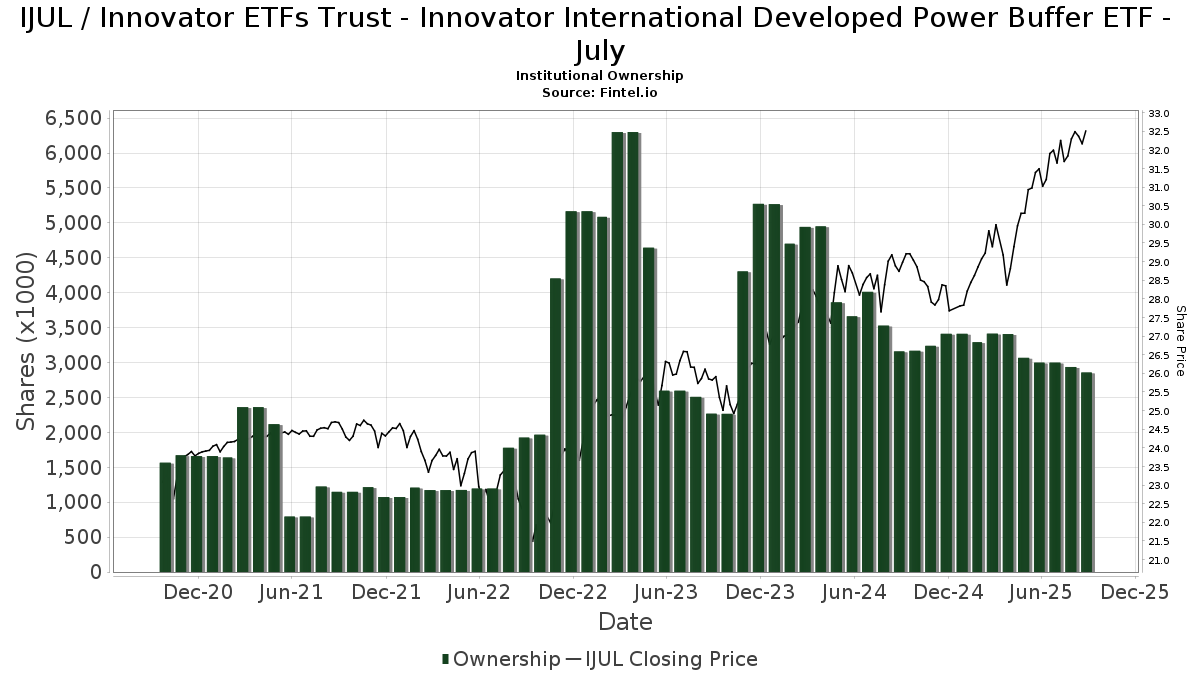
Innovator ETFs Trust - Innovator International Developed Power Buffer ETF - July (US:IJUL) has 90 institutional owners and shareholders that have filed 13D/G or 13F forms with the Securities Exchange Commission (SEC). These institutions hold a total of 2,857,110 shares. Largest shareholders include Advisor Group Holdings, Inc., Berger Financial Group, Inc, Envestnet Asset Management Inc, Global Strategic Investment Solutions, LLC, Commonwealth Equity Services, Llc, Blair William & Co/il, Mml Investors Services, Llc, Cetera Investment Advisers, Americana Partners, LLC, and Bedel Financial Consulting, Inc. .
Innovator ETFs Trust - Innovator International Developed Power Buffer ETF - July (ARCA:IJUL) institutional ownership structure shows current positions in the company by institutions and funds, as well as latest changes in position size. Major shareholders can include individual investors, mutual funds, hedge funds, or institutions. The Schedule 13D indicates that the investor holds (or held) more than 5% of the company and intends (or intended) to actively pursue a change in business strategy. Schedule 13G indicates a passive investment of over 5%.
The share price as of September 9, 2025 is 32.53 / share. Previously, on September 10, 2024, the share price was 28.63 / share. This represents an increase of 13.63% over that period.
Fund Sentiment Score
The Fund Sentiment Score (fka Ownership Accumulation Score) finds the stocks that are being most bought by funds. It is the result of a sophisticated, multi-factor quantitative model that identifies companies with the highest levels of institutional accumulation. The scoring model uses a combination of the total increase in disclosed owners, the changes in portfolio allocations in those owners and other metrics. The number ranges from 0 to 100, with higher numbers indicating a higher level of accumulation to its peers, and 50 being the average.
Update Frequency: Daily
See Ownership Explorer, which provides a list of highest-ranking companies.
Institutional Put/Call Ratio
In addition to reporting standard equity and debt issues, institutions with more than 100MM assets under management must also disclose their put and call option holdings. Since put options generally indicate negative sentiment, and call options indicate positive sentiment, we can get a sense of the overall institutional sentiment by plotting the ratio of puts to calls. The chart to the right plots the historical put/call ratio for this instrument.
Using Put/Call Ratio as an indicator of investor sentiment overcomes one of the key deficiencies of using total institutional ownership, which is that a significant amount of assets under management are invested passively to track indices. Passively-managed funds do not typically buy options, so the put/call ratio indicator more closely tracks the sentiment of actively-managed funds.
13F and NPORT Filings
Detail on 13F filings are free. Detail on NP filings require a premium membership. Green rows indicate new positions. Red rows indicate closed positions. Click the link icon to see the full transaction history.
Upgrade
to unlock premium data and export to Excel ![]() .
.
| File Date | Source | Investor | Type | Avg Price (Est) |
Shares | Δ Shares (%) |
Reported Value ($1000) |
Δ Value (%) |
Port Alloc (%) |
|
|---|---|---|---|---|---|---|---|---|---|---|
| 2025-05-14 | 13F | Jane Street Group, Llc | 0 | -100.00 | 0 | |||||
| 2025-08-11 | 13F | Atlantic Private Wealth, LLC | 0 | -100.00 | 0 | |||||
| 2025-07-22 | 13F | Siligmueller & Norvid Wealth Advisors LLC | 38,022 | 0.00 | 1,203 | 8.67 | ||||
| 2025-08-08 | 13F | Bailard, Inc. | 8,525 | 0.00 | 272 | 9.68 | ||||
| 2025-07-22 | 13F | Merit Financial Group, LLC | 28,486 | 910 | ||||||
| 2025-08-11 | 13F | Summit Wealth Partners, LLC | 8,495 | -12.09 | 271 | -3.56 | ||||
| 2025-05-14 | 13F/A | Morgan Stanley | 0 | -100.00 | 0 | -100.00 | ||||
| 2025-08-06 | 13F | AE Wealth Management LLC | 23 | 0.00 | 1 | |||||
| 2025-04-18 | 13F | Global Trust Asset Management, LLC | 0 | -100.00 | 0 | |||||
| 2025-07-30 | 13F | Strategic Blueprint, LLC | 43,007 | -10.25 | 1,374 | -1.58 | ||||
| 2025-08-14 | 13F | Old Mission Capital Llc | 0 | -100.00 | 0 | |||||
| 2025-07-11 | 13F | Farther Finance Advisors, LLC | 0 | -100.00 | 0 | |||||
| 2025-08-14 | 13F | Wells Fargo & Company/mn | 1,474 | 0.00 | 47 | 11.90 | ||||
| 2025-08-11 | 13F | Wealthgarden F.s. Llc | 22,494 | -5.71 | 709 | 2.02 | ||||
| 2025-07-23 | 13F | Nbt Bank N A /ny | 3,080 | 0.00 | 98 | 10.11 | ||||
| 2025-08-04 | 13F | Creative Financial Designs Inc /adv | 770 | 0.00 | 25 | 9.09 | ||||
| 2025-07-17 | 13F | Clear Point Advisors Inc. | 22,283 | 0.00 | 712 | 9.72 | ||||
| 2025-07-22 | 13F | Berger Financial Group, Inc | 198,789 | -8.22 | 6,349 | 0.67 | ||||
| 2025-05-08 | 13F | Helium Advisors LLC | 0 | -100.00 | 0 | |||||
| 2025-08-01 | 13F | Corrado Advisors, Llc | 7,312 | -93.60 | 234 | -93.00 | ||||
| 2025-08-12 | 13F | LPL Financial LLC | 36,112 | 72.87 | 1,153 | 89.64 | ||||
| 2025-07-25 | 13F | Atria Wealth Solutions, Inc. | 0 | -100.00 | 0 | |||||
| 2025-08-07 | 13F | PFG Advisors | 6,517 | 208 | ||||||
| 2025-08-11 | 13F | HighTower Advisors, LLC | 56,375 | -73.43 | 1,801 | -70.86 | ||||
| 2025-08-14 | 13F | Royal Bank Of Canada | 1,000 | 0.00 | 32 | 10.34 | ||||
| 2025-07-15 | 13F | BCS Wealth Management | 21,251 | -10.49 | 1 | |||||
| 2025-08-05 | 13F | WorthPointe, LLC | 45,395 | -2.90 | 1,450 | 6.47 | ||||
| 2025-08-12 | 13F | Jacobi Capital Management LLC | 16,561 | 0.00 | 529 | 9.54 | ||||
| 2025-07-29 | 13F | Chicago Partners Investment Group LLC | 7,483 | 0.00 | 241 | 6.64 | ||||
| 2025-08-14 | 13F | Mml Investors Services, Llc | 146,987 | 6.34 | 5 | 0.00 | ||||
| 2025-07-16 | 13F | Signaturefd, Llc | 12,533 | 0.00 | 400 | 9.89 | ||||
| 2025-08-12 | 13F | MAI Capital Management | 4,204 | 44.37 | 134 | 59.52 | ||||
| 2025-08-15 | 13F | Kestra Advisory Services, LLC | 30,659 | 27.03 | 979 | 39.46 | ||||
| 2025-07-28 | 13F | Compass Advisory Group LLC | 12,329 | 0.00 | 394 | 9.47 | ||||
| 2025-08-08 | 13F | Avantax Advisory Services, Inc. | 30,387 | 8.35 | 971 | 18.87 | ||||
| 2025-08-08 | 13F | Cetera Investment Advisers | 114,523 | -4.28 | 3,658 | 4.97 | ||||
| 2025-08-11 | 13F | Nations Financial Group Inc, /ia/ /adv | 15,250 | 0.00 | 487 | 9.68 | ||||
| 2025-08-14 | 13F | CoreCap Advisors, LLC | 2,969 | 160.44 | 95 | 184.85 | ||||
| 2025-07-21 | 13F | DHJJ Financial Advisors, Ltd. | 18,552 | -1.03 | 593 | 8.62 | ||||
| 2025-07-24 | 13F | Us Bancorp \de\ | 16 | 1 | ||||||
| 2025-08-12 | 13F | Long Island Wealth Management, Inc. | 47,936 | 54.67 | 1,531 | 69.73 | ||||
| 2025-07-28 | 13F | Cypress Wealth Services, LLC | 46,291 | 0.00 | 1,479 | 9.73 | ||||
| 2025-08-12 | 13F | Proequities, Inc. | 0 | 0 | ||||||
| 2025-07-25 | 13F | Cwm, Llc | 9,437 | 31.45 | 0 | |||||
| 2025-08-12 | 13F | Coldstream Capital Management Inc | 0 | -100.00 | 0 | |||||
| 2025-07-28 | 13F | Harbour Investments, Inc. | 2,523 | -67.79 | 81 | -64.91 | ||||
| 2025-07-24 | 13F | Stonebridge Financial Group, LLC | 0 | -100.00 | 0 | |||||
| 2025-07-22 | 13F | Global Strategic Investment Solutions, LLC | 154,240 | -3.13 | 4,926 | 6.26 | ||||
| 2025-08-12 | 13F | AlphaCore Capital LLC | 3,400 | -5.56 | 109 | 3.85 | ||||
| 2025-07-11 | 13F | Cypress Financial Planning Llc | 11,324 | -1.37 | 362 | 8.08 | ||||
| 2025-07-10 | 13F | NorthCrest Asset Manangement, LLC | 10,807 | 0.00 | 344 | 9.24 | ||||
| 2025-08-14 | 13F | First Commonwealth Financial Corp /pa/ | 6,513 | -22.30 | 208 | -14.75 | ||||
| 2025-07-09 | 13F | Fragasso Group Inc. | 6,882 | 0.00 | 220 | 9.50 | ||||
| 2025-08-14 | 13F | Financial Network Wealth Advisors LLC | 982 | 10.71 | 31 | 24.00 | ||||
| 2025-07-01 | 13F | Harbor Investment Advisory, Llc | 1,110 | 0.00 | 35 | 9.38 | ||||
| 2025-08-12 | 13F | Tradition Wealth Management, LLC | 9,274 | 0.00 | 296 | 9.63 | ||||
| 2025-07-22 | 13F | Miracle Mile Advisors, LLC | 13,114 | 0.00 | 419 | 9.71 | ||||
| 2025-08-14 | 13F | Sunbelt Securities, Inc. | 3,015 | 0.00 | 84 | -4.60 | ||||
| 2025-08-14 | 13F | IHT Wealth Management, LLC | 7,924 | 253 | ||||||
| 2025-07-29 | 13F | Ifrah Financial Services, Inc. | 25,986 | -1.24 | 830 | 8.22 | ||||
| 2025-08-08 | 13F | Kingsview Wealth Management, LLC | 9,130 | 9.52 | 292 | 20.25 | ||||
| 2025-08-13 | 13F | Capital Analysts, Inc. | 4,525 | 0.00 | 0 | |||||
| 2025-07-21 | 13F | Triad Wealth Partners, LLC | 23,096 | 70.09 | 738 | 86.58 | ||||
| 2025-07-11 | 13F | Lantz Financial LLC | 54,216 | 0.08 | 1,732 | 9.77 | ||||
| 2025-07-17 | 13F | Janney Montgomery Scott LLC | 19,473 | 0.00 | 1 | |||||
| 2025-07-18 | 13F | Truist Financial Corp | 10,744 | 343 | ||||||
| 2025-08-12 | 13F | Bedel Financial Consulting, Inc. | 81,834 | 0.00 | 2,614 | 5.11 | ||||
| 2025-05-12 | 13F | Fmr Llc | 0 | -100.00 | 0 | |||||
| 2025-08-12 | 13F | Steward Partners Investment Advisory, Llc | 8,844 | -3.28 | 282 | 6.02 | ||||
| 2025-07-29 | 13F | Straight Path Wealth Management | 33,247 | 1,062 | ||||||
| 2025-08-06 | 13F | Commonwealth Equity Services, Llc | 153,001 | -11.29 | 5 | -20.00 | ||||
| 2025-08-13 | 13F | Cerity Partners LLC | 15,988 | -9.84 | 511 | -1.16 | ||||
| 2025-08-25 | 13F/A | Kovitz Investment Group Partners, LLC | 0 | -100.00 | 0 | |||||
| 2025-07-24 | 13F | IFP Advisors, Inc | 19,379 | -0.26 | 619 | 9.38 | ||||
| 2025-08-08 | 13F | Compass Financial Services Inc | 255 | 0.00 | 8 | 14.29 | ||||
| 2025-08-14 | 13F | Susquehanna International Group, Llp | 0 | -100.00 | 0 | |||||
| 2025-07-09 | 13F | HFG Wealth Management, LLC | 0 | -100.00 | 0 | |||||
| 2025-07-10 | 13F | Wealth Enhancement Advisory Services, Llc | 29,226 | 0.23 | 930 | 9.42 | ||||
| 2025-08-04 | 13F | Assetmark, Inc | 165 | 0.00 | 5 | 25.00 | ||||
| 2025-08-14 | 13F | Citadel Advisors Llc | 0 | -100.00 | 0 | |||||
| 2025-07-31 | 13F | Cambridge Investment Research Advisors, Inc. | 21,114 | -2.18 | 1 | |||||
| 2025-07-22 | 13F | Diligent Investors, LLC | 41,582 | -1.51 | 1,328 | 8.06 | ||||
| 2025-07-29 | 13F | BKD Wealth Advisors, LLC | 11,945 | -7.03 | 382 | 1.87 | ||||
| 2025-08-07 | 13F | Allworth Financial LP | 10,424 | 0.00 | 333 | 7.79 | ||||
| 2025-08-11 | 13F | Principal Securities, Inc. | 42,221 | -0.27 | 1,349 | 15.02 | ||||
| 2025-08-15 | 13F | Captrust Financial Advisors | 24,580 | 0.00 | 785 | 9.79 | ||||
| 2025-08-07 | 13F | Resources Investment Advisors, LLC. | 28,850 | 15.63 | 921 | 26.86 | ||||
| 2025-08-07 | 13F | Americana Partners, LLC | 85,328 | 62.87 | 2,725 | 78.69 | ||||
| 2025-08-14 | 13F | GWM Advisors LLC | 7,665 | 0.00 | 245 | 9.42 | ||||
| 2025-07-14 | 13F | AdvisorNet Financial, Inc | 1,506 | -55.43 | 48 | -51.02 | ||||
| 2025-07-31 | 13F | Gill Capital Partners, Llc | 8,205 | 0.00 | 262 | 10.08 | ||||
| 2025-05-14 | 13F | CIBC Private Wealth Group, LLC | 0 | -100.00 | 0 | |||||
| 2025-08-13 | 13F | M Holdings Securities, Inc. | 23,233 | 8.08 | 1 | |||||
| 2025-08-06 | 13F | Founders Financial Securities Llc | 17,181 | 29.22 | 549 | 37.69 | ||||
| 2025-08-13 | 13F | SageView Advisory Group, LLC | 0 | -100.00 | 0 | |||||
| 2025-08-14 | 13F | Raymond James Financial Inc | 50,713 | -7.65 | 1,620 | 1.25 | ||||
| 2025-07-29 | 13F | Stratos Wealth Advisors, LLC | 74,345 | -6.15 | 2,375 | 2.95 | ||||
| 2025-07-31 | 13F | Schneider Downs Wealth Management Advisors, LP | 15,436 | 493 | ||||||
| 2025-04-29 | 13F | U.S. Capital Wealth Advisors, LLC | 0 | -100.00 | 0 | |||||
| 2025-08-14 | 13F | Benjamin Edwards Inc | 8,934 | 285 | ||||||
| 2025-08-08 | 13F | Capital Investment Advisory Services, LLC | 3,000 | 0.00 | 96 | 9.20 | ||||
| 2025-07-16 | 13F | PFS Partners, LLC | 1,726 | 55 | ||||||
| 2025-08-01 | 13F | Envestnet Asset Management Inc | 187,222 | 11.94 | 5,980 | 22.77 | ||||
| 2025-08-12 | 13F | Jpmorgan Chase & Co | 16,050 | 493.57 | 513 | 556.41 | ||||
| 2025-07-24 | 13F | Blair William & Co/il | 150,275 | -8.01 | 4,800 | 0.90 | ||||
| 2025-08-12 | 13F | Archer Investment Corp | 9 | 0.00 | 0 | |||||
| 2025-08-15 | 13F | Chapman Financial Group, Llc | 4,530 | 169.64 | 145 | 213.04 | ||||
| 2025-09-04 | 13F/A | Advisor Group Holdings, Inc. | 231,100 | 31.80 | 7,381 | 44.58 | ||||
| 2025-08-14 | 13F | UBS Group AG | 4,192 | -26.21 | 134 | -19.39 |