Basic Stats
| Institutional Owners | 64 total, 64 long only, 0 short only, 0 long/short - change of 8.47% MRQ |
| Average Portfolio Allocation | 0.3174 % - change of 0.42% MRQ |
| Institutional Shares (Long) | 6,782,844 (ex 13D/G) - change of 0.70MM shares 11.47% MRQ |
| Institutional Value (Long) | $ 223,616 USD ($1000) |
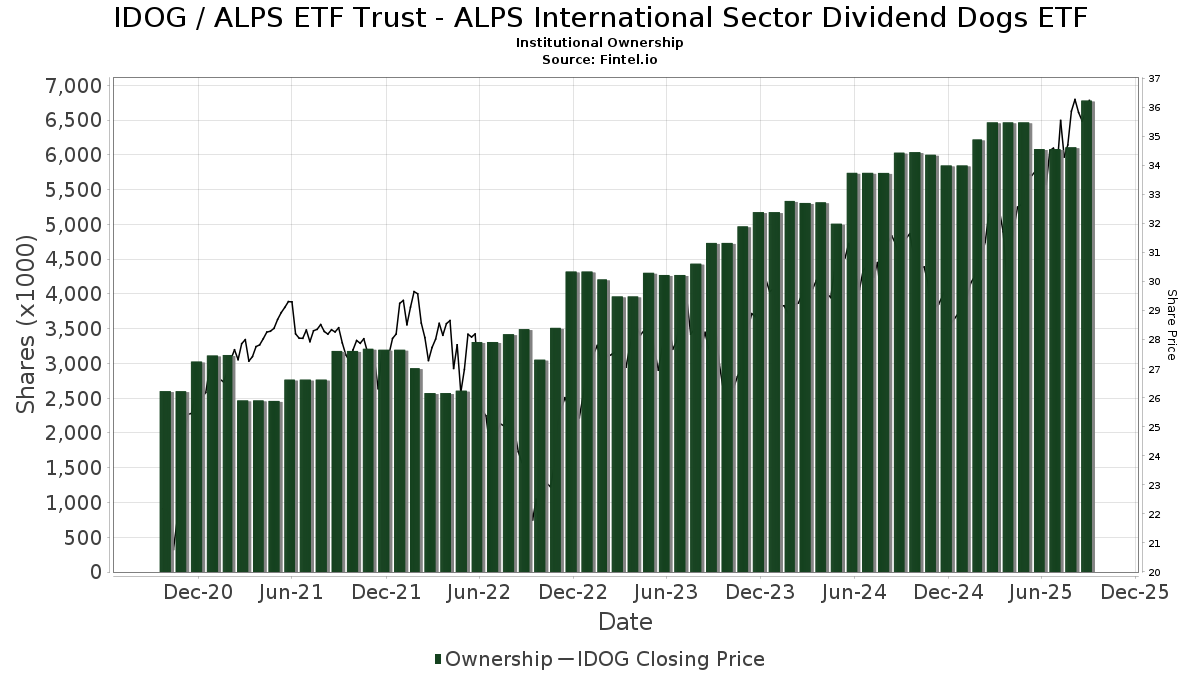
Institutional Ownership and Shareholders
ALPS ETF Trust - ALPS International Sector Dividend Dogs ETF (US:IDOG) has 64 institutional owners and shareholders that have filed 13D/G or 13F forms with the Securities Exchange Commission (SEC). These institutions hold a total of 6,782,844 shares. Largest shareholders include Morgan Stanley, Avantax Planning Partners, Inc., Avantax Advisory Services, Inc., Del-Sette Capital Management, LLC, Buckingham Strategic Partners, Brady Martz Wealth Solutions, LLC, Bank Of America Corp /de/, UBS Group AG, Wells Fargo & Company/mn, and Envestnet Asset Management Inc .
ALPS ETF Trust - ALPS International Sector Dividend Dogs ETF (ARCA:IDOG) institutional ownership structure shows current positions in the company by institutions and funds, as well as latest changes in position size. Major shareholders can include individual investors, mutual funds, hedge funds, or institutions. The Schedule 13D indicates that the investor holds (or held) more than 5% of the company and intends (or intended) to actively pursue a change in business strategy. Schedule 13G indicates a passive investment of over 5%.
The share price as of September 5, 2025 is 35.96 / share. Previously, on September 6, 2024, the share price was 30.94 / share. This represents an increase of 16.22% over that period.
Fund Sentiment Score
The Fund Sentiment Score (fka Ownership Accumulation Score) finds the stocks that are being most bought by funds. It is the result of a sophisticated, multi-factor quantitative model that identifies companies with the highest levels of institutional accumulation. The scoring model uses a combination of the total increase in disclosed owners, the changes in portfolio allocations in those owners and other metrics. The number ranges from 0 to 100, with higher numbers indicating a higher level of accumulation to its peers, and 50 being the average.
Update Frequency: Daily
See Ownership Explorer, which provides a list of highest-ranking companies.
Institutional Put/Call Ratio
In addition to reporting standard equity and debt issues, institutions with more than 100MM assets under management must also disclose their put and call option holdings. Since put options generally indicate negative sentiment, and call options indicate positive sentiment, we can get a sense of the overall institutional sentiment by plotting the ratio of puts to calls. The chart to the right plots the historical put/call ratio for this instrument.
Using Put/Call Ratio as an indicator of investor sentiment overcomes one of the key deficiencies of using total institutional ownership, which is that a significant amount of assets under management are invested passively to track indices. Passively-managed funds do not typically buy options, so the put/call ratio indicator more closely tracks the sentiment of actively-managed funds.
13F and NPORT Filings
Detail on 13F filings are free. Detail on NP filings require a premium membership. Green rows indicate new positions. Red rows indicate closed positions. Click the link icon to see the full transaction history.
Upgrade
to unlock premium data and export to Excel ![]() .
.
| File Date | Source | Investor | Type | Avg Price (Est) |
Shares | Δ Shares (%) |
Reported Value ($1000) |
Δ Value (%) |
Port Alloc (%) |
|
|---|---|---|---|---|---|---|---|---|---|---|
| 2025-07-21 | 13F | Ameriflex Group, Inc. | 0 | -100.00 | 0 | |||||
| 2025-07-25 | 13F | Cwm, Llc | 18,017 | 36.28 | 1 | |||||
| 2025-08-14 | 13F | Wells Fargo & Company/mn | 206,418 | 20.22 | 7,002 | 28.81 | ||||
| 2025-04-29 | 13F | Sierra Ocean, Llc | 0 | -100.00 | 0 | |||||
| 2025-08-08 | 13F | Pnc Financial Services Group, Inc. | 2,014 | 0.00 | 68 | 7.94 | ||||
| 2025-07-14 | 13F | Brady Martz Wealth Solutions, LLC | 342,116 | -1.72 | 11,605 | 5.32 | ||||
| 2025-07-17 | 13F | Nelson, Van Denburg & Campbell Wealth Management Group, LLC | 6,960 | 0.00 | 236 | 7.27 | ||||
| 2025-08-14 | 13F | Comerica Bank | 1,029 | 199.13 | 35 | 240.00 | ||||
| 2025-05-14 | 13F | Colonial Trust Co / SC | 0 | -100.00 | 0 | |||||
| 2025-08-13 | 13F | Wambolt & Associates, LLC | 8,350 | -0.70 | 284 | 5.99 | ||||
| 2025-08-11 | 13F | Avantax Planning Partners, Inc. | 976,751 | -2.42 | 33,131 | 4.57 | ||||
| 2025-08-14 | 13F | Jane Street Group, Llc | 38,020 | 1,290 | ||||||
| 2025-08-07 | 13F | Cahill Financial Advisors Inc | 67,545 | 0.30 | 2,291 | 7.51 | ||||
| 2025-07-18 | 13F | Founders Capital Management | 69 | 0.00 | 2 | 0.00 | ||||
| 2025-07-24 | 13F | Us Bancorp \de\ | 1,737 | 59 | ||||||
| 2025-08-14 | 13F | Mariner, LLC | 20,650 | -1.80 | 700 | 5.26 | ||||
| 2025-09-04 | 13F/A | Advisor Group Holdings, Inc. | 32,343 | 92.76 | 1,097 | 106.59 | ||||
| 2025-08-01 | 13F | Envestnet Asset Management Inc | 154,429 | 9.67 | 5,238 | 17.52 | ||||
| 2025-08-12 | 13F | Del-Sette Capital Management, LLC | 409,985 | -4.94 | 13,907 | 1.87 | ||||
| 2025-08-14 | 13F | UBS Group AG | 279,057 | 16.37 | 9,466 | 24.70 | ||||
| 2025-05-09 | 13F | CoreCap Advisors, LLC | 0 | -100.00 | 0 | |||||
| 2025-08-14 | 13F | Integrated Wealth Concepts LLC | 26,573 | -1.41 | 901 | 5.63 | ||||
| 2025-08-11 | 13F | Brown Brothers Harriman & Co | 350 | 12 | ||||||
| 2025-08-12 | 13F | Steward Partners Investment Advisory, Llc | 24,514 | 387.36 | 832 | 422.64 | ||||
| 2025-07-25 | 13F | Apollon Wealth Management, LLC | 20,707 | -9.97 | 702 | -3.57 | ||||
| 2025-07-29 | 13F | Salomon & Ludwin, LLC | 705 | 0.00 | 24 | 9.09 | ||||
| 2025-08-11 | 13F | Regal Investment Advisors LLC | 9,606 | -4.47 | 326 | 2.20 | ||||
| 2025-08-15 | 13F | Morgan Stanley | 1,250,270 | 19.19 | 42,409 | 27.72 | ||||
| 2025-08-13 | 13F | Jones Financial Companies Lllp | 38,089 | 38.86 | 1,286 | 47.03 | ||||
| 2025-07-31 | 13F | Cambridge Investment Research Advisors, Inc. | 9,668 | -4.79 | 0 | |||||
| 2025-07-28 | 13F | ForthRight Wealth Management, LLC | 134,915 | 8.38 | 4,576 | 16.14 | ||||
| 2025-08-12 | 13F | LPL Financial LLC | 77,456 | -1.48 | 2,627 | 5.59 | ||||
| 2025-07-09 | 13F | Fermata Advisors, LLC | 27,417 | -0.68 | 930 | 6.41 | ||||
| 2025-08-06 | 13F | First Horizon Advisors, Inc. | 135,357 | 13.24 | 4,591 | 21.36 | ||||
| 2025-08-07 | 13F | Kestra Private Wealth Services, Llc | 64,342 | 0.27 | 2,182 | 7.43 | ||||
| 2025-08-07 | 13F | American Alpha Advisors, LLC | 120,129 | 652.03 | 4,075 | 706.73 | ||||
| 2025-08-14 | 13F | Royal Bank Of Canada | 117,443 | 4.44 | 3,984 | 11.94 | ||||
| 2025-08-14 | 13F | Ameriprise Financial Inc | 95,999 | 24.54 | 3,256 | 33.28 | ||||
| 2025-08-04 | 13F | Hantz Financial Services, Inc. | 0 | -100.00 | 0 | |||||
| 2025-07-08 | 13F | Nbc Securities, Inc. | 1,580 | 0.00 | 0 | |||||
| 2025-08-08 | 13F | Avantax Advisory Services, Inc. | 809,108 | 5.64 | 27,445 | 13.20 | ||||
| 2025-08-08 | 13F | Cetera Investment Advisers | 21,876 | 138.72 | 742 | 155.86 | ||||
| 2025-07-17 | 13F | Janney Montgomery Scott LLC | 17,562 | 29.75 | 1 | |||||
| 2025-08-12 | 13F | Tocqueville Asset Management L.p. | 24,953 | 846 | ||||||
| 2025-08-14 | 13F | Bank Of America Corp /de/ | 320,122 | 3.86 | 10,859 | 11.30 | ||||
| 2025-08-13 | 13F | Baird Financial Group, Inc. | 17,894 | 5.61 | 607 | 13.06 | ||||
| 2025-08-12 | 13F | Global Retirement Partners, LLC | 11 | 10.00 | 0 | |||||
| 2025-08-13 | 13F | Northwestern Mutual Wealth Management Co | 2,360 | 54.05 | 80 | 66.67 | ||||
| 2025-07-25 | 13F | We Are One Seven, LLC | 8,049 | 4.74 | 273 | 12.35 | ||||
| 2025-08-14 | 13F | Susquehanna International Group, Llp | 13,420 | 455 | ||||||
| 2025-08-14 | 13F | Stifel Financial Corp | 9,497 | 1.45 | 322 | 8.78 | ||||
| 2025-08-14 | 13F | Federation des caisses Desjardins du Quebec | 27,446 | 0.00 | 931 | 7.14 | ||||
| 2025-08-11 | 13F | Alps Advisors Inc | 97,965 | 3,323 | ||||||
| 2025-08-14 | 13F | Old Mission Capital Llc | 48,141 | -16.70 | 1,633 | -10.77 | ||||
| 2025-07-25 | 13F | Genesee Capital Advisors, LLC | 93,936 | 2.71 | 3,186 | 10.05 | ||||
| 2025-07-31 | 13F | Buckingham Strategic Partners | 347,791 | -1.69 | 11,797 | 5.35 | ||||
| 2025-08-14 | 13F | Fmr Llc | 1,305 | 4.32 | 44 | 12.82 | ||||
| 2025-07-29 | 13F | Private Trust Co Na | 821 | -2.96 | 28 | 3.85 | ||||
| 2025-08-12 | 13F | Proequities, Inc. | 0 | 0 | ||||||
| 2025-08-13 | 13F | Flow Traders U.s. Llc | 31,148 | 1 | ||||||
| 2025-08-14 | 13F | Wiley Bros.-aintree Capital, Llc | 10,533 | -11.82 | 357 | -6.05 | ||||
| 2025-08-06 | 13F | Commonwealth Equity Services, Llc | 111,601 | -7.77 | 4 | 0.00 | ||||
| 2025-07-14 | 13F | AdvisorNet Financial, Inc | 48 | 0.00 | 2 | 0.00 | ||||
| 2025-08-14 | 13F | Heritage Wealth Management, Inc. | 7,756 | -1.92 | 263 | 5.20 | ||||
| 2025-08-07 | 13F | Parkside Financial Bank & Trust | 8 | 0.00 | 0 | |||||
| 2025-05-12 | 13F | Kohmann Bosshard Financial Services, LLC | 0 | -100.00 | 0 | |||||
| 2025-07-07 | 13F | Thurston, Springer, Miller, Herd & Titak, Inc. | 3,074 | 765.92 | 104 | 845.45 | ||||
| 2025-08-12 | 13F | BlackRock, Inc. | 213 | 0.00 | 7 | 16.67 | ||||
| 2025-08-14 | 13F | Raymond James Financial Inc | 34,850 | -0.32 | 1,182 | 6.87 | ||||
| 2025-07-31 | 13F | Glass Jacobson Investment Advisors llc | 460 | 0.00 | 16 | 15.38 | ||||
| 2025-08-18 | 13F | Geneos Wealth Management Inc. | 286 | 0.00 | 10 | 0.00 |